Based on the dispersive feature of the dielectric function of noble metals and the wave vector conservation in physics, both the plasma effect and the complex refractive index, which are profoundly correlated to the complex dielectric function and permeability, have been studied and analyzed. The condition to induce a bulk or a surface plasma in the visible region will not be satisfied, and there will be one solution for the real and the imaginary parts of the refractive index, restricting it only to region I of the complex plane. The results given in this work will aid in understanding the properties of light transmission at the metal/dielectric interface as characterized by the law of refraction in nature.
The phenomenon of light refracted at the interface of two media can be expressed by Snell’s law [1]:

where θ1 and θ2 are the incidence and the refraction angles, and n1 and n2 are the refractive indices of media 1 and 2, respectively. The refractive index will be a real and positive number for non-absorbing media, as will be the incidence and the refraction angles. However, the refractive index n will be a complex number for optically absorbing materials, as will be the refraction angle

appearing in a more general formation of Snell’s law [2,3]:

Under certain conditions, a mathematical solution for the negative refraction index might happen as prescribed by Veselago [4]. Since then, great effort has been made to study the intrinsic physical origins of negative refraction with different approaches and assumptions, such as plasma resonances [5], negative permeability μ [4,6], a negative Goos-Hanchen shift [7], fish-net magnetic effects [8], and so on. Usually, the noble metals with strong optical absorption in the visible region are the fundamental materials used to make negative refraction occur in metamaterials. In the Drude region of the noble metals, a dielectric function with a negative real part is characteristic of “free” electrons, and in the interband region, the real part and the optical response of the dielectric function are determined by “bound” electrons. In terms of the complex plane, we have studied the plasma resonance effect and the refractive index deduced from the complex dielectric function and permeability under certain physical conditions. We hope the results with detailed discussions given in this work will further help the understanding of light propagation behavior at the metal/dielectric interface.
II. PLASMA RESONANCE EFFECT IN THE DRUDE REGION
The plasma resonance effect has been used to explain the origin of negative refraction at the metal/air interface and should be studied and discussed in more detail [5,11]. In the free-electron approximation, the collective motion of the electron gas in the metal can be excited by an electric field at the plasma frequency ωp to satisfy the condition D = 0 with ε = 0 [3,12,13]. According to Maxwell’s equations:
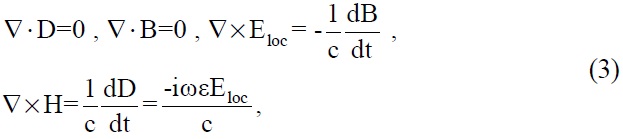
where ω is the frequency of the electromagnetic field in oscillation and B is the magnetic field related to the vector H as B = μH. When the plasma resonance occurs at frequency ωp and ε = 0, this leads to

which means that Eloc is a longitudinal field, which is not characteristic of an electromagnetic field of the photons interacting with electrons in the metal. The issue about whether the plasmons cannot be excited by the photons was mentioned by Wooten in his book [12]. Johnson and Christy [14] measured the dielectric functions of thermoevaporated thin noble metal films by using reflection and transmission methods to find that under the condition ε ? 0 (ε = ε1 + iε2, ε1 = 0 and ε2 is small) and in the 0.5- to 6.5-eV photon energy region, the plasma resonance occurs only for Ag at about 3.75 eV which is lower than ?ωp (? 9 eV), but not for Cu and Au. The zero of ε1 of Ag at about 3.75 eV is actually attributed to the onset of interband transitions in the region.
The plasmons are longitudinal excitations in the volume of an electron gas. As longitudinal excitations, they do not couple to transverse electromagnetic waves and are usually studied by using electron energy loss spectroscopy. When a surface or interface is present, surface plasmons exist if the dielectric functions have suitable properties. For a free-electron gas-vacuum interface, a surface plasmon is found at the frequency ε1 = -1, which is at
provided ε2 is not too large at this energy.
For the noble metals with a mean free time τ between collisions of the electrons in the near infrared and visible frequency regions, where ωτ >> 1 is satisfied, the dielectric function to be used is then the sum of εb and the Drude terms
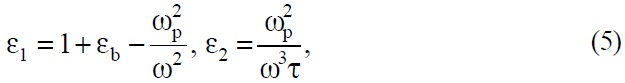
where the term εb represents the polarization of the electrons in the core energy bands in response to the oscillating electric field.
For the noble metals, εb is large, and the surface plasmon condition, ε1 = -1, is shifted to energies well below
to a region where damping may be rather large. For Ag, the zero of ε1 is at about 3.75 eV where the value of ε2 is less than 0.5, indicating that in Ag there is a welldefined plasma resonance and that it is shifted in energy to far below the free-electron gas value by the polarization associated with the interband transitions. In Cu and Au, there is too much damping from plasmon decay into interband excitations so that distinct peaks in the electron energy loss spectra, Im[-1/(ε1 + iε2)], are not seen, nor are peaks in the surface energy loss spectra [15-17].
As a medium with a positive dielectric constant εd contacts the metal, the electromagnetic field of only the p-polarized light (the field parallel to the incidence plane) with wave vector ks along the metal/dielectric interface will stimulate a surface plasmon resonance at the surface plasma frequency ωsp [13,15-17]:
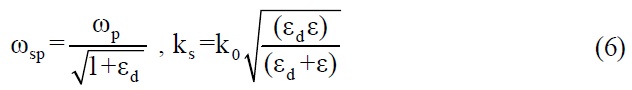
where k0 (k0=ω/c) is the wave vector in vacuum. At the noble-metal/air interface, εd =1, ?ωsp ? 0.7 ?ωp ? 6.3 eV. At the noble-metal/dielectric interface, most dielectric media are transparent in the near infrared and visible regions
with a refractive index nd in the 1.3 - 2.5 range, εd (εd= nd2) in the 1.7 - 6.3 range, and ?ωsp ? (0.37-0.61) ?ωp ? 3.3 - 5.5 eV. The estimated values of the surface-plasma frequency ωsp under those conditions are in reasonable agreement
with that shown in Fig. 2.3 of Maier’s book [13]; thus, the surface plasmon will not be observed in the near infrared and visible regions where E < 3.1 eV.
In terms of the dispersion of the dielectric functions given in Eq. (5), the bulk plasma frequency ωp of the noble metals has been precisely measured and is in good agreement with the theoretical prediction [14,18-20]. The characteristic of the surface plasma frequency ωsp, however, has not been explicitly measured with confirmed comparison to the theoretical prediction for most metal/dielectric interface structures. For the simplest case with εd =1 at the metal/air interface, Eq. (6) can be re-written as
If the imaginary part of the dielectric function is omitted in the Drude region near Eg where ε1 = -1, only possible for Ag, the wave vector ks will be a pure infinite imaginary quantity, forbidding the propagation of the field along the interface.
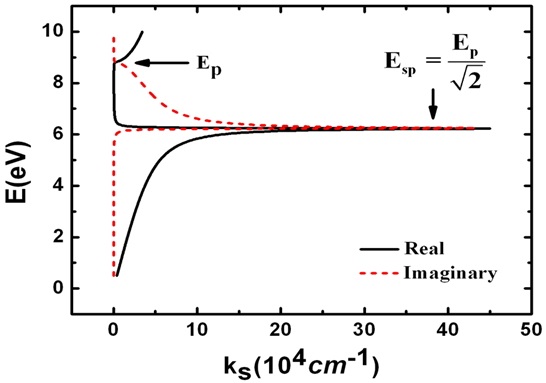
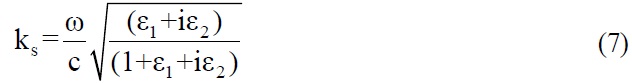
Assuming omission of the core election polarization εb and the interband transitions, and inserting the Drude parameters for Cu (Ep = 8.82 eV, and τ = 2.6×10⁻¹⁴ sec [19] into the dielectric functions in Eq. (5), the dispersion relation of the photon energy E(?ω) vs. the complex surface wave vector ks (ks = ks1+iks2) according to Eq. (7) is plotted in Fig. 1. Sharp resonance peaks of the real and imaginary surface wave vectors can be clearly seen to occur at nearly the same frequency ωsp or energy

where (1 + ε1) ? 0, but there is no surface plasma resonance in the near infrared and visible Drude region where E < Esp. For the attenuated field of the surface wave which will propagate a distance d in absorptive material, the intensity of the wave will decay to exp(-2ks2d). The high value (~ 4×105cm-1) of the imaginary wave vector ks2 means that the surface wave along the interface can propagate only a very short distance d of about 12.5 nm at an energy E = Esp.
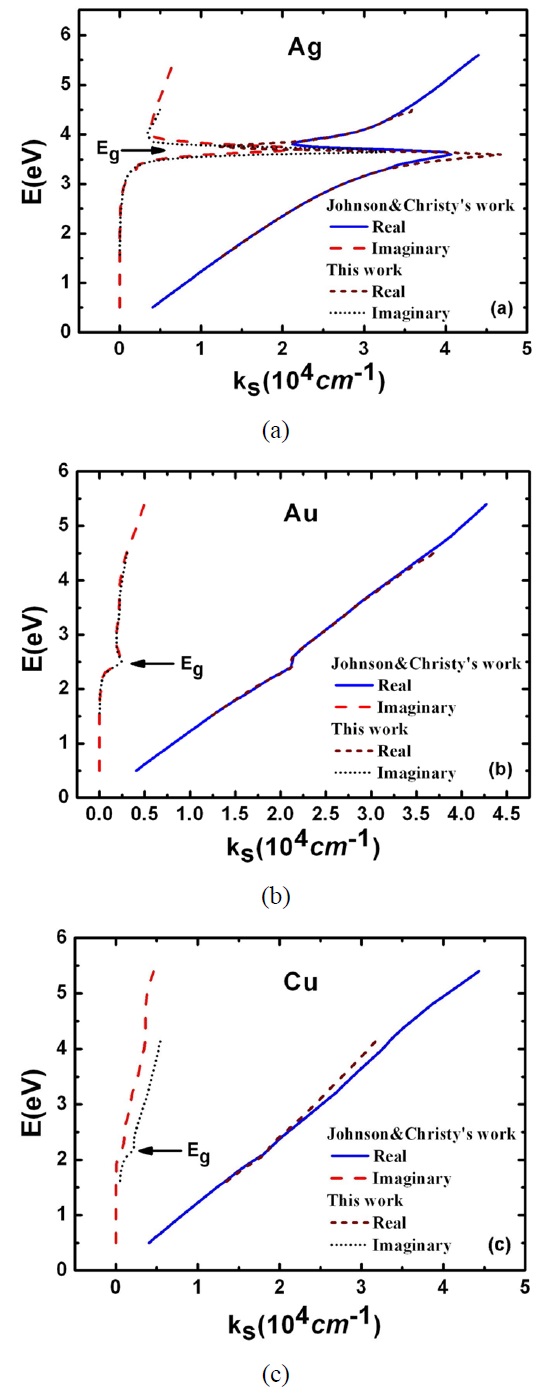
To consider more practically the situation in which both intraband and interband transitions occur in the region E < Ep, we used the experimental data for the dielectric functions measured in this and Johnson and Christy’s work [14] for the noble metals Cu, Au and Ag to calculate the dispersion curves, E(?ω) vs. ks, with the results shown in Fig. 2. There are indeed some resonance-like features at about 2.1 eV, 2.5 eV and 3.9 eV for Cu, Au and Ag, respectively. In terms of data analysis, it can be seen clearly that these resonance-like features are actually not attributed to the surface plasma resonance but to the dip and smaller values of the dielectric functions, which change dramatically in the region where the intraband and the interband transitions near Eg cross, as discussed above. The resonance-like feature for Cu gets much weaker due to the onset of interband transitions closer to the tail of the intraband transition in the region where the magnitude of the dielectric function of Cu is large.
Turbadar first observed the resonance-like dip in the internal reflection of p-polarized light in the visible region for a structure in which thin metal films were deposited on the bottom of a glass prism. He did not attribute the phenomenon to a surface plasma resonance because the feature could be well explained by using conventional film equations [21,22]. Later, Otto [23] and Kretschmann [24] carried out similar measurements and introduced the plasma polarization concept to explain the phenomenon with resonancelike features that changed with the wavelength and the incidence angle. These were radiative surface plasmons [17], excited by the longitudinal component of the evanescent electromagnetic wave at the interface. Their frequencies were below that of the non-radiative surface plasmon mentioned earlier.
III. EFFECT OF NEGATIVE PERMEABILITY
For the complex refractive index n(n=n+ik, where n and k are the refractive index and the extinction coefficient, respectively) and the complex refraction angle
Eq. (2) can be modified as
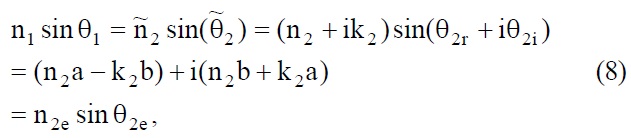
where
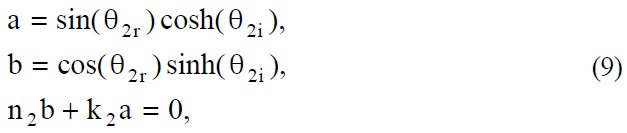
and the effective refraction index n2e and refraction angle θ2e are real numbers that can be quantitatively determined along with their signs, but they usually will be a complicated expression in terms of n1, θ1, n2, the wavelength λ and other physical parameters, which needs to be further studied and verified [3,25]. It is obvious to see in Eqs. (1), (2), (8) and (9) that n2e = n2 will be satisfied only under the condition k2 = 0 for transparent materials; otherwise, n2e ≠ n2 and n2e ≠ n2.
To explain the mechanism of negative refraction for artificial metamaterials, we have assumed a magnetic permeability, μ ≠ 1, μ < 0, and even a complex μ (μ = μ1 + iμ2), though it is not exactly measured or confirmed by experiment [4,26-30]. If a complex permeability is assumed, the complex refractive index n will be a solution of that:

where

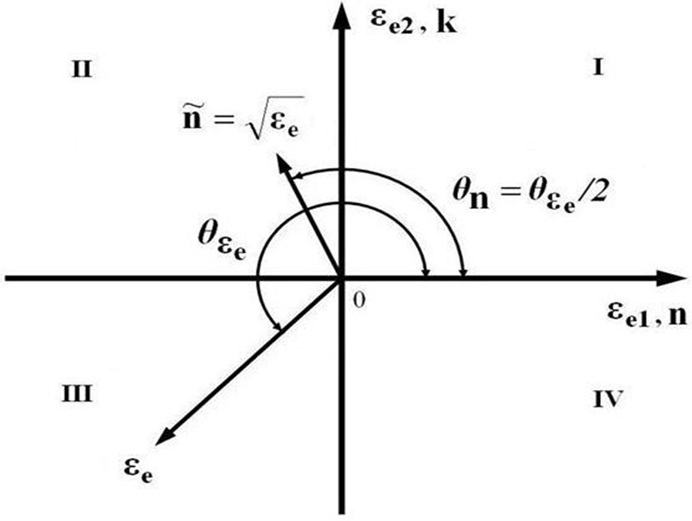
Referring to the complex planes of εe and n shown in Fig. 3, the situation in which n < 0 and k > 0 will be satisfied because εe is restricted to regions III and IV of the lower half of the complex plane, i.e., the region where εe2 = ε1μ2 + ε2μ1 ≤ 0 and 2π ≥ θεe≥ π. The positive rate of energy absorption of the electromagnetic field interacting with metals requires that ε2 ≥ 0 and μ2 ≥ 0 [31].
In region IV, εe1 = ε1μ1 - ε2μ2 ≥ 0 and εe2 = ε1μ2 + ε2μ1 ≤ 0, implying that ε1 and μ1 will have the same sign, i.e., either ε1 < 0 and μ1 <0, or ε1 > 0 and μ1 > 0 for the condition of εe1 ≥ 0, but εe2 ≤ 0 will not be satisfied for the case in which ε1 > 0 and μ1 > 0. When θεecontinuously changes to the region in which θεe= 2π, θn = π and εe2 = ε1μ2 + ε2μ1 = 0, k moves to 0 and n (n = -|n|,) becomes a pure negative real number [8], but εe2 = ε1μ2 + ε2μ1 = 0, which means that ε1 and μ1 will have opposite signs, contradicting the condition that εe1 = ε1μ1 - ε2μ2 > 0 in which ε1 and μ1 should have the same sign. This makes a pure negative refractive index (n = -|n|) invalid even for the situation in which the complex magnetic permeability μ is introduced as an assumption.
The reflectivity R under the normal incidence condition is defined in optics as that [3,12]:
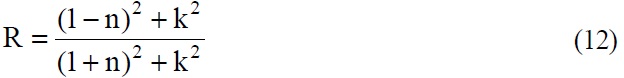
In regions I and II, as n changes from negative to positive by passing the zero point at which n = 0, implying that R = 1 which is not valid and has not yet observed in experiment for the optically absorbing and passive materials and structures in the nature.
In region III, θεe= 3π/2, θn = 3π/4, εe1 = 0 and εe2 < 0 lead to k = n and ε1/ε2 = μ2/μ1, implying that ε1 and μ1 have the same sign, i.e., ε1 < 0 and μ1 < 0 for the noble metals. Because |ε1/ε2| >> 1 for the noble metals in the near infrared and visible parts of the Drude region where E < Eg, μ2 >> |μ1| means a very high absorption of the magnetic field in the metal. As θεe= π, θn = π/2 and n = ik, the refractive index will be a pure imaginary number, forbidding propagation of the electromagnetic field in the metal, as mentioned above. At the same time, as θεechanges to the position where θεe= π and εe2 = 0, ε1 and μ1 will have opposite signs, and μ1 changes sign from negative to positive due to the negative ε1 in the near infrared and visible regions. According to the dispersion of the dielectric function and permeability, therefore, although mathematically it allows the phase angle θn of n to be in the range 0 to π, by introducing the complex permeability μ, the invalidation of the value at which θn equals π/2 and π will make the refractive index n physically restricted to only region I of the complex plane where n > 0 and k > 0, as seen in Fig. 3.
The magnetic permeability μ in solids arises from micro magnetic dipole moments M responding to an alternating electromagnetic field according to the relations M = χmH and μ = 1 + 4πχm, where χm is the magnetic susceptibility. In the near infrared and visible regions with high optical frequencies, micro-magnetic dipole moments cannot follow the rapid oscillations of the electromagnetic field, resulting in the physical restriction that χm = 0 and μ = 1 [3,12,32]. No serious violation of the restriction μ = 1 has been found in numerous experiments that measured the dielectric function and the refractive index for many materials, including metals, in a wide photon energy range [33].
In this work, we have studied and analyzed the plasma resonance effect and the complex refractive index, which are profoundly correlated to the complex dielectric function and permeability. Due to the dispersive feature of the dielectric function of noble metals and the wave-vector conservation required in physics, it may not be possible for either a bulk or a surface plasma to be induced by photons in the visible region. Mathematically, there are possible two solutions for the refractive index deduced from the square root of the dielectric function and permeability. Physically, however, there will be only one solution for the real and the imaginary parts of the refractive index, restricting it to region I of the complex plane. The results given in this work will be helpful to understand the light refraction phenomena observed in metal-based materials and the structures over the broad frequency region.