Adsorption behavior of counterions under a Langmuir monolayer was investigated by sum-frequency generation (SFG) spectroscopy. By comparing SFG spectra of arachidic acid (AA) Langmuir monolayer/water interface with and without added salt, it was found that the simple trivalent cation La3+ adsorbed on AA monolayer only when the carboxylic headgroups are charged (deprotonated), implying that counterion adsorption is induced by Coulomb interaction. On the other hand, metal hydroxide complex Fe(OH)3 adsorbed even on a charge-neutral AA monolayer, indicating that the adsorption of iron hydroxide is due to chemical interaction such as covalent or hydrogen bonding to the headgroup of the molecules at the monolayer.
Ions in cellular fluid are essential to virtually all processes of living organisms. For example, in the cell membrane of a neuron, the K+/ Na+ pump controls electric potential difference between the inner and the outer cell membrane in order to regulate important cellular functions such as muscle contraction, and neuron function [1]. Mg2+ makes a complex with ATP which carries chemical energy in the cell [2]. Unlike these well-known simple mono- and divalent cations, metal hydroxides such as Fe(OH)x +3-x are rarely found in living organisms. In 1975, Blakemore first found bacteria producing nanosized magnet filament [3]. These bacteria are called magneto-tactic bacteria (MTB) since they detect the Earth’s magnetic field and tend to move toward it. As a natural plant for the production of magnetic nanoparticles, magneto-tactic bacteria have been recently studied by biologists and chemists. Tanaka et al. observed differences in size and crystal structure of nanoparticles by modifying a membrane protein which is supposed to be related to reduction of iron hydroxide [4]. Several previous studies suggested that the hydrophilic part of this membrane protein initiates nucleation of magnetic nanoparticles [5,6]. However, there was a still remaining ambiguity about which chemical group plays the major role in the nucleation process. Understanding the adsorption behavior of iron hydroxide at the molecular level can help to design or to modify the membrane proteins to control the size and crystal structure of magnetic nanoparticles.
To study the properties and functions of the cell membrane consisting of lipids and proteins, a monolayer formed at the air/water interface was commonly used as a model system [7,8]. Due to their amphiphilic property, lipid molecules spontaneously make a mono-molecular thickness layer on a water surface where hydrophobic hydrocarbon chains and hydrophilic chemical groups are directed to the air and the water side, respectively. These monolayers are called Langmuir monolayers. In order to investigate the properties and structures of Langmuir monolayers, many optical techniques have been developed. For example, Brewster-angle microscopy (BAM) images a monolayer by measuring the refractive index difference between water and organic molecules at the surface [9]. Infrared reflection absorption spectroscopy (IRRAS) is able to detect vibrational modes of molecules at the surface monolayer [10]. But BAM gives only information of overall refractive index change at the surface thus is not suitable to monitor the structure of a Langmuir monolayer and the interfacial water separately. And, IRRAS is not sensitive to interfacial water orientation. Therefore, a technique that can observe the subtle change of interfacial water structure expected from ion adsorption to the headgroups of the molecules in the Langmuir monolayer is required.
Sum-frequency generation (SFG) spectroscopy is a probe that ideally satisfies such requirements. As a second-order optical process, SFG is only allowed at the surface or interface where inversion symmetry is broken [11], and is sensitive to molecular orientation and conformation change. Since the invention of infrared-visible SFG spectroscopy by Y. R. Shen and coworkers, it has been widely used to investigate many different surfaces and interfaces. Structural differences between bulk and interfacial water were observed [12]. Surfaces of neat liquids and liquid mixtures were investigated [13,14]. Conformation change of biological model membranes with varying temperature, salt concentration, and pH condition was reported [15-18].
In this report, we used infrared-visible sum-frequency generation (SFG) spectroscopy to investigate the conformation of a biological model membrane consisting of arachidic acid (CH3(CH2)18COOH), as well as water molecules beneath in the presence of multivalent ions in the subphase. Ion adsorption on this model Langmuir monolayer can be effectively monitored from the change in the sum-frequency spectra of interfacial water molecules.
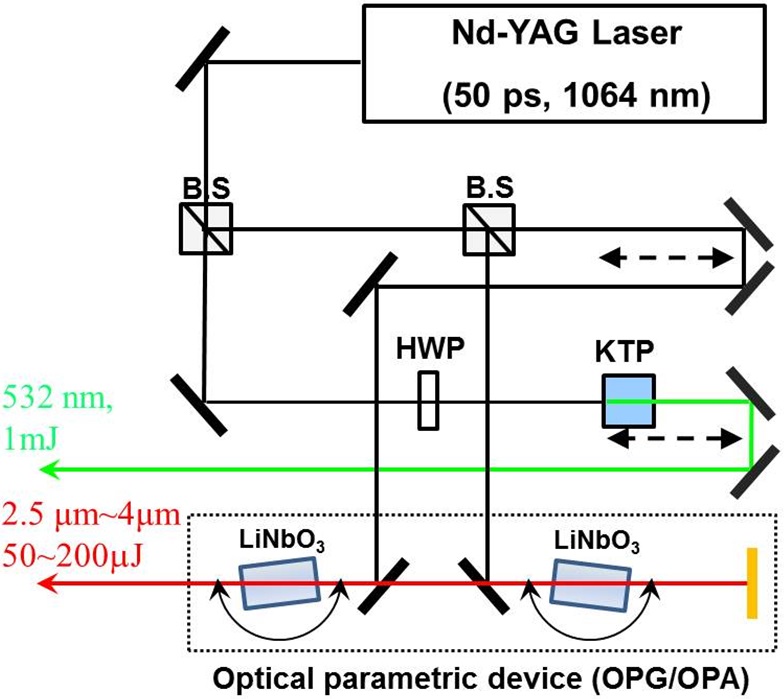
Figure 1 is a schematic description of our experimental setup. In the system, a picosecond Nd:YAG laser (PY-61C, Continuum Inc.) having 1064nm wavelength, ~15 mJ/pulse energy, and 50 ps pulsewidth was used as a light source. By using KTP crystal (CASIX), 532 nm visible light (~1 mJ/pulse)
was generated by a type-II second harmonic generation process. The optical parametric generator/amplifier (OPG/OPA) part of the setup consists of two LiNbO3 crystals (CASIX) connected to the motorized stage. Rotation of the crystals changes the internal angle between the optic axis and the pump beam, and the mid-infrared signal (5400 cm-1 ~ 6600 cm-1) and idler (2800 cm-1 ~ 4000 cm-1) beams satisfying the type-I phase matching condition were generated. 2-mm thickness germanium plate was placed in the exit of the OPG/OPA in order to block the signal and the pump pulses. The energy of the IR idler at the sample stage was ~150 μJ/pulse on average. Visible and the IR beams were incident on the samples at 45° and 60°, respectively, and generated sum-frequency (SF) light in the reflection direction had an angle between 46.7° and 47.3°. SF light was detected by photomultiplier tube (R928, Hamamatsu) and gated integrator (SR250, Stanford Research Systems). During the measurement, mean surface area of arachidic acid was maintained at ~ 20 A2/molecule, corresponding to liquid-condensed (LC) phase of the monolayer, by a homemade Teflon trough (20cm × 10cm× 0.5cm) with a feedback loop from the surface pressure sensor (PS4, KSV NIMA) [8]. All experimental data was taken in SSP (S-polarization in SF signal, S-polarization in visible, and P-polarization in IR, respectively) polarization combination and normalized by SSP SF spectra from z-cut quartz crystal in order to compensate overlapping efficiency of visible and IR beams.
Both arachidic acid (purchased from Sigma) and hexadecanol (purchased from Aldrich) were prepared in chloroform solution (~3 mM). 10 minutes after spreading the stock solution on the water surface in the trough, the monolayer was compressed with a speed of 1 A2/min. To avoid contamination by other organic molecules, the pH of the subphase solution was controlled only by HCl and NaOH without buffer. Afterward, LaCl3 and FeCl3 salts were introduced into the solution.
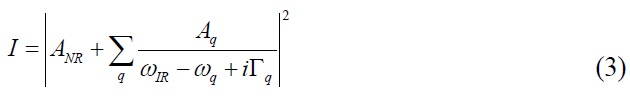
From the theory of SFG, the intensity of SF light can be represented as [13],
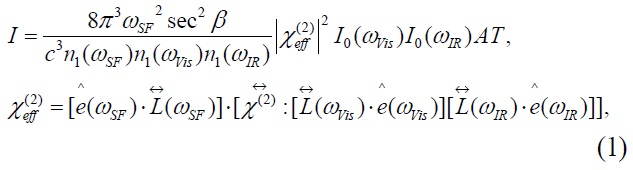
where
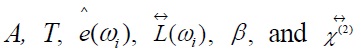
are the overlapping area of two input beams, input beam pulse width, unit vector in the polarization direction, tensor of the Fresnel factor, SF light angle in the reflection direction, and secondorder susceptibility tensor, respectively. In this equation,

is determined by the characteristics of the surface, and is expressed using the second-order hyperpolarizability of the molecule as follows.
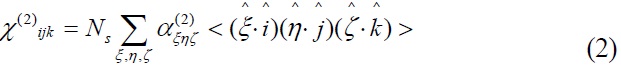
where
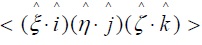
indicates a direction cosine average between the laboratory coordinates (
where
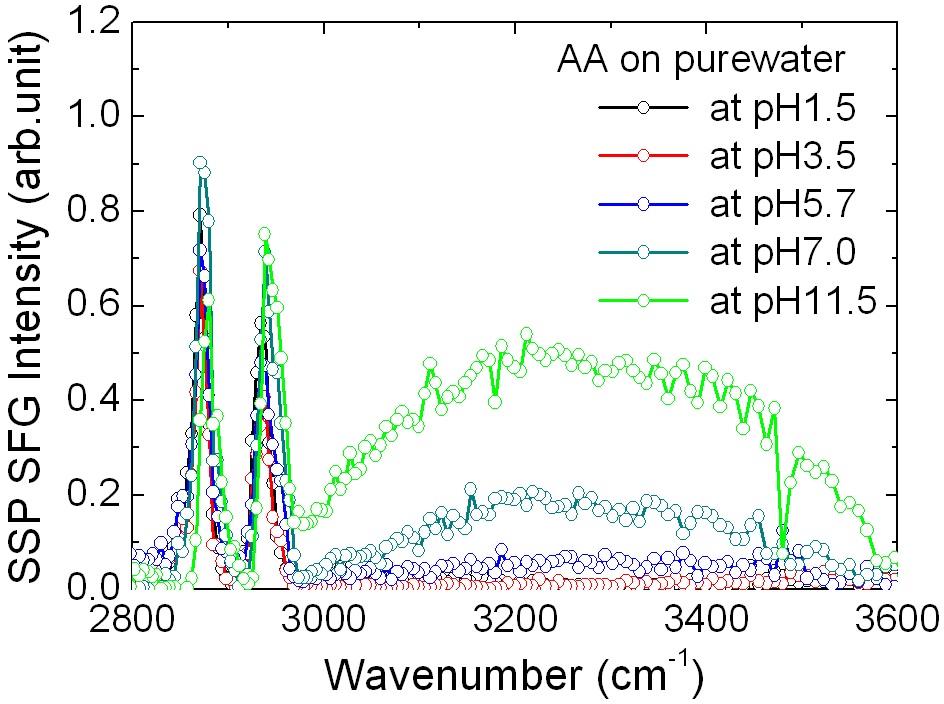
First, we measured SF spectra of the arachidic acid monolayer/ water interface in the absence of salts as reference data. As shown in Fig. 2, there are two sharp peaks at ~ 2875 cm-1 and ~2935 cm-1 corresponding to symmetric
stretch and Fermi resonance modes of CH3 terminal methyl groups of arachidic acid molecules, respectively [22]. In the spectra, the contribution from CH2 moieties in the alkyl chain, which is supposed to appear at 2850 cm-1 and 2920 cm-1, is not prominent, indicating the chains in the monolayer are in all-trans conformation. From 3000 cm-1 to 3600 cm-1, a broad SF band due to OH-stretch modes of interfacial water was observed. Due to its strong hydrogen bonding nature, OH-stretch mode of interfacial water is inhomogeneously broadened [23]. As pH of the solution increased above pH 5.7, SF intensity of this OH-stretch mode was considerably enhanced while spectral change in the CHx region is unnoticeable. This significant change in the OH-stretch region originated from the alignment of water molecules induced by the static electric field from the headgroups. In more basic solution, the carboxyl headgroup of the arachidic acid monolayer tends to be deprotonated, carrying up to one negative unit charge per headgroup. As an alignment of water dipoles is made in the direction of the surface normal, it leads to the increase of direction cosine average in the second-order susceptibility in Eq. (2). Apparently, the spectral shape in the CHx region was also changed slightly in high pH; for example, higher peak strength of CH3 fermi resonance than symmetric stretch mode. However this increase is due to an interference effect between the tail of the broad OH band and the CHx region. This apparent difference was also found in SF spectra of positively- and negatively-charged lipid monolayers on water, even when the resonance frequency, the peak strength, and the damping factor were similar for the two cases [21]. Therefore, the structure of the arachidic acid monolayer didn’t seem to be disturbed much, even by repulsion between charged headgroups at high pH.
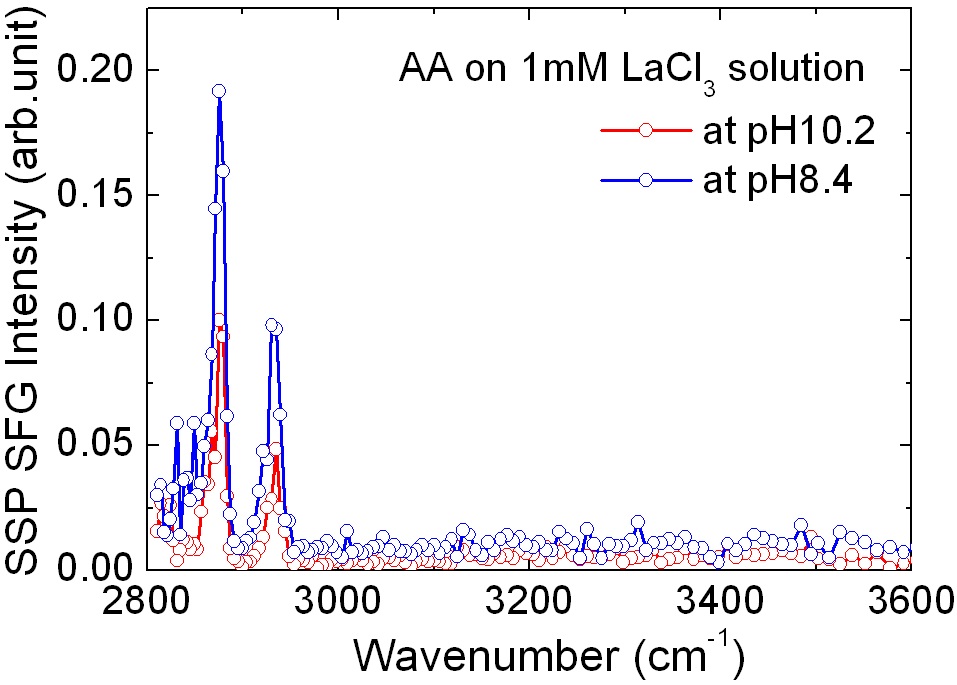
Figure 3 shows SF spectra of an arachidic acid monolayer in the presence of 1 mM LaCl3 in the subphase water. Compared with Fig. 2, SF intensity came from OH vibrational mode of interfacial water was considerably smaller, and similar to charge-neutral monolayer (in the lower pH
region in which the carboxylic headgroups of the AA molecules are not charged). It can be interpreted that on the negatively charged arachidic acid monolayer at high pH, there are adsorbed La3+ counterions screening the surface electric field from the monolayer. We propose that on average one La3+ counterion is adsorbed to three negatively charged carboxyl groups to make a charge-neutral surface. From this result, it was found that adsorption of La3+ is dominantly induced by the coulomb interaction.
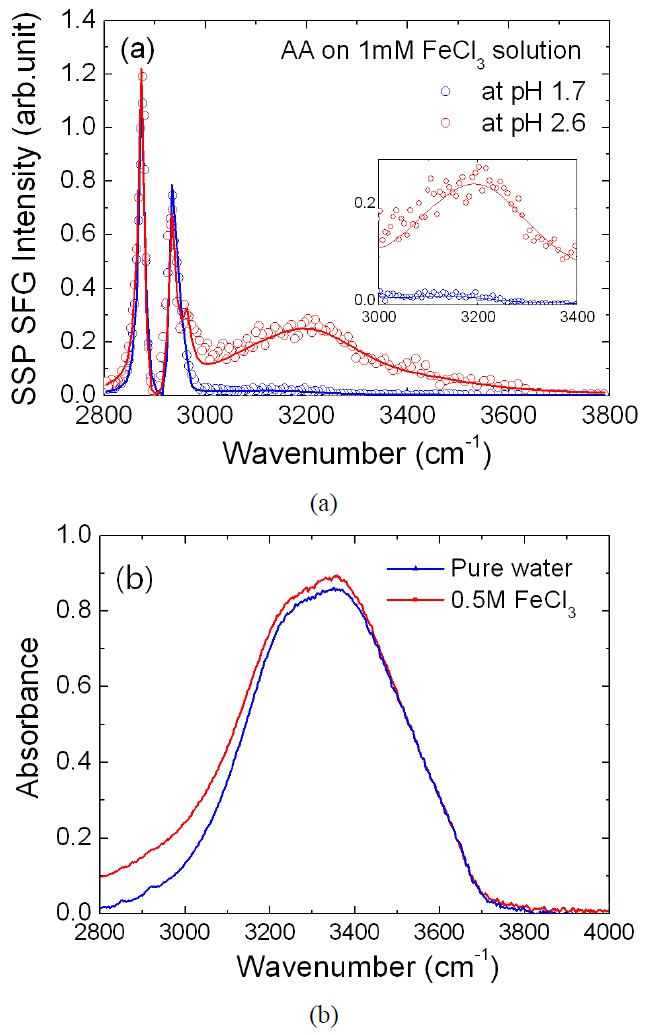
Next, we introduced 1 mM FeCl3 in pure water, and prepared an arachidic acid monolayer with the same mean surface area. In this experiment, two different ion compositions were considered. One is 1 mM of FeCl3 dissolved in pure water initially in neutral pH (~5.7). In this condition, most of the Fe3+ ions react with water molecules to form Fe(OH)3 to produce ~3 mM of H3O+. Measured pH of the solution was 2.6, confirming that more than 90% of Fe3+; ions turn into Fe(OH)3 and less than 10% of metal hydroxide Fe(OH)2+ [24]. The other sample is the same amount of FeCl3 dissolved in a highly acidic solution. By adding diluted HCl, the pH value of the water was first lowered to 1.7. After introducing 1 mM FeCl3, the pH of the solution was checked again, to find it remained the same as before. It indicates that a dominant form of ion in the solution is Fe3+ because high proton concentration inhibits the formation of ion hydroxide.
Figure 4(a) shows SF spectra from an arachidic acid monolayer in these two conditions. The most striking feature of the data is the enhancement of SF intensity from ~3000 cm-1 to ~3400 cm-1 in pH 2.6. This means that Fe(OH)3 molecules affected the interfacial water structure or OH stretch mode of Fe(OH)3 itself as seen in the spectra. Previous IR absorption measurement of metal hydroxide in solid argon showed that the OH stretch mode of Fe(OH)3 is ~ 3670 cm-1, similar to the value of free (non-hydrogen bonded) OH of a water molecule [25]. Since Fe(OH)3 will make a hydrogen bonding network with surrounding water molecules, OH vibrational frequency is expected to be redshifted appreciably. To assign the band in Fig. 4(a), we additionally measured IR absorption spectra of bulk FeCl3 solution. As shown in Fig. 4(b), absorbance of the 0.5 M FeCl3 solution increased from 2800 cm-1 to 3400 cm-1. So, it can be understood that the OH vibrational mode of Fe(OH)3 contributed to the enhancement of SF intensity in the low frequency (< 3400 cm-1) range. We also tried to observe the IR absorbance change of a 1mM FeCl3 solution, but there was no clear difference, which demonstrates the sensitivity of the sumfrequency spectroscopic technique. Therefore, we concluded that SF intensity enhancement in pH 2.6 came from the OH stretch mode of Fe(OH)3 and surrounding interfacial water having reconstructed structure. On the other hand, SF spectrum in pH 1.7 shows only a small bump around 3080 cm-1, which is assigned as an OH vibrational mode of the protonated carboxyl headgroup as assigned by Miranda et al [15]. This SF spectrum is identical to that of
an arachidic acid monolayer in pH 1.5 pure water, not showing any clear sign of Fe3+ absorption.
As shown in reference spectra in Fig. 2, an arachidic acid monolayer is charge neutral in pH lower than 3.5. So, it is expected that coulomb interaction cannot promote ion adsorption to the monolayer. Moreover, in the case of FeCl3 solution in pH 2.6, both iron hydroxides and carboxyl head groups have no charges. We supposed that Fe(OH)3 adsorption was related to chemical interaction such as hydrogen or covalent bonding. We would like to suggest that there are strong covalent or hydrogen bonding connection between Fe(OH)3 and the oxygen atom of the carboxyl headgroup, and the remaining OH moieties of Fe(OH)3 forming a hydrogen bonding network with other Fe(OH)3 ions or water molecules.
For simple trivalent La3+, the adsorption to the interface is due to electrostatic interaction, obviously from negligibly small SF signal in the OH range. SF intensity of the CHx range was also smaller than that of monolayers on pure water. Even for Fig. 3, monolayer in pH 10.2 shows smaller SF intensity than that in pH 8.4. So, La3+ ions on the surface seemed to change not only net surface charge density, but structure. Previous X-ray and imaging ellipsometry studies about an arachidic acid on CaCl2 solution showed that the portion of spontaneously collapsed bilayer was increased in the presence of multivalent cation in water [26,27]. So, the smaller SF intensity in the CHx region is considered to come from the bilayer from spontaneous collapse induced by La3+ ions.
To summarize, the adsorption behavior of La3+ and Fe (OH)3 on an arachidic acid monolayer was studied by surface sensitive sum-frequency generation spectroscopy. Adsorption of the La3+ ion is driven by the coulomb interaction. This is the same as the adsorption behavior of other simple mono- and divalent cations as already investigated [28]. 1mM of LaCl3 seems to be sufficient to make a charge neutral condition of the monolayer over all the pH range. On the other hand, adsorption of Fe(OH)3 is induced by chemical bonding between iron hydroxide and the carboxyl headgroup.