The amplitude error of phase modulator used in closed-loop fiber optic gyroscope has occurred by the temperature dependency of the electro-optic coefficient, and also can be due to the square-wave dither signal which is generally applied for eliminating the deadzone. This error can cause bias drift and scale factor error. This paper analyzes the temperature dependency of the modulation amplitude and the relationship with the scale factor of the gyroscope, and deals with an amplitude control method. The error calculation logic considering the dither signal is implemented on the signal processing module. The result of experiments from a prototype gyroscope shows the effect of the modulation amplitude control and a considerable improvement on performances.
The introduction of the Fiber Optic Gyroscope(FOG) occurred in the late 1970s after the invention of optical fibers. With help received from the researchers in the field of interferometry and telecommunications, The FOG has proven to be a leading technology in various applications for imaging systems, antennas, precise aiming of telescopes, and navigation systems [1-5].
The FOG is a mature technology and was originally designed as a low-cost alternative to the Ring Laser Gyroscope [2-3]. Due to the solid-state optical configuration and fiber technology, the FOG’s performance could lead to 0.001 deg/hr stability in miniature design [4-5]. The main optical components of FOG are composed of fiber, integrated optic chip(IOC), coupler, light source, and detector.
One of the key elements in determining the bias and scale factor of FOG is the modulator’s characteristics in the IOC [6,11-12]. The main function of the IOC is to split the light and to modulate the phases which are combined in a π/2-biased phase for maximum sensitivity, Sagnac phase shift by input rate, and feedback phase for compensating the rate. The important parameters of the IOC for improving the performance of gyroscope are polarization crosstalk, polarization extinction ratio, and modulation amplitude efficiency. Among them, the required level of polarization crosstalk and extinction ratio can be achieved by the manufacturing process.
However, as the modulation amplitude efficiency is intrinsically induced by temperature variation, controlling of the modulation amplitude should be needed because the bias and scale factor are strongly dependent on the feedback element which is directly proportional to the modulation amplitude coefficient of the IOC [7-13]. In addition, the modulation amplitude error can also occur due to the square-wave dither signal which is composed of plus and minus virtual rate. This error can cause bias drift and scale factor error in a closed-loop FOG.
This paper analyzes the temperature dependency of phase modulation amplitude from the effective electro-optic coefficient. In order to investigate how the modulation amplitude error affects the gyroscope, the relationship between temperature dependency of the phase modulation amplitude and the scale factor of the gyroscope is investigated. The error calculation method is improved for the gyroscope with the square-wave dither signal, and implemented on the signal processing module. Some of experimental results with and without the amplitude control loop are also discussed.
II. A BASIC OPERATION OF FIBER OPTIC GYROSCOPES AND PHASE MODULATION AMPLITUDE ERROR
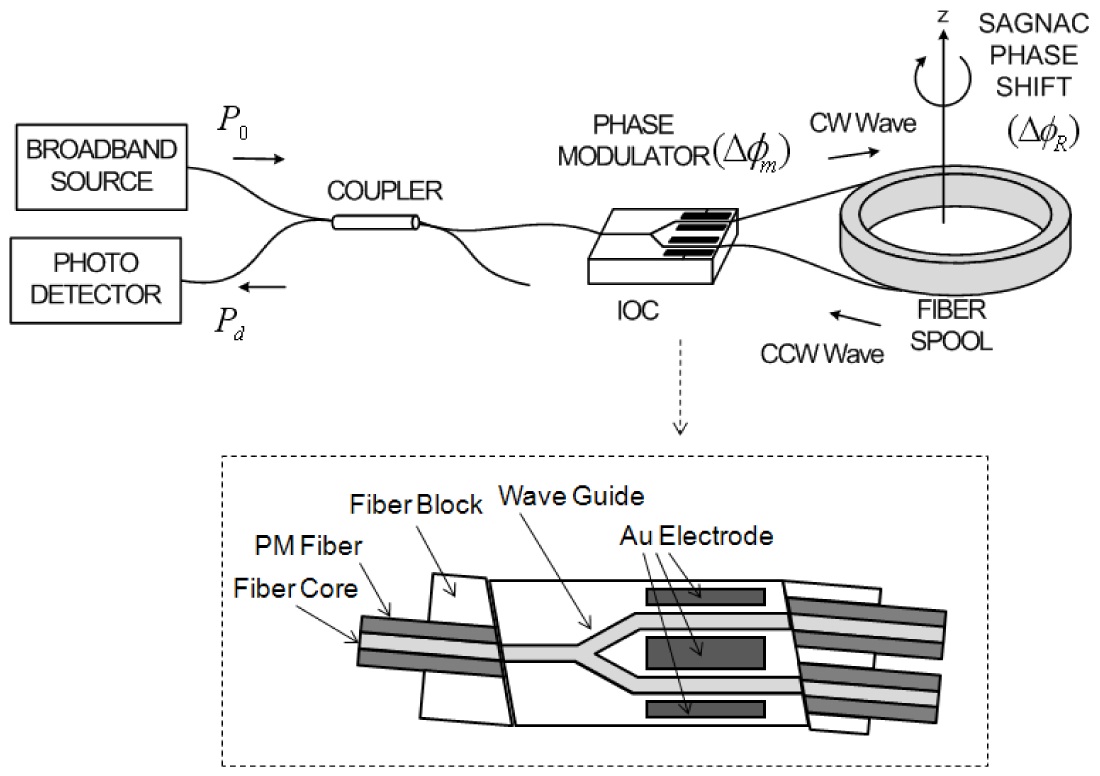
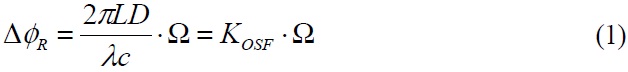
The FOG is based on the Sagnac effect, which produces a phase difference proportional to the rotation rate [1]. Light from the broadband source is directed through the first coupler and a single-mode filter to a second coupler included on the IOC. The second coupler divides the light into two parts: one that will propagate clockwise through the sensing coil, and the other that will propagate counter-clockwise. They have opposite phase shift sensitivities to rotation about the coil axis. The Sagnac phase difference between clockwise and counter-clockwise becomes :
where
Figure 1 shows the general configuration of optics and IOC in FOG.
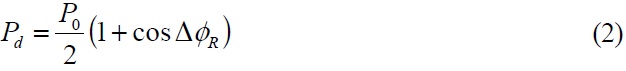
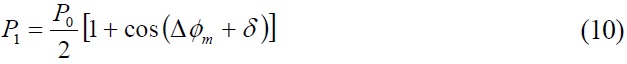
The phase difference induced by input rate is expressed as a cosine relationship for optical power. Once the broadband source generates the power, the photodector output through Sagnac loop in fiber spool
where
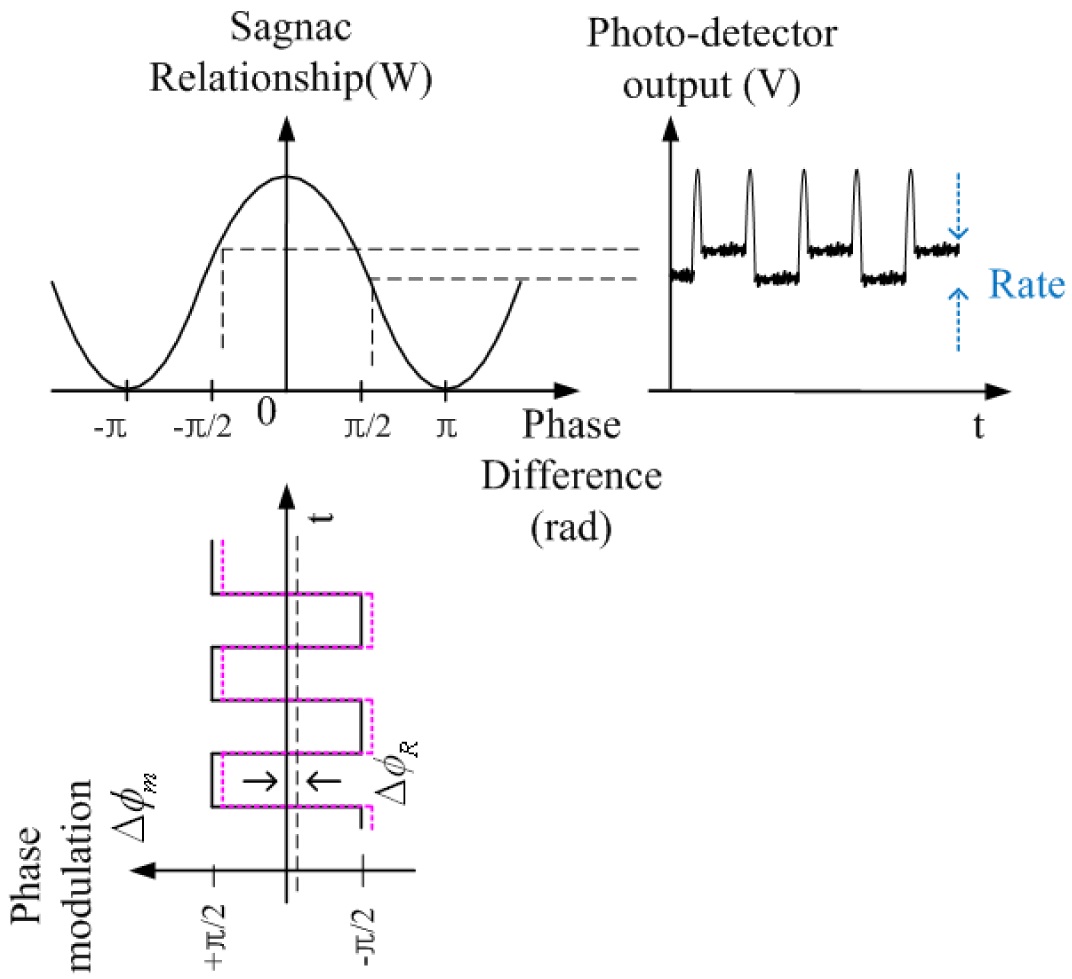
To maximize the sensitivity of the gyroscope, the square-wave modulation-demodulation method is commonly used [12-14]. When the square-wave signal with Δ


where Δ
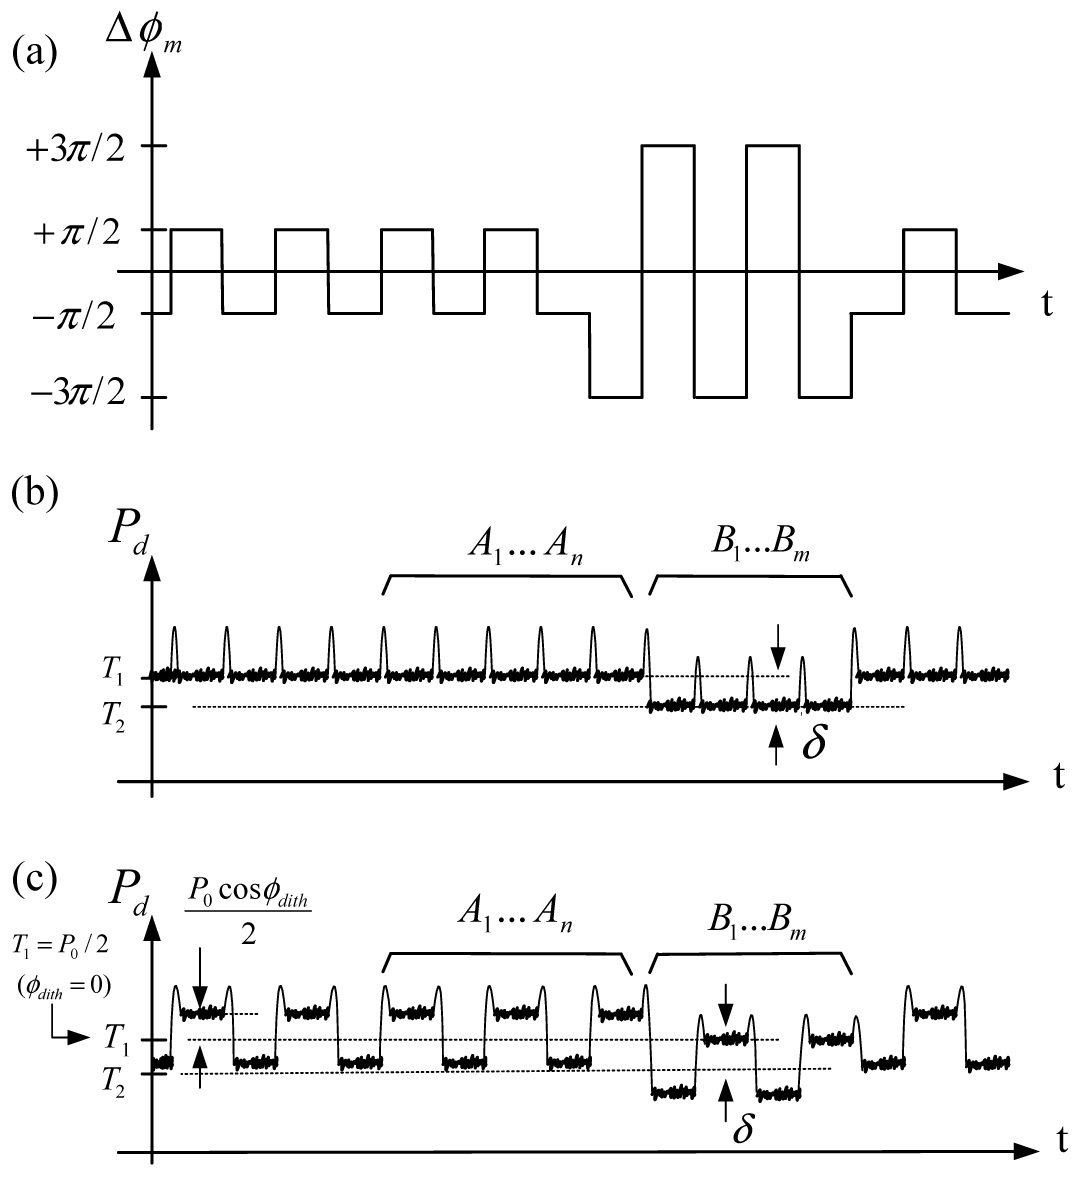
When the square-wave modulation is applied and the input rate occurs, the photodetector output signal is shown in Fig. 2.
If
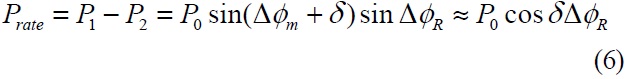
where Δ
From the equation (6), photodetector output has parasitic error due to a nonlinear term cos
In order to reduce the error, the temperature characteristics
of the phase modulator should be analyzed first. The structure of the phase modulator is shown in Fig. 1. The modulator has two electrodes which can double the modulation efficiency. When one electrode of LiNbO3 is modulated, the phase modulation amplitude becomes [7] :
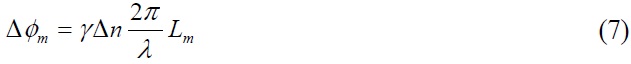
where
Assume that the optical wavelength is constantly stabilized by a thermo-electric cooler. The temperature dependency of phase modulation amplitude
Here, we should look into the optical index change in detail. When the voltage
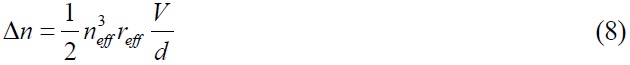
where
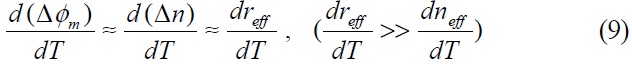
From equation (8), the temperature dependency of optical index is composed of
and the temperature dependency of
Because the temperature dependency of
III. A MODULATION AMPLITUDE CONTROL METHOD
In this section, the error calculation method from the photodetector output will be derived and an improved method will be suggested. A control loop modeling and the relationship between temperature dependence of phase modulation amplitude and scale factor of a gyroscope will be discussed next.
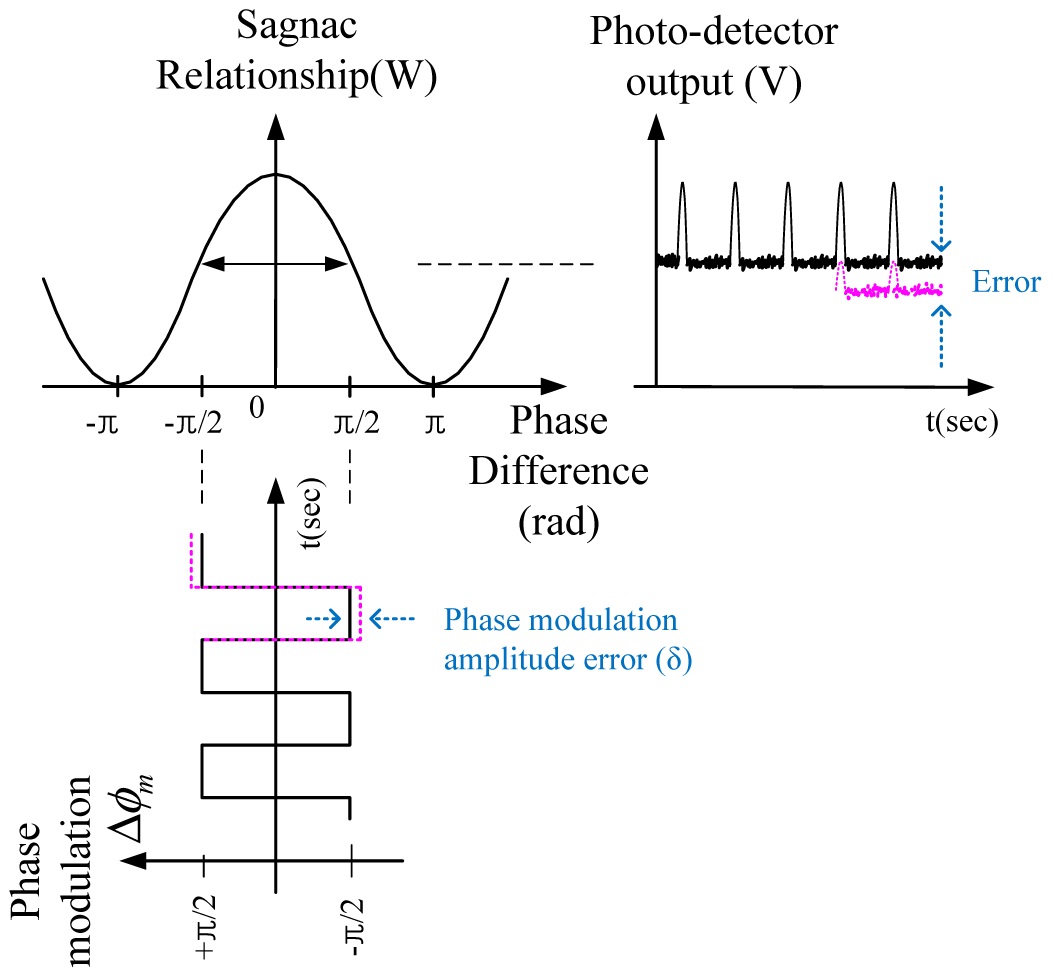
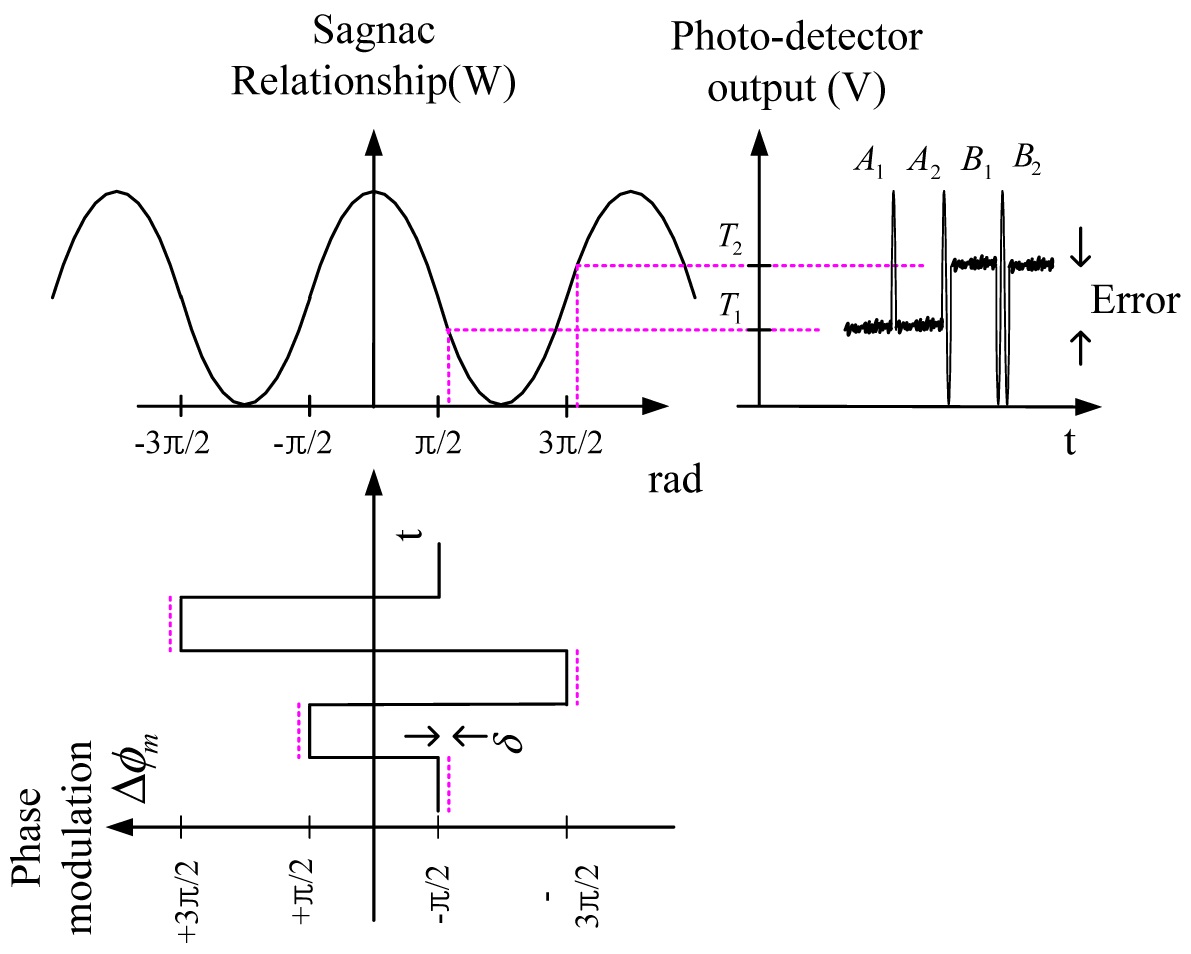
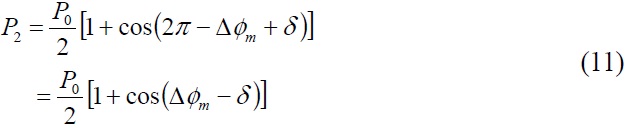
It is impossible to find the phase modulation error from the ±π/2 biasing modulation alone because we don’t know the reference power level of the photodetector output, as shown in Fig. 3. In order to find the phase modulation error, it is necessary to generate additional modulation, ±3 π/2. Fig. 4 shows the photodetector output with both ±π/2 and ±3π/2 modulation.
The modulation steps(pulses) come from the D/A converter through the digital steps determined by the digital register. The closed loop signal processing uses both ±π/2 biasing modulation and ramp modulation. The ramp modulation integrated by input rate digitally is used as feedback phase, which compensate the Sagnac phase proportional to the input rate. Typically, the maximum total steps, combined bias and ramp modulation, are limited to 2π because the maximum output voltage of the D/A converter is set to 2π.
When total steps reach the 2π-limit, the step register is reset, and ±π/2 biasing modulation is changed into ±3π/2 automatically. Considering the modulation amplitude error
The modulation amplitude error can be expressed by subtracting

In practice, the modulation amplitude error is calculated by the difference between average of ±π/2 steps and average of ±3π/2 steps in order to minimize the noise. The steps can increase or decrease with the input rate value. For a low rate, the steps increase due to a long modulation period that takes long for a small ramp bit to accumulate until 2π. Likewise, the steps decrease in a high rate and vary quickly from ±π/2 steps to ±3π/2 steps. Applying averaging method, the modulation amplitude error can be expressed as :
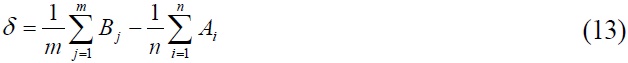
n : number of photodetector outputs for ±π/2 modulation step
m : number of photodetector outputs during ±3π/2 step
Ai : photodetector output(P1i) for ±π/2 modulation step
Bj : photodetector output(P2j) for ±3π/2 modulation step
This equation is commonly used because it can be simply calculated [13-14]. But in a case of adding a dither signal, equation (13) doesn’t match for exact calculation. Fig. 5 shows the photodetector output with dither signal.
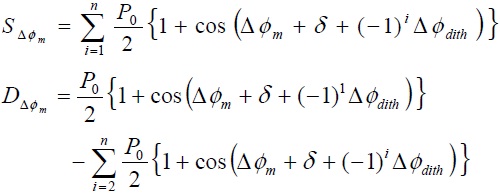
Dithering is a widely used method in gyroscopes to overcome the deadzone where it can’t detect any rate [12-14]. The square-wave dither signal used in FOG changes the photodetector output power because it generates the additional phase shift in feedback modulation. In order to calculate the error considering dither amplitude Δ
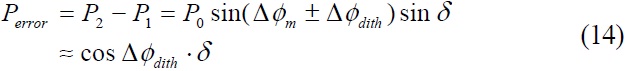
This equation has a nonlinear term cosΔ
The average of photodetector output for even steps
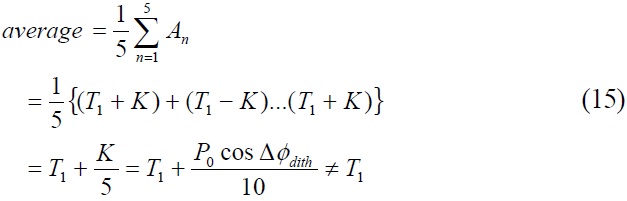
where
In order to remove the above additional error term
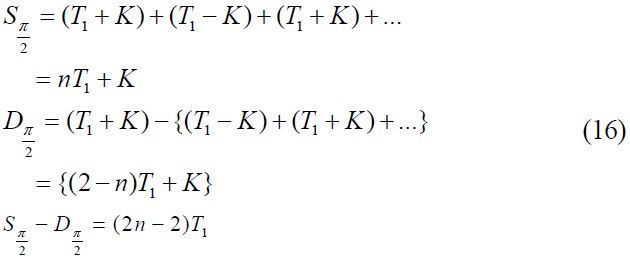
where
The variables
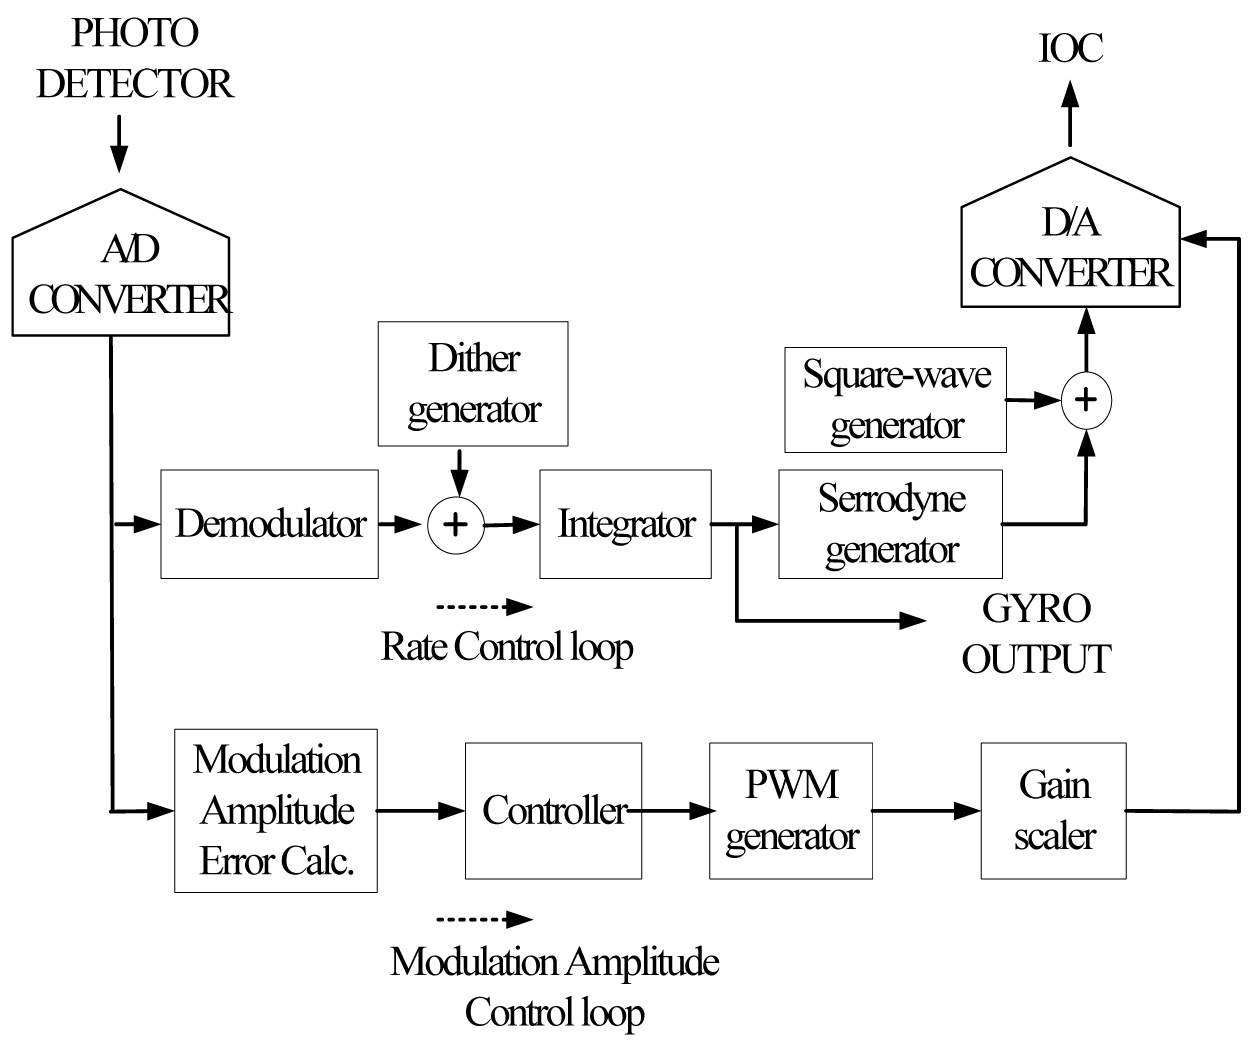
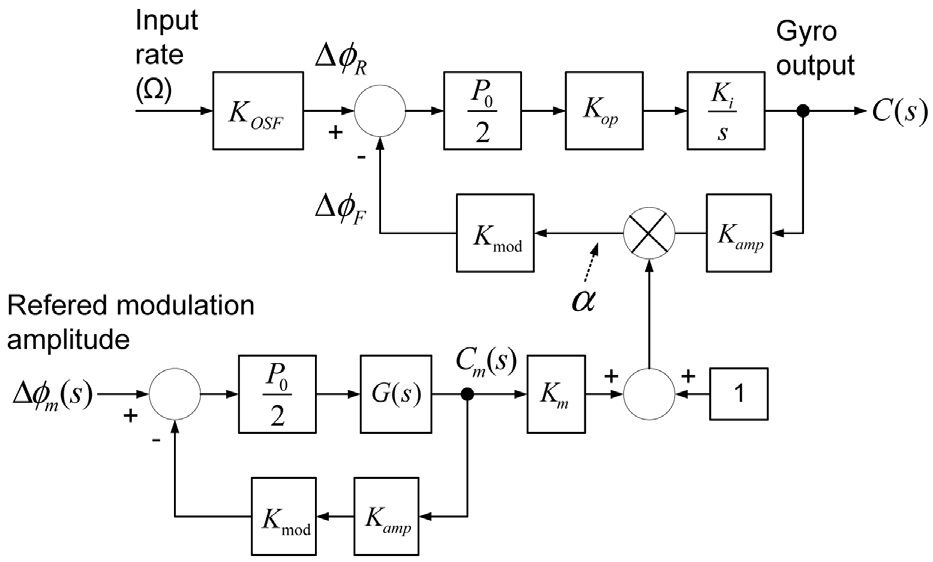
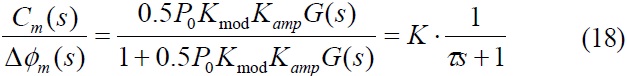
The modulation amplitude error calculated from Table 1 can be compensated by the signal control loop shown in Fig. 6. The modulation amplitude controlled by PWM generator which transforms the digital value to pulse can adjust the range of D/A converter. A control loop model expressed in Laplace transform is shown in Fig. 7.
where
When the gyroscope operates closed-loop mode in rate, the scale factor is not related to the open loop gain any more if the open loop gain is sufficiently large. The relationship between the control loop transfer function and scale factor can be expressed as :
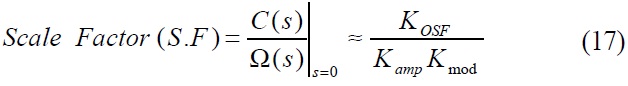
The scale factor of the gyroscope depends on three factors,
[TABLE 1.] The average of steps during ±π/2
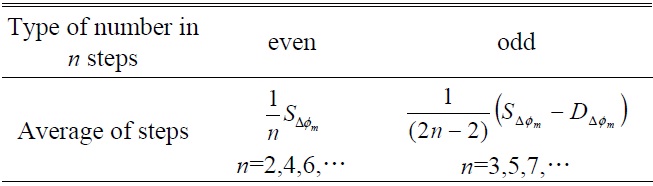
The average of steps during ±π/2
circuits. So, the temperature dependency of modulation amplitude coefficient
Assume
where
When the loop is closed, the output

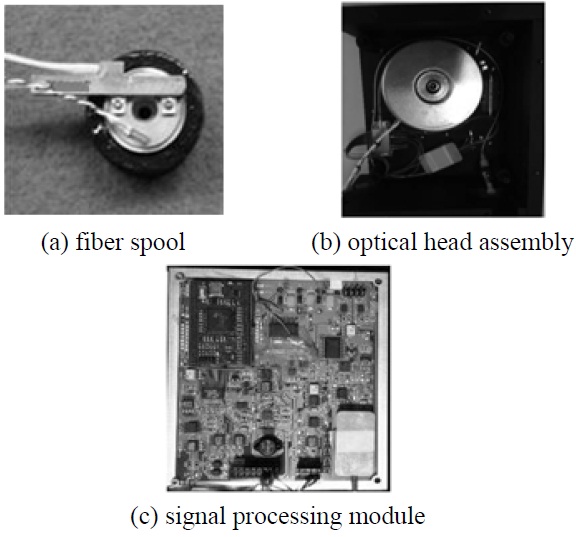
The optical head and signal processing modules to verify the effect of amplitude control were implemented on prototype FOG. The optical head was made with Polarization Maintaining (PM) fiber, 1550 nm broadband source, IOC, 2×2 coupler, and photodetector. A 900 m PM fiber with a low birefringence and a small cladding diameter was chosen for good bias performance, wound in fiber spool with quadrupolar winding for reducing the temperature and vibration errors. A broadband source was made with 980 nm-pump laser diode, WDM, and coupler. This configuration promises good stability in power and wavelength. A push-pull modulator with long electrodes on the IOC was designed for high modulation efficiency. A photodetector with low dark noise and low capacitance was chosen for a low noise, high efficiency amplifier design. Special care should be taken in designing the photoamplifier as a small current below a few nano-ampere(nA) corresponding to small input rate can flow on circuits. The signal processing module includes constant current driving circuits for supplying constant power to the laser diode, digital modulation-demodulation logic, control logics for rate and modulation amplitude control, and DSP unit for compensation and digital communication. The optical head and signal processing module are shown in Fig. 8.
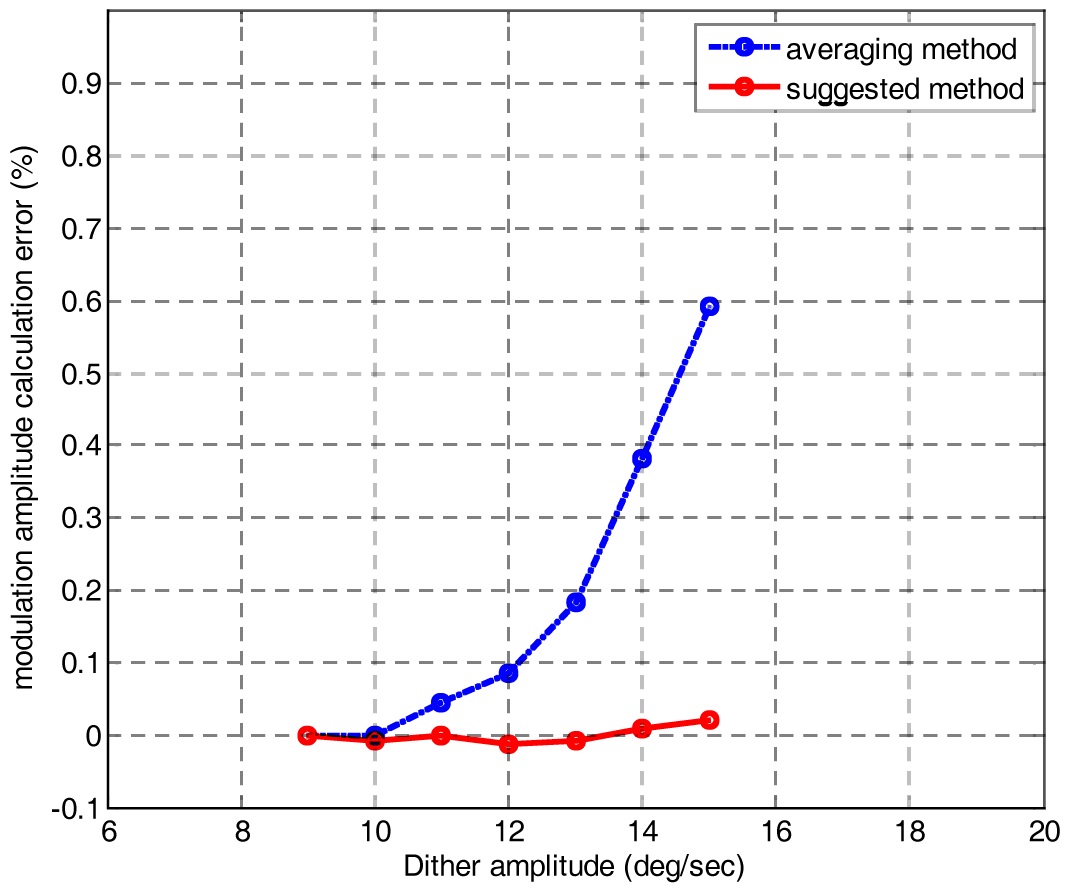
A Figure 9 shows a simulation result which compares a simple averaging method with the suggested method. In an amplitude open-loop mode, the amplitude error was increased up to 0.6% as dither amplitude was changed from 9 deg/sec to 15 deg/sec, while the suggested method was unchanged. This error can lead to a bias drift or scale factor error, even though the error goes to zero in an amplitude closed-loop mode.
On the basis of this simulation result, the suggested method was adopted on signal processing module. Experimental results from Fig. 10 to Fig. 13 show the effect of amplitude
control.
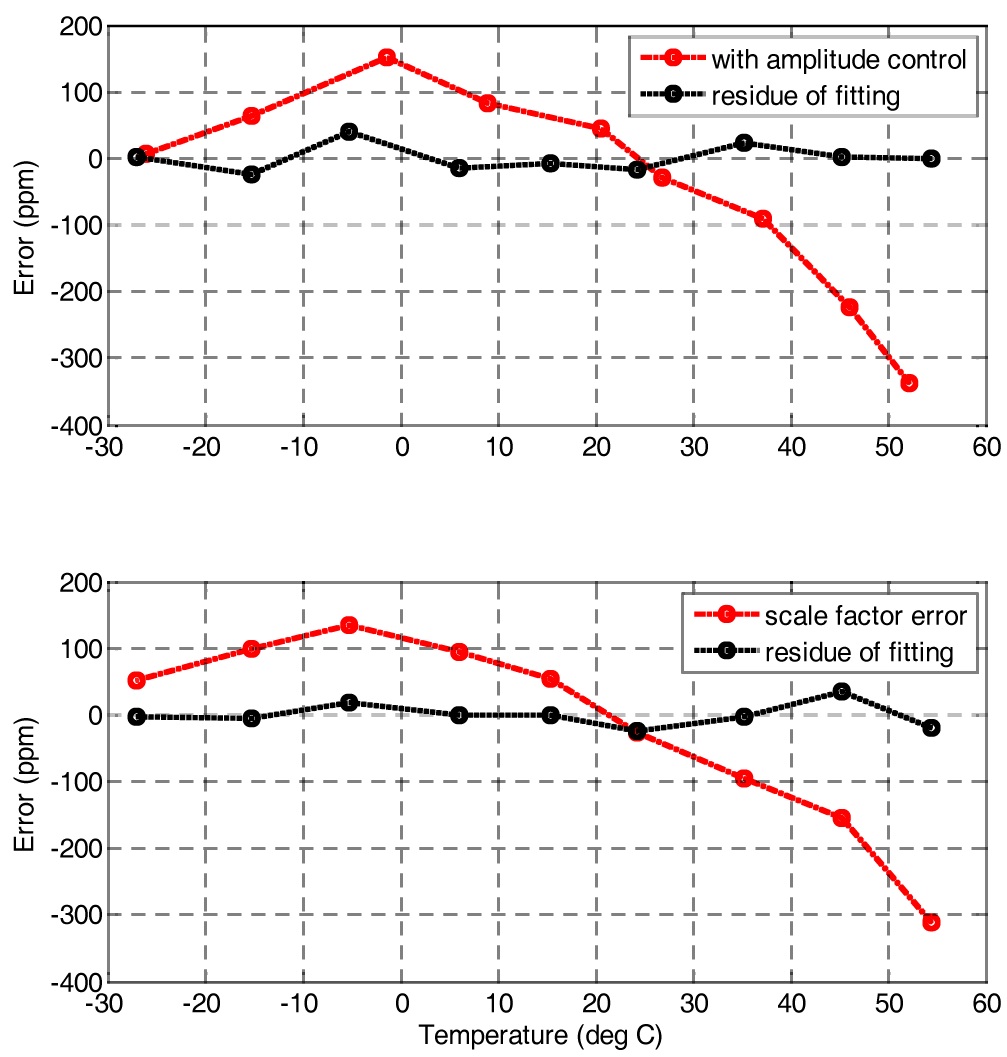
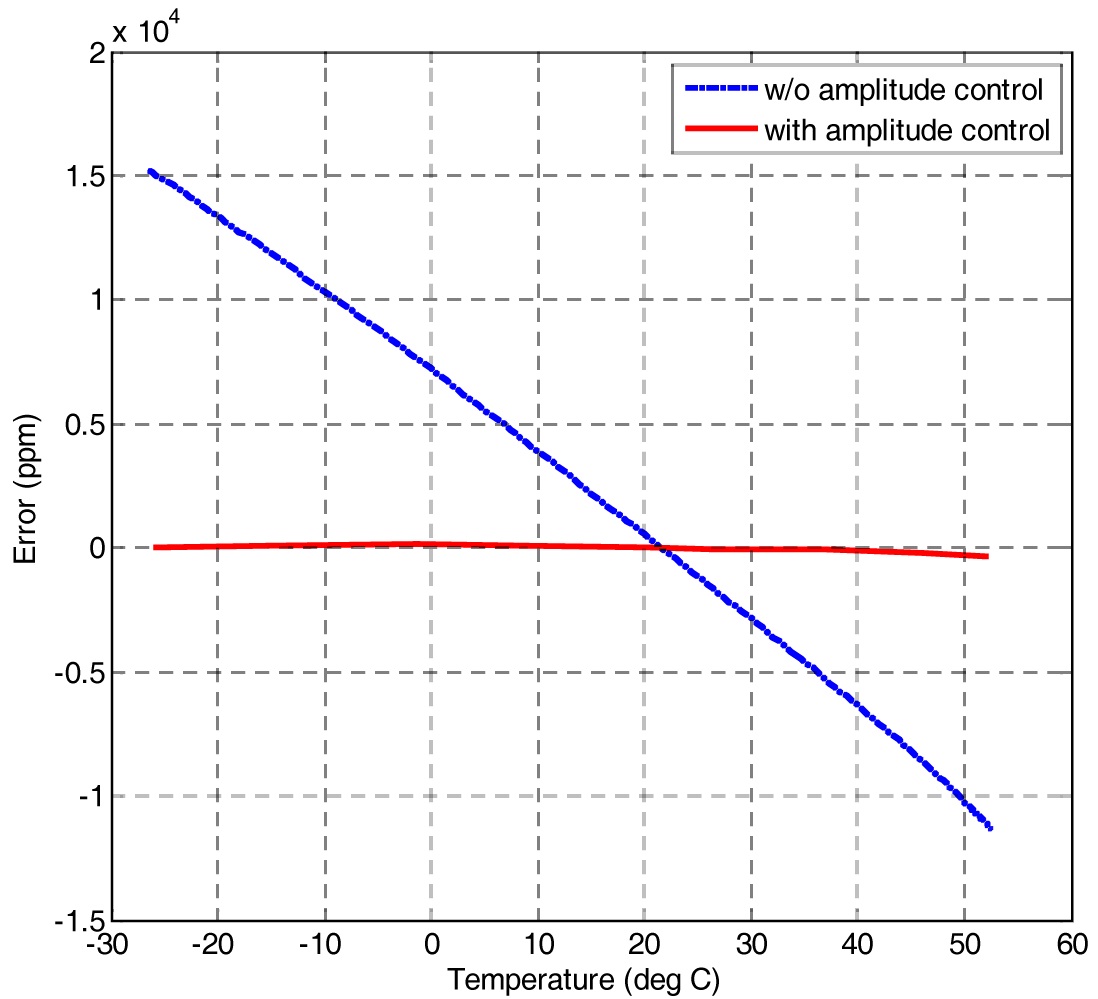
The error without amplitude control shown in Fig. 10 is approximately 26,000 ppm(peak-to-peak) over full temperature range, which corresponds to 325 ppm/℃, a reasonable value for the typical temperature dependency of
Figure 11 shows the relationship between amplitude control and scale factor. The scale factor is not only related to modulation amplitude
or electronics. The lower graph has a similar curve to upper’s and the peak-to-peak values of both errors are almost same, 489 ppm and 444 ppm, respectively, and likewise, the residual errors by third order fitting are 64 ppm and 60 ppm, respectively. This result shows the scale factor is closely related to modulation amplitude. The scale factor residual error also corresponds to a sufficiently low value, acceptable for a navigation system.
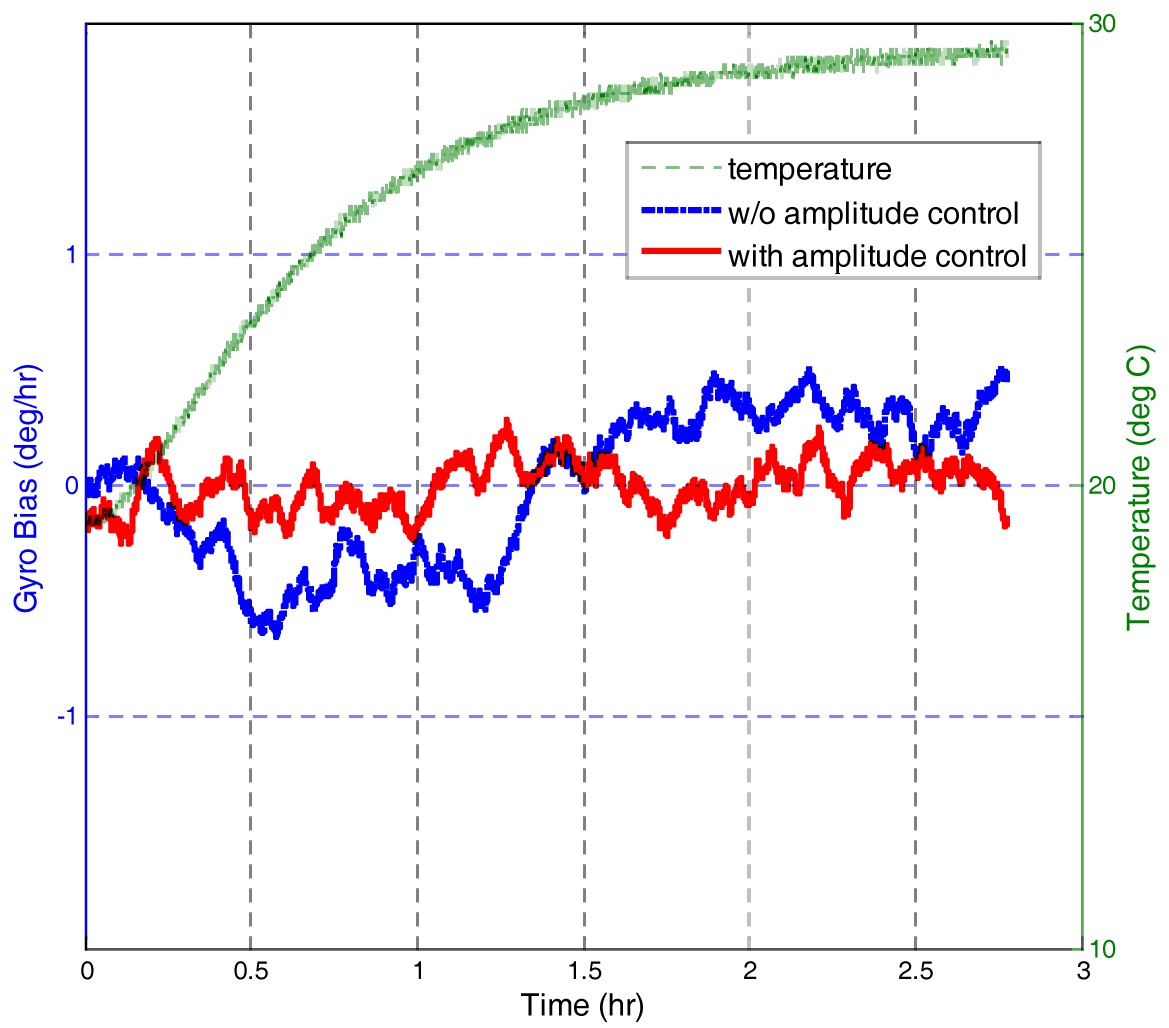
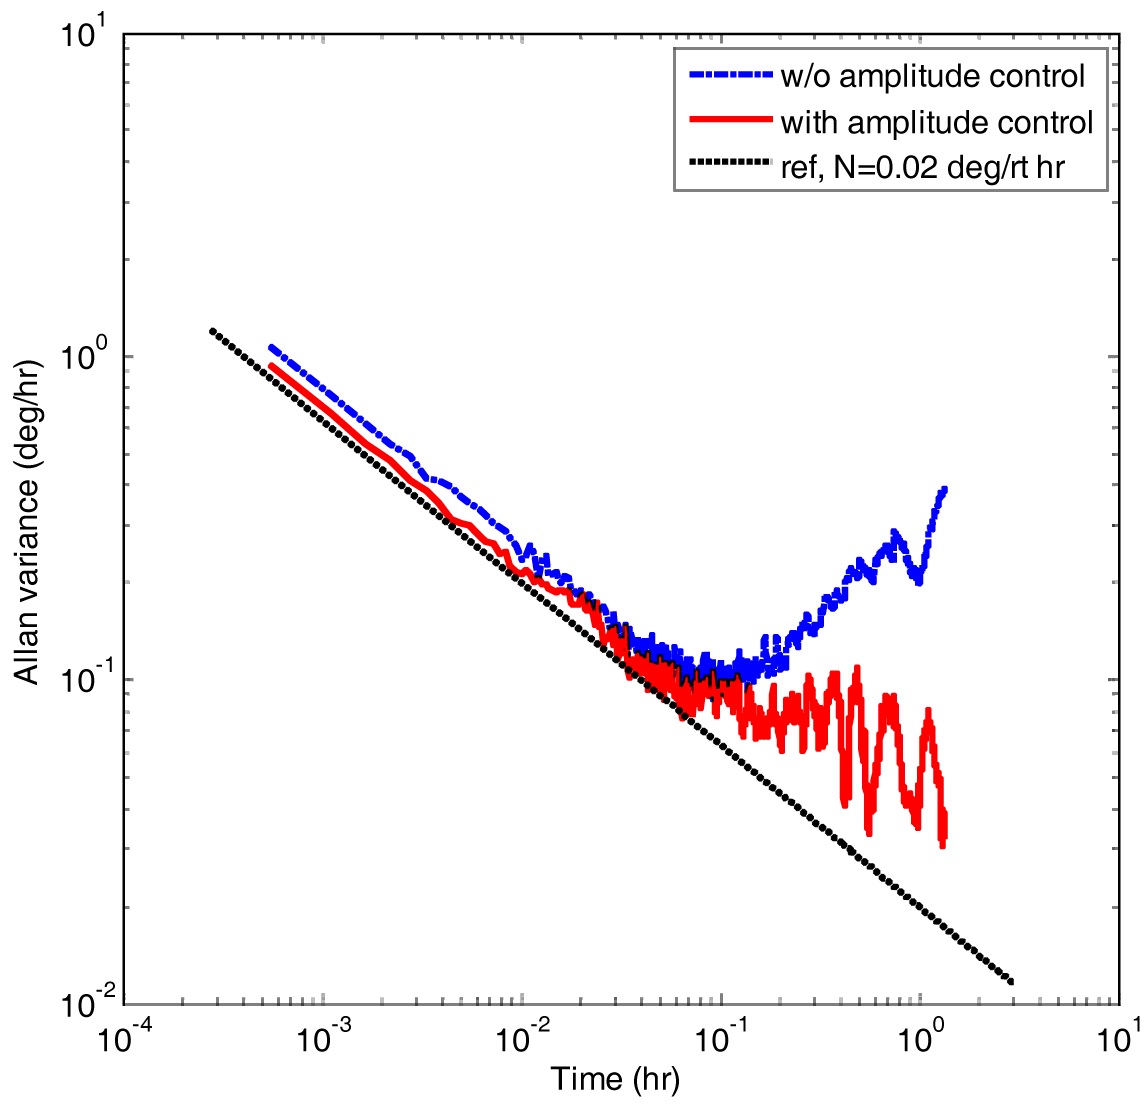
The bias stability, one of the important parameters in determining gyroscope performance, was tested at room temperature. Even in room environment, the temperature is varied approximately 10℃ because the electronics mounted on the inner side of the gyro assembly heats up optical components. In Fig. 12, the bias instability without amplitude control is 0.32 deg/hr (1 sigma), changed along the temperature variation, while it is reduced to 0.1 deg/hr in an amplitude control. The Allan variance in Fig. 13 shows the difference of long-term bias instability more clearly. The Allan variance in an amplitude control is about 0.03 deg/hr, improved three times than without control (The bottom line of datum indicates the Allan variance value)
In this paper, we have discussed the control method of phase modulation amplitude in dithered closed-loop FOG. The origins induced by the modulation amplitude error have been investigated in terms of the effective electro-optic coefficient, pointing out the predominant factor of the scale factor error in gyroscope. The solution to suppressing the modulation amplitude error was proposed, enabling to the exact calculation in a square-wave dithering. We have shown that the control loop effectively eliminated the modulation amplitude error and was successfully implemented on prototype FOG, resulting in improved performances.