Remote sensing of air pollution emissions has several advantages for toxic element measurements over other methods in terms of safety. A powerful and reliable tool for rangeresolved remote sensing of gas concentrations that has proven its capabilities in a variety of studies is the differential absorption LIDAR (DIAL), as first suggested by Schotland [1]. In contrast to other remote sensing techniques such as Raman or fluorescence methods, DIAL can measure air pollutant concentrations with a high spatial resolution by adopting two laser systems with different degrees of absorption for the two different wavelengths. The absorption of the reference wavelength is very weak, while the absorption of the other wavelength is very strong. In the ultraviolet?visible range, a large number of trace species such as ozone [2], sulfur dioxide [2,3], nitric dioxide [4], iodine [5], and mercury [6] have been measured successfully using the DIAL technique. Radioactive iodine emitted by nuclear plants, however, is not frequently measured using DIAL because of the difficulty in preparing samples and its dangerous characteristics. Nuclear power plants emit small amounts of radioactive iodine even under normal operating conditions, but plants for reprocessing nuclear fuel emit an even larger amount of radioactive iodine [7].
Iodine is an essential, toxic trace element for humans and other biological species. To prevent goiters, a typical symptom of iodine deficiency, iodine intake should not exceed 100 μg a day [8].
Following the nuclear reactor accidents, for example, in Chernobyl in 1986 and in Fukushima in 2011, a high portion of the radioactive fall-out consisted of 131I, which has a half-life of about 8 days [9]. To assess the dangerous characteristics of radioactive iodine, detailed knowledge of the behavior of iodine in the environment is required; the behavior is influenced by the concentration of water in the air and by atmospheric conditions. The background iodine concentration is at a level of a few nanograms per cubic meter, and a large amount of this atmospheric iodine exists as gaseous compounds like elementary iodine, hypoiodous acid, hydrogen iodide, and methyl iodide [10]. However, a distinct amount of atmospheric iodine also exists in a particulate iodine state [11], and the distribution of iodine species in aerosol particles is relatively unknown. In this study, we suggest a new DIAL system for detecting gaseous iodine in the atmosphere. To demonstrate the performance of the suggested DIAL system, we show that the concentration can be measured when the conditions in an iodine vapor cell are changed.
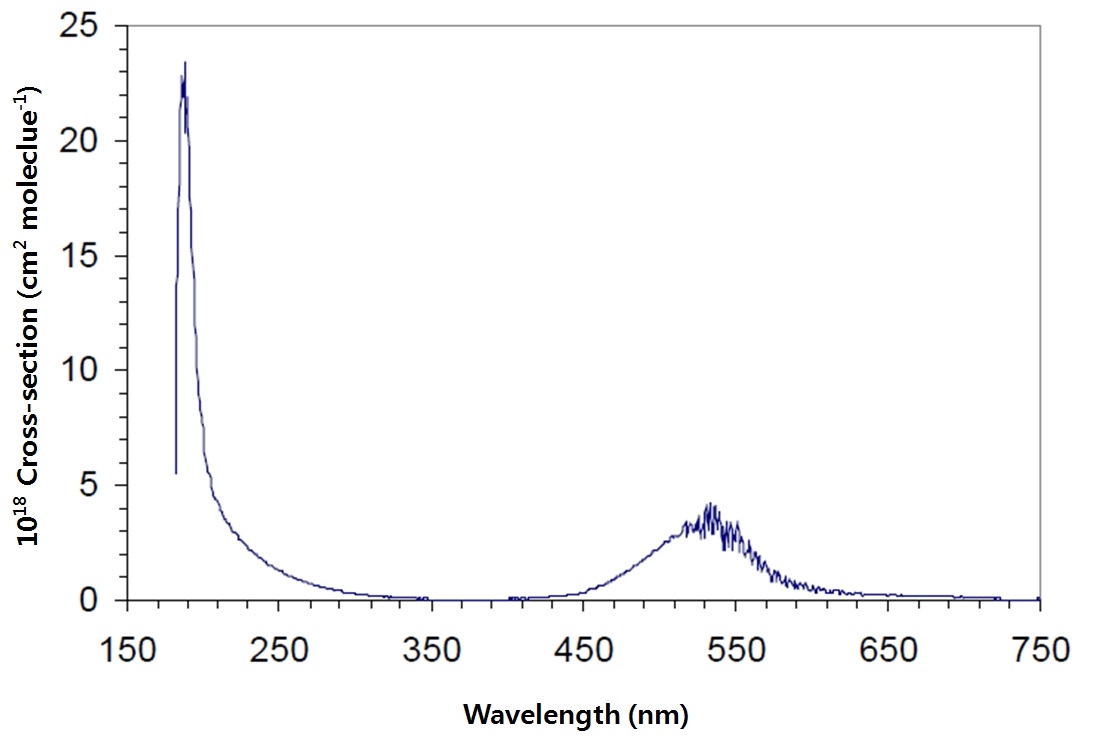
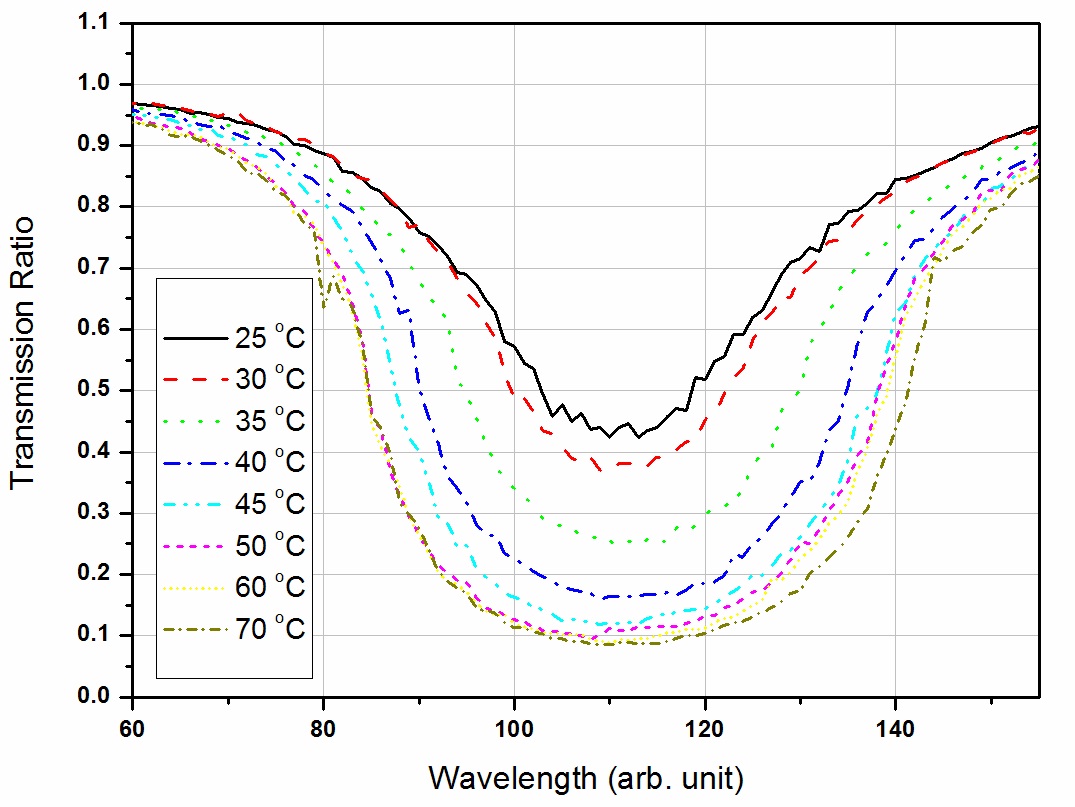
Many scientists have considered the optimum wavelengths for measuring iodine molecules using the DIAL technique and found that wavelength combinations between 450-650 nm are the most suitable [12]. Since these absorption wavelengths do not show sharp absorption features (Fig. 1) when used in normal laser systems, it difficult to estimate the iodine absorption cross section and the difference between the two (on-line and off-line) wavelengths, which should be large enough to obtain an adequate differential cross section [12]. However, a large difference will require a correction for the differential scattering caused by air molecules and aerosols and can therefore introduce noticeable systematic errors into the measurements under polluted atmospheric conditions in which the aerosol gradients are large.
Privalov and Shemanin [13] discussed the possibility of using DIAL to probe molecular iodine in the atmosphere by numerically solving and correcting the LIDAR equation. A copper-vapor laser was considered as the radiation source with wavelength combinations of 501 and 578 nm or 578 and 647 nm. These combinations make it possible to obtain the maximum backscattering signal in the 10-5 000 m range. The system characteristics of an iodine DIAL system were
also studied using a 532 nm (on-line) and 1064 nm (off-line) wavelength combination. Measured results of the iodine cell concentration, taken in the laboratory with the cell located on axis for distances of up to 8 m, were shown to correspond to the simulation results [13]. However, this method is difficult to apply under actual polluted atmospheric conditions because of differential scattering.
Maruyama
2.2. Importance of Differential Scattering
For the molecular iodine calculation, we used the following elastic LIDAR equation for the detected signal
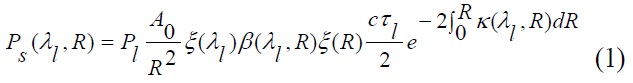
where

where
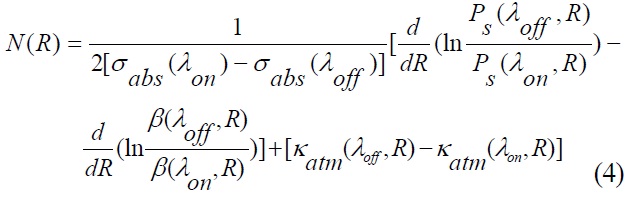
Thus, the concentration,
[TABLE 1.] The iodine DIAL system specifications
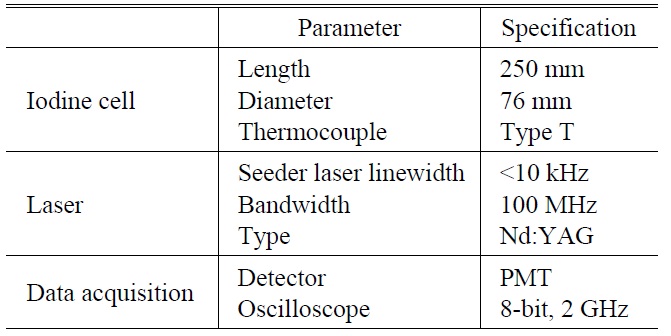
The iodine DIAL system specifications
III. DESCRIPTION OF THE DIAL SYSTEM
A necessary condition of the laser in the DIAL system is a narrow bandwidth. The bandwidth or linewidth of current commercially available unseeded Nd:YAG (532 nm) pulse lasers is about 30 GHz. As it is not possible for this Nd:YAG laser pulse to pass separately the iodine absorption lines, which are close to 532 nm, an injection-seeded laser is used. We used the single longitudinal mode of a continuous wave seeder laser with a bandwidth of less than 10 kHz as the injection source to obtain a pulsed laser with a bandwidth of 100 MHz at 532 nm.
The laser system should also be tunable. The advantage of the seeder laser is that the tunable frequency range is 10 GHz around 532 nm. The laser radiation power (3 mW) is also several orders of magnitude higher than that of spontaneous radiation in the resonance cavity. When the seeder laser frequency is within the range of the absorption lines, a Q-switched pulsed beam also develops at the frequency of the iodine absorption lines.
The laser specifications that satisfy these two conditions are listed in Table 1.
3.2. Wavelength Selection (Frequency Locking)
For the frequency-locking process, the absorption profile of the molecular iodine filter must be both stable and known.
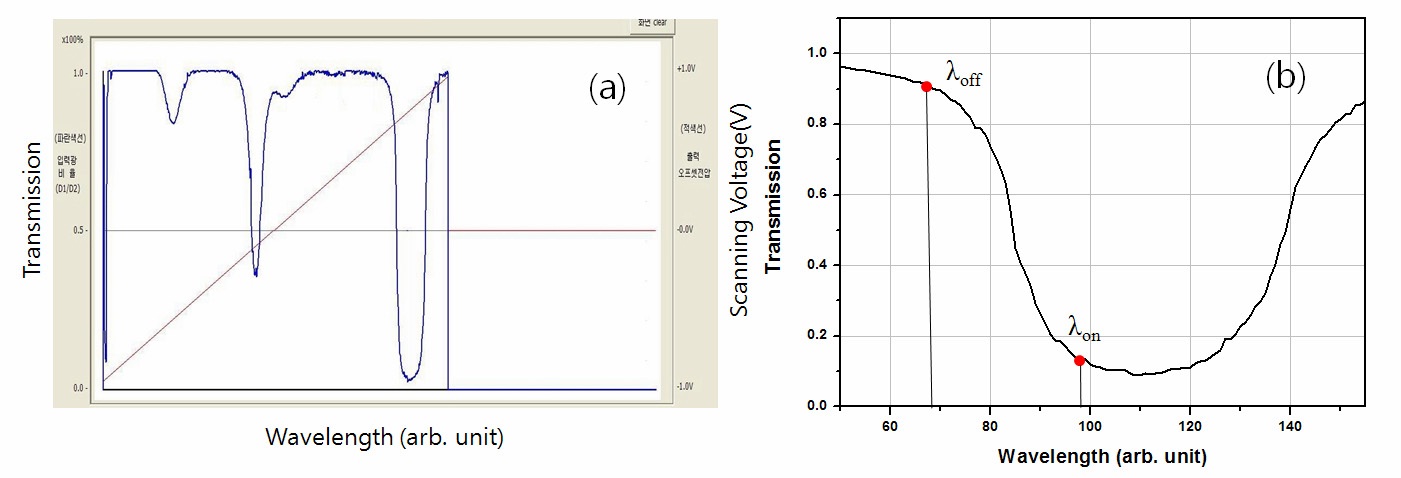
Fig. 2(a) shows a plot of the iodine transmission ratio as a function of the tunable seeder laser wavelength for external input voltages of -1 V to +1 V varied in steps of 100 μV; to the frequency of the laser is 0.87 MHz. Fig. 2(b) shows a plot of the iodine transmission ratio for wavelengths of approximately 532 nm indicating where the laser is locked to off- and on-line wavelengths at transmission ratios of 0.9 and 0.1, respectively, on the edges of the iodine spectral absorption line to stabilize the frequency.
In the case of the iodine DIAL technique, the iodine vapor filter must be temperature controlled because the spectral absorption profiles depend on pressure and temperature. Fig. 3 shows the change in the transmitted signal as the temperature (partial pressure of iodine) of the iodine cell changes.
As we can see, the transmittance property of the iodine cell is straightforward as expected from the theory. To rock the laser wavelength more precisely (i.e., to decrease the pulse-to-pulse concentration error), we must identify the most sensitive area where the iodine absorption value changes quickly in response to a small change in the control voltage. In this respect, the point between the maximum and minimum absorption is the most sensitive wavelength. To increase the detection limit and range, we must also identify a wavelength with strong absorption and a wavelength with weak absorption. Unfortunately, these two conditions are incompatible, so the laser wavelengths must be chosen on a case-by-case basis. When we want to optimize the detection limit, we use two wavelengths that correspond to the maximum and minimum absorption cross sections.
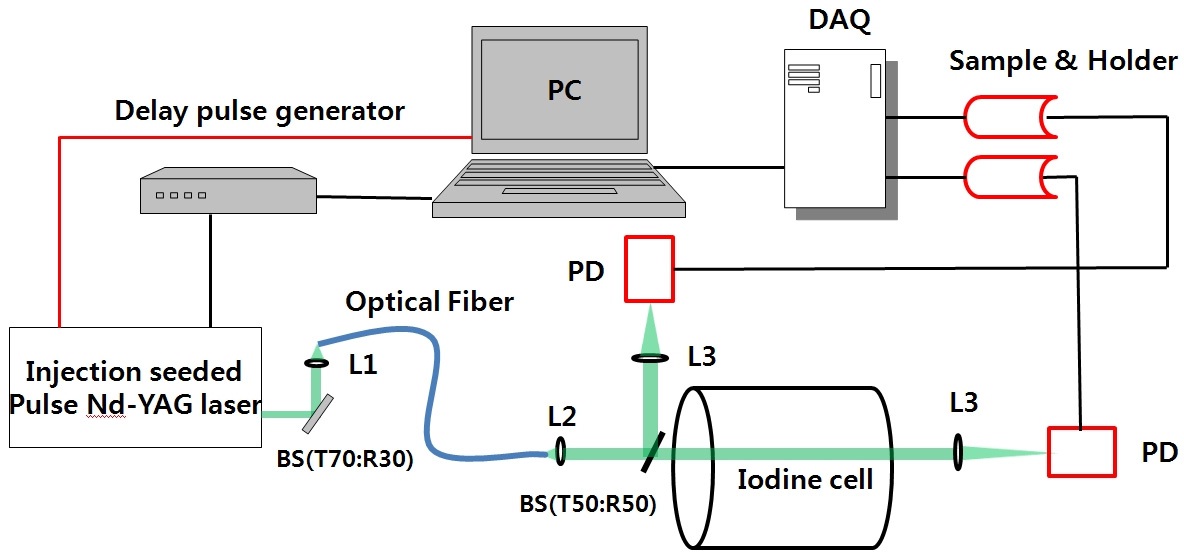
A schematic diagram of the frequency locking is shown in Fig. 4. We divide the light using a beam splitter (T70:R30) before it is transmitted through the target iodine cell. After collection, the reflected light is collimated and transmitted through the optical fiber via lenses (L1 and L2). The collimated light is divided using a beam splitter (T50:R50). One path is used for monitoring the frequency shift, and the other path is used for monitoring energy. When the reflected light is frequency shifted, the variation in the laser energy through the iodine filter is detected in the two optical paths. The output of the reference channel is relayed to a computer as the proportional feedback signal. Signals from the two photodiodes (PDs) are sampled using a National Instruments data acquisition (DAQ) card (USB-6211). For minimizing fluctuations in the signal, a sample-and-holder device (LF 398)
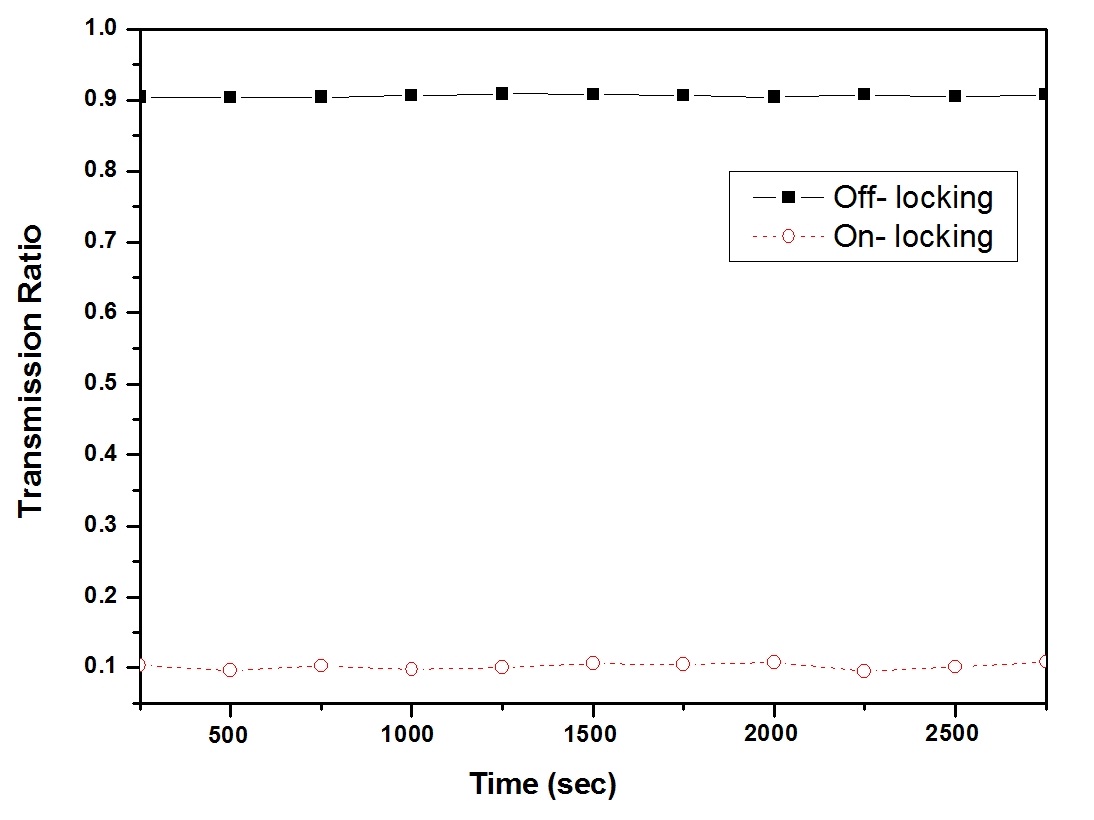
is used before the signal is transmitted to the DAQ card. In addition, the DAQ transmits a DC voltage feedback signal to the seeded laser for the frequency stabilization. The step voltage is approximately 100 μV, and the adjustable seeder laser frequency is approximately 0.87 MHz. To measure the width of the iodine absorption line, we used a Fabry-Perot etalon that has a free spectral range of 4 GHz. Fig. 5 shows the stability of the laser frequency after locking at the 0.9 (off-line) and 0.1 (on-line) transmission ratio points.
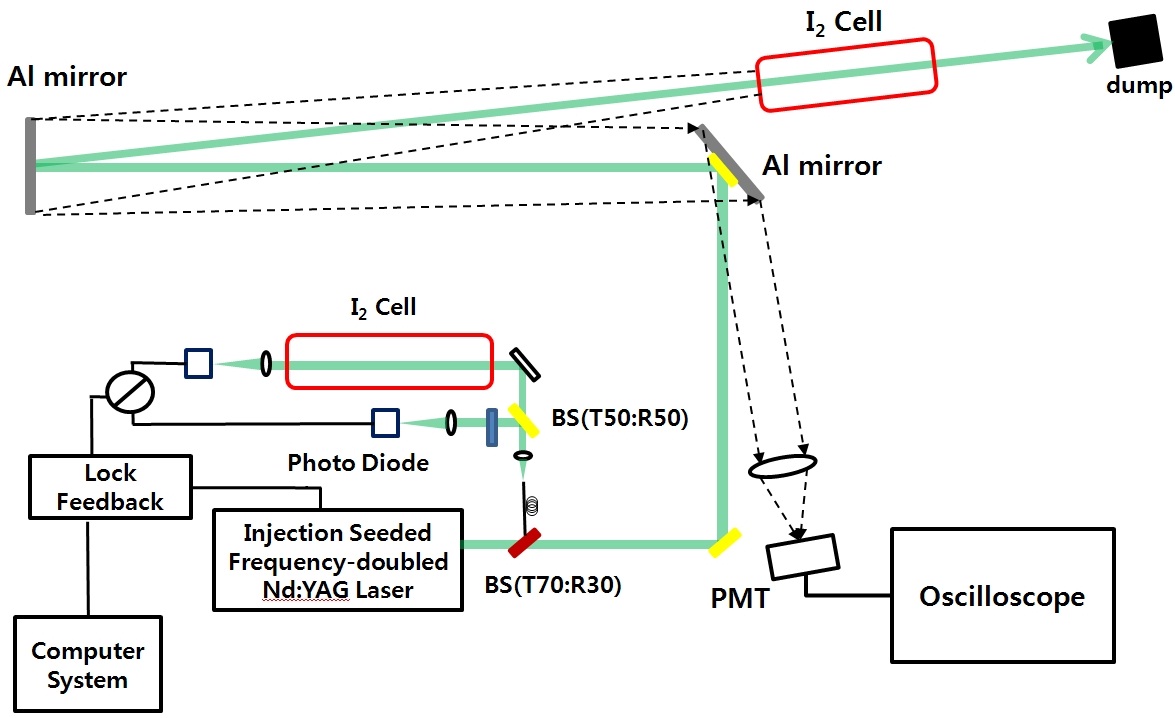
Figure 6 shows the transmitter and receiver system. The laser consists of a Nd:YVO4 seeder laser (Model 6350, Spectra-Physics) and a commercial Q-switched Nd:YAG pulsed laser, which is equipped with electronics to reduce the Qswitch build-up time and trigger a laser pulse.
We first divide the light using a beam splitter (T90:R10) before it is transmitted through the target iodine cell. The reflected light is sent to the frequency-locking device, and transmitted light to the target iodine cell. The backscattered beam from the target iodine cell, Al mirror, and dumper is collected through two 4-inch Al mirrors by a 2-inch lens. The signal is detected by a photomultiplier tube with a maximum amplification gain of 4 × 10⁵. The iodine cell is located about 10 m away from the collecting mirror and is sealed in glass.
To compare the sensitivity of DIAL system for different laser wavelength combinations, we investigate two DIAL conditions: for the first, we use the unseeded laser with the seeded laser frequency locked to
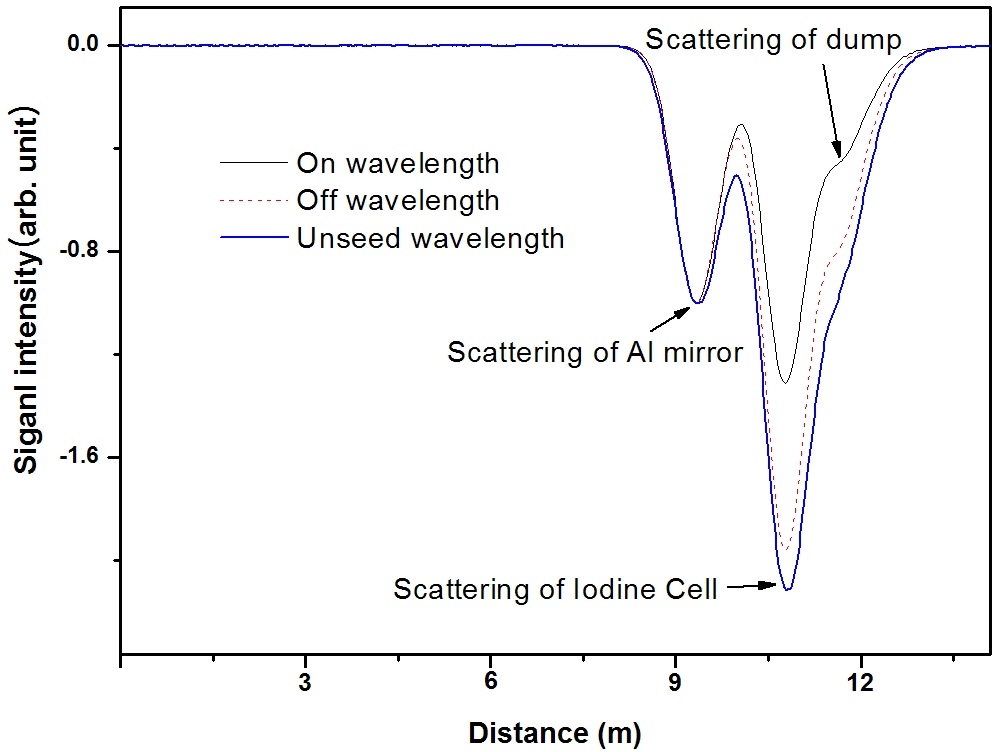
The LIDAR backscattering signals from the iodine cell are shown in Fig. 7. To increase the signal-to-noise ratio, we have averaged the results over 500 measurements. This
improved the accuracy of the concentration and distance. The absorption characteristics of iodine were measured by changing the wavelength combinations, and Fig. 7 shows signals for two different laser combinations. The peak at 9.2 m indicates the scattering of the laser beam from the Al mirror, the peak at 10.7 m is the scattering from the window of the iodine cell, and the weak peak at 11.6 m is from the dump. Even though the reflection scattering signals from the three optical components are not resolved, we can distinguish three peaks because the laser pulse width timeof- flight is longer than the optical distance. The amplitude of the on-line wavelength backscattering signal from the first surface of the iodine cell decreases more quickly than the amplitude of the off-line wavelength in the results for both laser combinations. This effect was due to differential iodine molecule absorption.
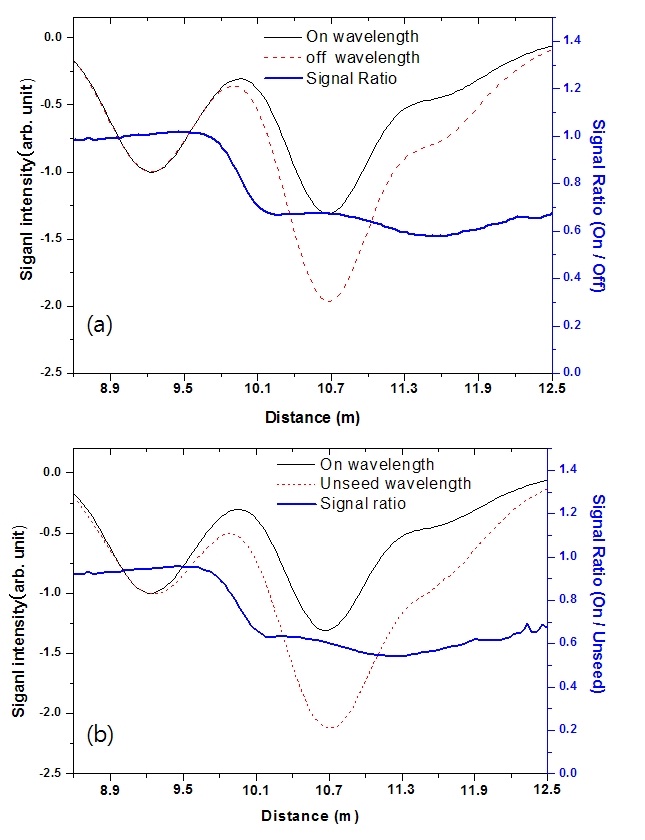
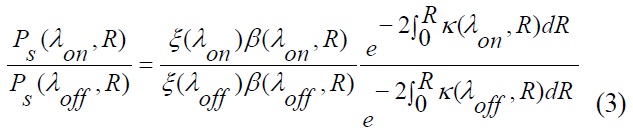
To identify iodine molecular absorption, we obtained two backscattering signals and the signal ratio (Eq. (2)) using the on- and off-line (seeded laser) wavelengths (Fig. 8(a)) and the seeded laser on- and unseeded laser off-line wavelengths (Fig. 8(b)). The backscattering signal intensity is indicated on the left axis and the signal ratio as calculated by Eq. (2) is indicated on the right axis. As we can see, the signal ratios decrease after the light passes through the iodine cell and the ratios for the two cases are similar. This is because the off-line wavelengths for both the seeded and unseeded laser have similar absorption cross sections [8]. Thus, the unseeded laser off-line wavelength can be used instead of the seeded laser wavelength for the measurement of molecular iodine. From this result, we can conclude that a single laser can be used for the DIAL system. This is advantageous because it reduces the complexity of the locking system, and the differential scattering effects need not be considered.
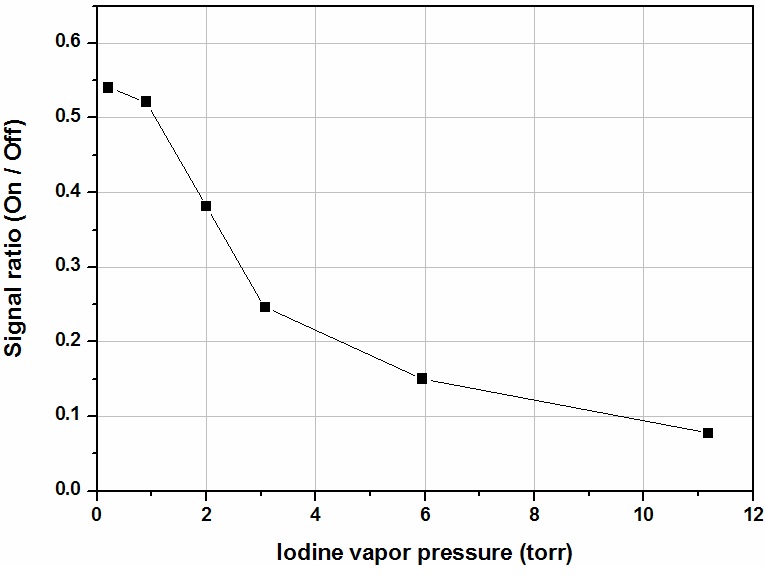
To check the variation in the ratio signal as a function of the iodine concentration, we obtained backscattering signals from several different iodine cell conditions by varying the
cell temperature from 25 to 75℃. The results are shown in Fig. 9. As the iodine cell concentration increases, the seeded laser on-line/off-line ratio decreases. The iodine cell concentration was calculated from the characteristics of the iodine vapor pressure dependence on temperature [12]. The
results indicate that the iodine absorption coefficient increases according to the increasing iodine cell temperature.
We have presented a new DIAL system developed by the Korea Atomic Energy Research Institute for the detection of molecular iodine. For the iodine measurement, the transmission ratio using the injection-seeded laser is locked to 0.9 (off line) and 0.1 (on line) on the edges of the iodine absorption line to stabilize the frequency. An unseeded Nd:YAG laser is used for the off-line wavelength.
The DIAL measurements were performed using a target iodine cell in the laboratory. We confirmed that the on- to off-line ratio decreased after the laser passed through the iodine cell. In addition, we confirmed that the unseeded laser off-line wavelength can be used instead of the seeded laser off-line wavelength for the measurement of molecular iodine. Thus, a single laser may also be used in our DIAL system. Furthermore, the system does not need any differential scattering effects because the seeded laser wavelength (