Carassius fish species still remain controversial in their species status owing to extreme morphological variation, hybridization with related species (Hanfling et al., 2005; Toth et al., 2005), and complicated ploidy level (Murakami and Fujitani, 1997). There had been well-established agreement on Carassius fish in South Korea until quite recently, as Yang (1985) has investigated genetic and morphological characteristics in South Korean populations, concluding that Korean population of Carassius was composed of diploid and triploid individuals of C. auratus langsdorfi. Later this view was supported by several studies (e.g., Nam et al., 1989).
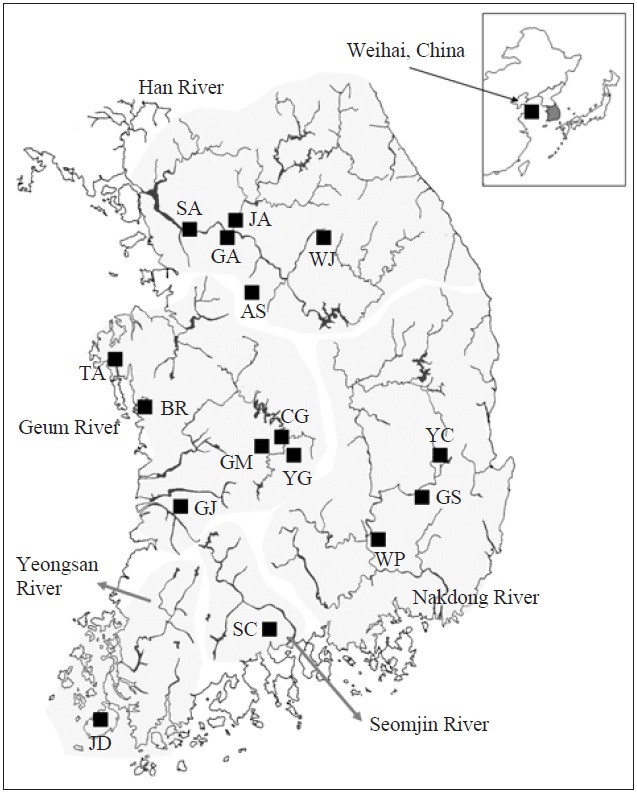
However, further information has come to light in a more recent study of mitochondrial genetic variation of Carassius populations in South Korea (Jung et al., 2009). Korean populations are composed of 3 mitochondrial genetic lineages, and two of them are geographically structured over westward rivers and southward rivers. The former includes the Han, Geum, and Yeongsan rivers, and the latter includes the Nakdong and Seomjin rivers (see Fig. 1). The northeastern population of China (Weihai, Shantung Province) was found to have a close genetic relationship with westward river populations of Korea. Moreover, all the genetic lineages are not related with C. auratus langsdorfi, which had been believed to be the identity of Korean Carassius population until that time.
Although mitochondrial genetic studies provide us with valuable information for understanding Carassius populations in Korea, they are limited due to their matrilineal nature. Mitochondrial genetic variation, being only one locus, canot provide us with a full account of the Carassius population. Multiple loci data, therefore, are required for elucidating the evolution of Carassius population. Microsatellite markers for the Korean Carassius population have been developed (Jung et al., 2007), and these markers may be useful for enhancing our understanding of genetic structure of Carassius fish. Microsatellite, however, also has limitation in its application to Carassius populations because reliable analysis methods have not been developed for populations with various ploidy individuals.
Amplified fragment length polymorphism (AFLP) may be appropriate for this group of animals. It is easy to implement, doesn’t need prior knowledge of genomes, and has good reproducibility. Hence, it has been very popular in its application to population genetics (e.g., Bensch and Akesson, 2005; Meudt and Clarke, 2007). As AFLP does not consider ploidy level, it is especially useful for organisms with complicated ploidy levels.
In this study, we analyzed the genetic structure of Korean Carassius populations using AFLP genetic polymorphism, and compare the results with those of Jung et al. (2009), in which mitochondrial genetic variation was investigated.
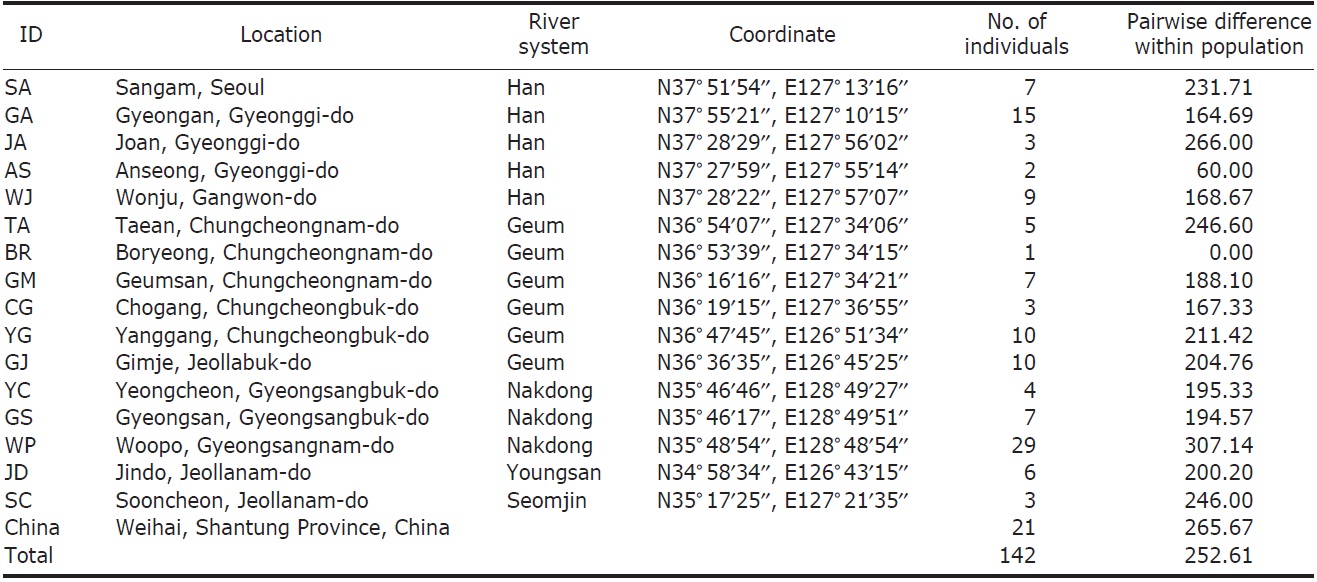
We collected 121 individuals of Carassius auratus from 16 locations in South Korea, including the five major river basins (Table 1, Fig. 1), using fishing nets or traps. The fish samples (21 individuals) from Weihai (Shantung Province, China) were bought from the fish market. The samples were fixed using an absolute ethanol solution after capture. A total genomic DNA was extracted by using the standard phenol extraction procedure.
The AFLP methods used in this study were those of Jung et al. (2006, 2010). Total genomic DNAs were digested using a restriction enzyme mixture for 1 h at 37℃, followed by additional 3 h of digestion at 16℃. After inactivation of
restriction enzymes, EcoRI adaptor (ECO-F and ECO-R) and the MseI adaptor (MSE-F and MSE-R) were attached to
[Fig. 1.] A map denoting the sampling locations in this study and the major river systems. AS, Anseong; BR, Boryeong; CG, Chogang; GA, Gyeongan; GJ, Gimje; GM, Geumsan; GS, Gyeongsan; JA, Joan; JD, Jindo; SA, Sangam; SC, Sooncheon; TA, Taean; WJ, Wonju; WP, Woopo; YC, Yeongcheon; YG, Yanggang.
the sticky ends of the restriction fragments using T4 DNA ligase. Pre-amplification was conducted using two AFLP primers (ECO-A and MSE-A) (see Jung et al. [2006, 2010] for detailed information of reaction mixtures and experimental conditions). In selective amplification, ECO-AGG and MSE-AXX primers were used. ECO-AGG was labeled with fluorescent dye, 6FAM, and three types of MSE-AXX?MSE-ACC, MSE-ACG, and MSE-AGG?were prepared. The composition of the PCR reaction mixture was identical to that employed in pre-amplification, except that a 20-fold diluted pre-amplification PCR product was utilized as the template. All the PCR amplifications were performed on a GeneAmp 9700 machine (Applied Biosystems, Foster City, CA, USA). The selective amplification products were determined using a Genetic Analyzer 3730 (Applied Biosystems), and the band size and genotype were determined using the GENEMAPPER 4.0 (Applied Biosystems).
We evaluated independence among the polymorphic loci and then eliminated redundant loci by using AFLPOP (Duchesne and Bernatchez, 2002). Pairwise difference among individuals within population, implicating genetic variation within population, was determined by using ARLEQUIN 3.11 (Excoffier et al., 2005). With the same software, pairwise FST values between local populations were calculated. Then these values were linearized with Slatkin’s transformation (FST/(1-FST)). A neighbor-joining dendrogram denoting the genetic relationship among populations was determined from a matrix of linearized pairwise FST values by using MEGA 5.0 (Tamura et al., 2011). Analysis of molecular
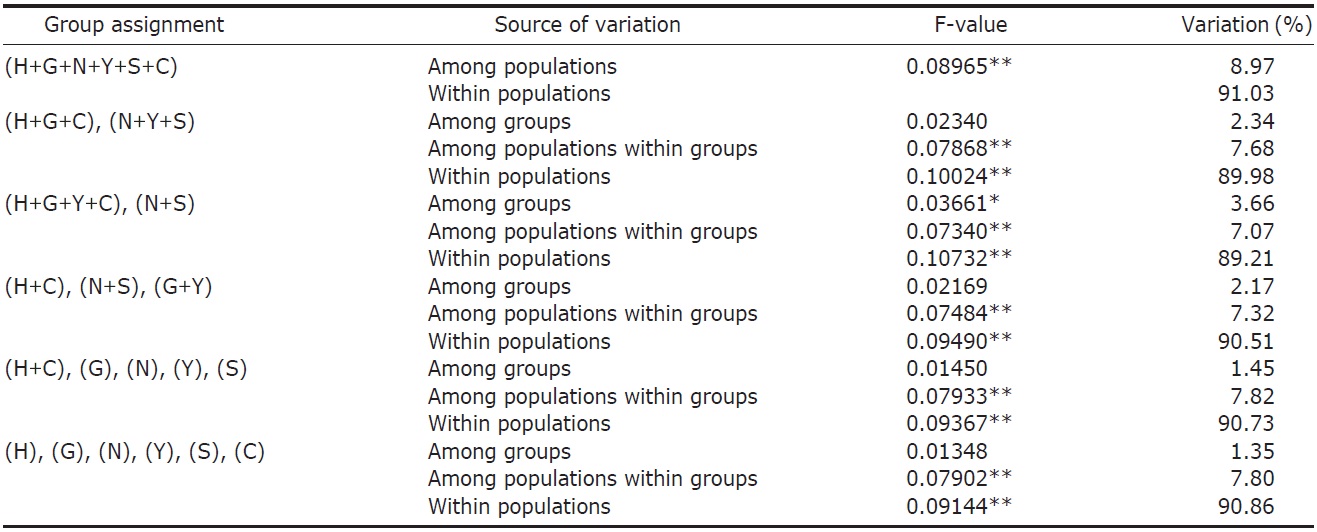
variance (AMOVA) (Weir and Cockerham, 1984) was performed by using ARLEQUIN 3.11 (Excoffier et al., 2005) with various combinations of river systems (see Table 2). Bayesian clustering of individuals based on their AFLP genotypes was determined by using STRUCTURAMA (Huelsenbeck et al., 2011). The number of populations and the expected prior number of populations were randomly drawn from gamma distribution (parameter setting: shape, 1; scale, 1). Markov chain Monte Carlo (MCMC) simulation was executed for 30,000 steps of Markov chain, and simulated parameters were sampled every 100 steps. After MCMC simulation, sampled parameters were summarized and individuals were assigned to populations.
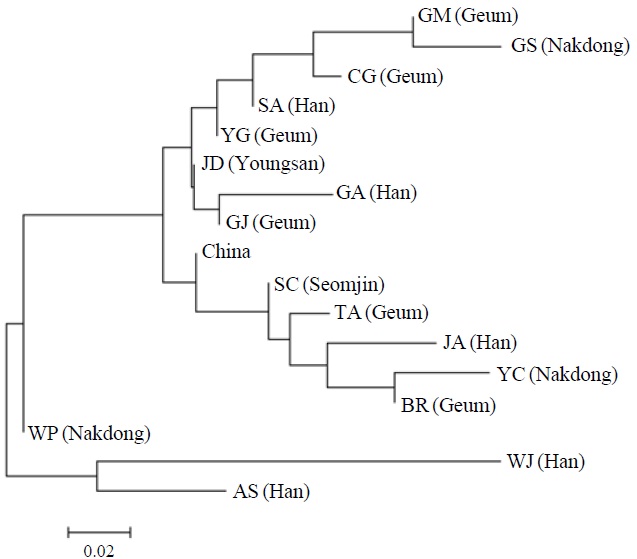
AFLP analysis on 142 individuals of Carassius auratus revealed 1,218 loci ranging from 40 to 999 bp in size. The mean number of pairwise difference among all individuals in our study was 252.61±108.66. Individuals from the Woopo represented the highest pairwise difference among individuals (Table 1). AMOVA revealed that there was a small (3.66%) but significant (p?0.05) genetic variance between westward river systems (Han, Geum, and Yeongsan rivers, and the Weihai population of China) and southward river systems (Nakdong and Seomjin rivers) (Table 2). However, the results of the neighbor-joining dendrogram (Fig. 2), drawn from a linearized pairwise FST matrix, told a different story, where local populations were not organized with respect to the river systems from which they had originated. Bayesian clustering
[Fig. 2.] A neighbor-joining dendrogram depicting the genetic relationship among local populations in this study. The major river system including each local population is denoted in parenthesis. AS, Anseong; BR, Boryeong; CG, Chogang; GA, Gyeongan; GJ, Gimje; GM, Geumsan; GS, Gyeongsan; JA, Joan; JD, Jindo; SA, Sangam; SC, Sooncheon; TA, Taean; WJ, Wonju; WP, Woopo; YC, Yeongcheon; YG, Yanggang.
analysis supported that there is one population of Carassius auratus in South Korea.
A recent study on the mitochondrial genetic variation of the Korean Carassius population revealed that there are 3 mitochondrial genetic lineages (pgA, pgB, and pgC) (Jung et al., 2009). Of these, pgA and pgB are distributed over westward rivers and southward rivers, respectively, indicating that mitochondrial genetic variation is geographically structured in South Korea. The results of AMOVA in this study are very similar to those of mitochondrial genetic variation. That is, significant genetic variance has been determined between westward rivers and southward rivers, and the Chinese population is closely related to the westward river population of Korea.
However, other results, such as those of the genetic relationship among populations and Bayesian clustering analysis implicate that the Korean Carassius population is panmictic in view of AFLP genetic variation. Although genetic variance between the westward and southward river populations is statistically significant, only 3.66% of total genetic variance is allocated between these groups. This means that most of genomic variations don’t contribute to the genetic structure of the Carassius population between two large river systems in South Korea.
Considering that almost AFLP loci are located in the nuclear region, it is probable that mitochondrial genetic structure discords with genetic structure inferred from AFLP data. This discordance may be explained by two points. First, differences in the rate of lineage sorting can make this pattern. Lineage sorting must have worked on Carassius populations separated by river systems. The rate of lineage sorting is primarily dependent on the effective population size of the genetic markers concerned. As mitochondrial DNAs are theoretically one-fourth of nuclear DNAs in terms of their effective population size, mitochondrial DNAs shows faster lineage sorting. Therefore, AFLP genetic variations are not fully differentiated between westward and southward river populations, despite the fact that their mitochondrial genetic variations are. Second, there has possibly been gene flow between populations of westward rivers and southward rivers, which may keep AFLP genetic variations from being sorted between these groups. It is suggested that river capture between river systems has taken place, from the result of mitochondrial genetic variation (Jung et al., 2009). As these two factors are not mutually exclusive, both may have influenced the shaping of these patterns.
Compared to the results of mitochondrial genetic data, those of AFLP seem to complicate our understanding of the history and taxonomy of Korean Carassius fish populations. The evolution and taxonomy of Carassius fish in Korea could be clarified only after grasping diverse phenomena such as polyploidization and extreme morphological variation etc., observed in this group of fish. Hereafter, approaches that integrate diverse evidences such as chromosomal, morphological and genetic data are required.