The green microalga, Haematococcus pluvialis Flotow (Chlorophyceae), is considered to be the richest natural source of astaxanthin for pharmaceutical, nutraceutical, and cosmetics applications due to its high antioxidant activities and for the aquaculture and poultry industries due to its impact on animal pigmentation (Miki 1991, Nishino 1998, Kobayashi 2000, Guerin et al. 2003, Karppi et al. 2007). Mass cultivation of H. pluvialis for commercial purposes has been exploited in both open ponds (Johnson and An 1991, Zhang et al. 2009) and closed photobioreactors of various designs since the 1990’s (Lorenz and Cysewski 2000, Han et al. 2013). Light and nitrogen are the two most effective factors that influence growth and astaxanthin synthesis in this organism. Because the light and nitrogen requirements for growth are different from that for astaxanthin synthesis, a two-step cultivation strategy is commonly adopted in which the first step is to promote algal growth under favorable culture conditions (e.g., low light and nitrogen-replete). When a high, yet optimized cell density is reached, the culture enters into the second step where algal cells are subjected to stress conditions (e.g., high light and nitrogen deplete) for astaxanthin production (Borowitzka et al. 1991, Boussiba and Vonshak 1991, Lorenz and Cysewski 2000, Fabregas et al. 2001, Torzillo et al. 2003, Aflalo et al. 2007). As Haematococcus cells are green in the first step and red in the second one, the first step is also called the ‘green stage’ and the second step is called the ‘red stage’.
In a previous study, we demonstrated that a record high astaxanthin productivity of 17.1 mg L-1 d-1 can be obtained from H. pluvialis culture in an outdoor glass column photobioreactor in which high nitrogen (17.6 mM nitrate-N) was supplied and the initial biomass density (IBD) was optimized (Wang et al. 2013). The work suggested that nitrogen, although is a critical factor, does not work alone, but interacts with other factors, such as light intensity, to affect overall astaxanthin production. Likewise, the effect of light intensity on astaxanthin production can be largely altered by algal density in the culture, as the latter affects the light availability to individual cells under a given incident light intensity (Hu and Richmond 1996, Hu et al. 1998). In order to maximize astaxanthin production in H. pluvialis culture, an optimal nitrogen concentration (rather than the lower the better) and light intensity (rather than the higher the better) must be determined.
In this study, the combined effect of nitrogen concentration and algal biomass density (which affects light intensity at the single cell level) on astaxanthin production potential was investigated in H. pluvialis grown in an outdoor glass column photobioreactor. First, the effect of IBD on astaxanthin production under nitrogen deplete condition was determined. The optimal IBD identified served as a baseline upon which the effect of different initial nitrogen concentrations on astaxanthin production was then assessed. The results indicated that it was the optimized IBD under nitrogen limited (i.e., 4.4 mM nitrate), rather than nitrogen-deplete or nitrogen-replete conditions that resulted in the highest astaxanthin productivity.
Haematococcus pluvialis Flotow K-0084 was obtained from the Scandinavian Culture Collection of Algae and Protozoa at the University of Copenhagen, Denmark and maintained in BG11 culture medium (Stanier et al. 1971). Cultures were conducted in glass column photobioreactors each measuring 0.7 m height and 4.2 cm inner diameter with a working volume of 0.6 L. The culture was continuously bubbled with compressed air containing 1.5% (v/v) of CO2 to provide sufficient amounts of carbon for photosynthesis while maintaining pH at 7-8. Green stage cultivation was conducted under laboratory conditions (20℃, continuous illumination of 30 μmol m-2 s-1). Cells in the late log phase (10-12 days old) was used as “seed” for outdoor experiments which were carried out at Arizona State University Polytechnic campus in Mesa, Arizona, USA (33°24′ N, 111°49′ W) from March 7 through May 18, 2009. The highest air temperatures during day time were 25.5℃ in March and 32.2℃ in May, while the lowest air temperatures during night time were 7.2℃ in March and 14.4℃ in May. The monthly average precipitation was less than 10 mm during the time period when the experiments were conducted. The light intensity measured on the surface of the photobioreactors during the daylight period followed a more or less symmetric double peak curve fashion with the first peak value of 1,900-2,000 μmol m-2 s-1 measured at 9:00-10:00 and the second peak value of 1,400-1,700 μmol m-2 s-1 at 14:00-17:00. Sixteen columns were arranged side by side with an east-west orientation. Culture temperature was maintained between 20-25℃ during the daylight period by an evaporative cooling system.
For the IBD experiment, the culture medium was free of nitrogen, and the IBDs were set as 0.1, 0.5, 0.8, 1.5, 2.7, 3.5, and 5.0 g L-1 DW. For the nitrogen concentration experiment, the BG-11 medium containing 0, 0.375, 0.75, and 1.5 g L-1 sodium nitrate were prepared, which corresponded to the 0, 4.4, 8.8, 17.6 mM nitrate, respectively. More than 90% of the cells for inoculation were in a palmella stage (non-flagellated green vegetative cells) and less than 10% were green swimming cells with two flagella. The average chlorophyll content of inoculum cells was 3.0 ± 0.8% DW. The maximum photochemical efficiency of photosystem II (Fv/Fm), as measured by Dual-Pam-100 (Walz, Effeltrich, Germany) (Stirbet and Govindjee 2011, Wang et al. 2013), was ca. 0.7, indicative of a healthy status of the cells used for outdoor experiments.
Algal biomass concentration was measured by a gravimetric method. Briefly, an aliquot of culture sample (v, 5-20 mL) was filtered through a pre-weighed glass fiber filter (GF/F, pore size 0.4 μm; Whatman, Kent, UK), which was then rinsed with 50 mL de-ionized water to remove any remaining salts on the algae and filter. The filter containing algal cells was dried in an oven at 105℃ overnight to a constant weight. The biomass concentration of the sample DW (g L-1) was calculated as:
, where W1 and W0 represent the weights of the filter paper with and without the algae (g), respectively. Specific growth rate (μ, d-1) was calculated as:
, where t represents the cultivation time at the red stage. The biomass productivity (g L-1 d-1) was calculated as:
For red stage biomass productivity, DWt and DW0 represent biomass densities at day t and day 0 of red stage, respectively, and t represents the cultivation time of the red stage. For overall biomass productivity, DWt and DW0 represent biomass densities at day t of the red stage and biomass at day 0 of the green stage, respectively and t represents the entire cultivation time (green stage plus red stage). An average biomass productivity of the green stage culture of H. pluvialis was 0.1 g L-1 d-1.
The cellular astaxanthin content was measured by reverse-phase high performance liquid chromatography according to Wang et al. (2013). Chlorophyll concentration of algal samples was calculated according to Lichtenthaler and Wellburn (1983). Optical densities at 647 and 663 nm were measured using a spectrophotometer (DU- 650; Beckman and Coulter, Fullerton, CA, USA).
The nitrogen concentration of the culture (in the form of sodium nitrate) was measured by Quikchem8500 (Lachat, Milwaukee, WI, USA) according to the manufacturer’s instructions. Aliquots of 10 mL culture were centrifuged at 10,000 ×g for 10 min, and the supernatants saved for nitrate analysis.
In our previous study we demonstrated that under nitrogen-replete conditions the H. pluvialis cultures varying in IBD (i.e., 0.5, 0.8, 1.5, 2.7, 3.5, and 5.0 g L-1 DW) exhibited a similar growth pattern and reached more or less the same final biomass density (4.1 ± 0.4 g L-1 DW) by the end of a 10 day red stage cultivation. As increasing IBD from 0.5 to 5.0 g L-1, the rate of increase in the cellular astaxanthin content decreased. As a result, the highest astaxanthin content of 2.5% of dry weight occurred in the 0.5 g L-1 IBD cultures, whereas the lowest astaxanthin content of 0.5% was measured in the 5.0 g L-1 IBD cultures. Little biomass increase and a low astaxanthin content of ca. 0.5% were obtained in the 0.1 g L-1 IBD cultures (Wang et al. 2013).
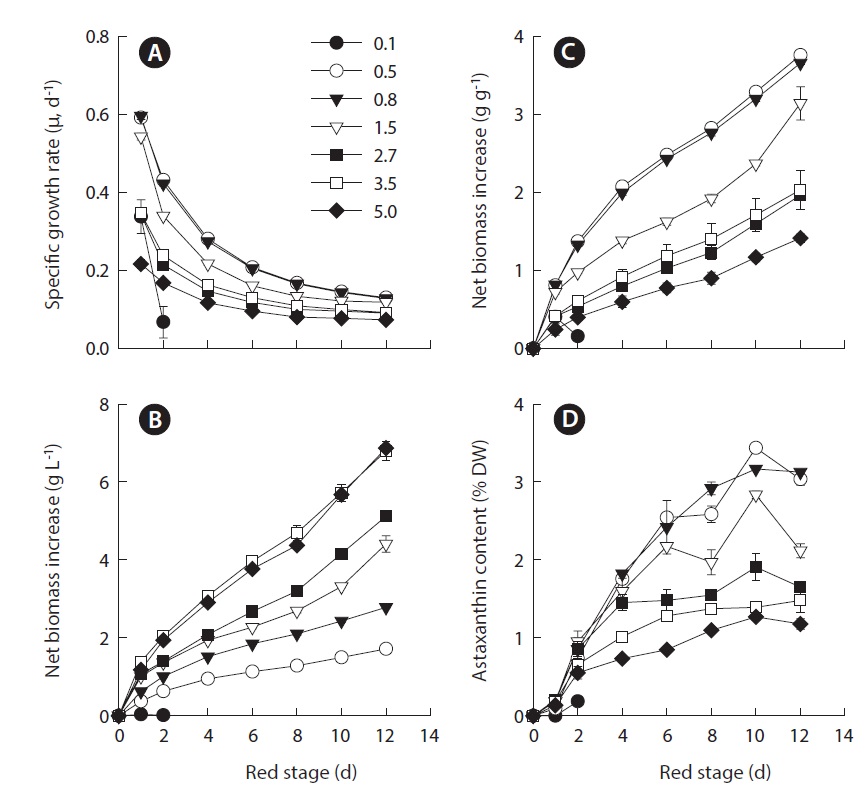
In this study, we took an additional step to determine whether the relationship between IBD and growth and astaxanthin content was influenced by nitrogen depletion. We utilized the same experimental setting used in the previous study except that at the red stage no nitrate was provided to the cultures. The results showed that the maximum specific growth rate of H. pluvialis cultures varying in IBDs from 0.5, 0.8, 1.5, 2.7, 3.5 to 5.0 g L-1 occurred on day 1 of cultivation, and yet the lower the IBD, the higher the maximum specific growth rate obtained. The maximum specific growth rate of 0.6 g d-1 obtained in the 0.5 and 0.8 g L-1 IBD cultures (Fig. 1A) was comparable to that achieved under nitrogen-replete conditions (Wang et al. 2013). As the cultivation continued, the specific growth rates decreased, albeit at different rates. The lower the IBD the more rapid reduction in specific growth rate.
The biomass densities of the different IBD cultures increased gradually during the red stage with more biomass accumulation in the cultures of higher IBDs (Fig. 1B). However, when the biomass increases in the individual cultures were calculated on a per IBD basis, a reverse relationship between IBD and biomass productivity was evident. The higher IBDs resulted in lower net biomass yields (Fig. 1C). When the IBD was 0.1 g L-1, the cells died and the cultures bleached in one or two days due to high light-induced photooxidative cell death (Han et al. 2012).
When the IBD was 0.5 g L-1 or higher, the cellular astaxanthin content increased gradually and reached the highest level on day 10, and thereafter it remained the same or declined. A clear trend was that the lower the IBD the higher the rate of astaxanthin accumulation and thus the higher cellular astaxanthin content. As a result, the highest astaxanthin content of 3.3% dry weight was obtained in the 0.5 g L-1 IBD cultures (Fig. 1D).
Based on the above and our previous experiments (Wang et al. 2013), a general trend was observed that for a given IBD, a nitrogen-deplete culture reduces the final biomass density but increases the maximum cellular astaxanthin content. Regardless of the nitrogen status, the optimal IBD of 0.5-0.8 g L-1 DW was higher than the 0.29 g L-1 applied to an outdoor horizontal tubular photobioreactor (4.85 cm inner diameter, 50 L culture volume) (Torzillo et al. 2003) and 0.4 g L-1 in an outdoor horizontal airlift tubular (30 mm inner diameter, 55 L culture volume) and an outdoor vertical bubble column photobioreactor (20 cm inner diameter, 55 L culture volume)
(Garcia-Malea Lopez et al. 2006), but lower than that (1.3 g L-1) started in an outdoor horizontal tubular photobioreactor (30 mm inner diameter, 2,000 L culture volume) (Aflalo et al. 2007).
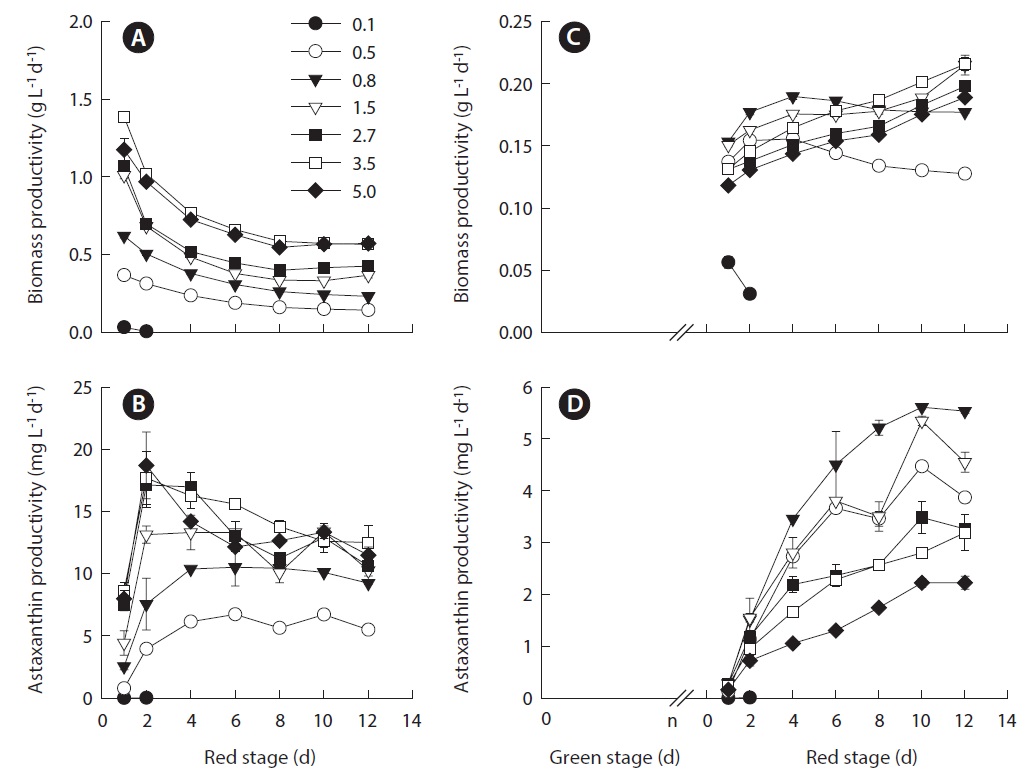
The maximum volumetric biomass productivity in the red stage occurred on day 1 of cultivation. As the IBD increased from 0.5 to 3.5 g L-1, the maximum volumetric biomass productivity increased from 0.37 ± 0.01 to 1.39 ± 0.02 g L-1 d-1. Further increasing in IBD resulted in a slightly reduced productivity. As the cultivation proceeded, the volumetric biomass productivities of all the treatments decreased with distinct patterns, where more dramatic decreases in productivity occurred in the cultures of higher IBDs (Fig. 2A).
Because the volumetric astaxanthin productivity is a function of biomass density and the cellular astaxanthin content, the trend for astaxanthin productivity was somewhat different from that of biomass productivity. As shown in Fig. 2B, the maximum volumetric astaxanthin productivity at the red stage increased from 6.14 ± 0.19 mg L-1 d-1 in the IBD 0.5 g L-1 cultures, to 10.51 ± 1.49 mg L-1 d-1 in the IBD 0.8 g L-1 cultures, to 13.31 ± 1.41 mg L-1 d-1 in the IBD 1.5 g L-1 cultures, and to 18.71 ± 2.69 mg L-1 d-1 in the IBD 5.0 g L-1 cultures. The volumetric astaxanthin productivity of 18.71 ± 2.69 mg L-1 d-1 was the highest ever achieved at the red stage of outdoor H. pluvialis cultures. It is worth noting that the maximum astaxanthin productivity occurred within the first 2 to 4 days when the cellular astaxanthin content was just about half of the maximum attainable. When the cellular astaxanthin content reached the highest level at each IBD on day 10, the volumetric astaxanthin productivity either remained stable at the low IBDs (0.5, 0.8, and 1.5 g L-1 DW) or decreased considerably at the high IBDs (2.7, 3.5, and 5.0 g L-1 DW).
Since the red stage was part of the Haematococcus cultivation process for astaxanthin production, the time spent at the green stage should be taken into account when determining overall productivity. Under our experimental conditions, the average biomass productivity of H. pluvialis at the green stage was 0.1 g L-1 d-1. Accordingly, the time for preparing the inoculum densities of 0.1, 0.5, 0.8, 1.5, 2.7, 3.5, and 5.0 g L-1 DW for outdoor red stage experiments were 1, 5, 8, 15, 27, 35, and 50 days, respectively.
During the entire cultivation period (viz. green stage
[Fig. 2.] Effects of different initial biomass densities (IBDs) on the biomass productivity and astaxanthin productivity of Haematococcus pluvialis in nitrogen-deplete culture medium under outdoor conditions. (A & B) Results on the red stage. (C & D) Results on the green + red stages. The average biomass productivity of green stage culture of H. pluvialis was 0.1 g L-1 d-1. Accordingly, the time (n) for preparing the inoculum densities of 0.1, 0.5, 0.8, 1.5, 2.7, 3.5, and 5.0 g L-1 DW were calculated to be n = 1, 5, 8, 15, 27, 35, and 50 days, respectively. Data were means ± standard deviations of six measurements from three individual columns (two measurements per column). The values in the legend represent different IBD treatments (g L-1).
plus red stage) the volumetric biomass productivity of the different IBD cultures decreased dramatically. The time required for achieving maximum biomass productivity was also changed. When the IBD was low and moderate (0.5, 0.8, and 1.5 g L-1 DW), the maximum biomass productivity occurred within the first 2 to 4 days of the red stage. In contrast, the maximum biomass productivity was obtained at the end of the red stage when the IBDs were high (2.7, 3.5, and 5.0 g L-1 DW) (Fig. 2C).
Likewise, when the green stage was taken into account, the overall volumetric astaxanthin productivities of the different IBD cultures were reduced considerably as compared to that obtained from the red stage only. However, the trend of volumetric astaxanthin productivity as a function of IBD was drastically different from that obtained from the red stage. The maximum astaxanthin productivity of 4.47 ± 0.03 mg L-1 d-1 was obtained in the IBD 0.5 g L-1 cultures, and it increased to 5.61 ± 0.03 mg L-1 d-1 when the IBD was raised to 0.8 g L-1, above which the higher the IBD the lower the maximum astaxanthin productivity (Fig. 2D).
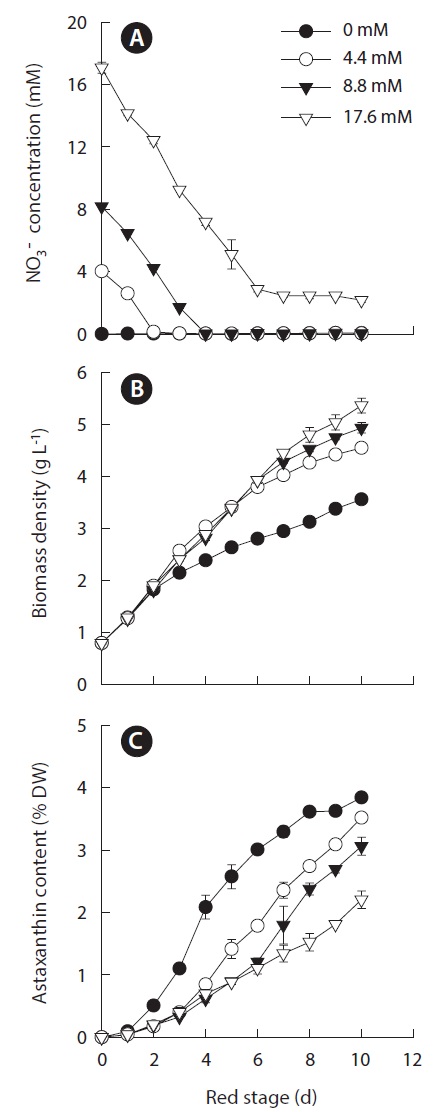
Because the nitrogen availability for achieving maximum growth was mutually exclusive from achieving maximum cellular astaxanthin content, we selected 0.8 g L-1 as the optimal IBD to further optimize the initial nitrogen concentration for maximum astaxanthin production. To this end, the initial nitrogen concentrations of 0, 4.4, 8.8, and 17.6 mM nitrate were chosen and the results are shown in Fig. 3A. At the red stage the nitrate concentrations in the 4.4, 8.8, and 17.6 mM nitrate cultures decreased at more or less the same rate, indicating that Haematococcus cells exhibited the same cellular nitrate uptake rate when the initial nitrogen concentration in the cultures reached a threshold level (ca. 4 mM nitrate). The depletion of nitrate in the 4.4 and 8.8 mM nitrate cultures occurred on day 2 and 4, respectively. In the 17.6 mM nitrate- N cultures, the nitrate concentration decreased to 3.2 mM on day 6 and remained constant thereafter (Fig. 3A). The initial nitrate concentration did affect the final biomass density, i.e., the higher the initial nitrogen concentration in the culture, the greater the final biomass density at the end of the 10 day culture period (Fig. 3B). The increases in final biomass density were due to the increases in both cell number and cell size. As shown in
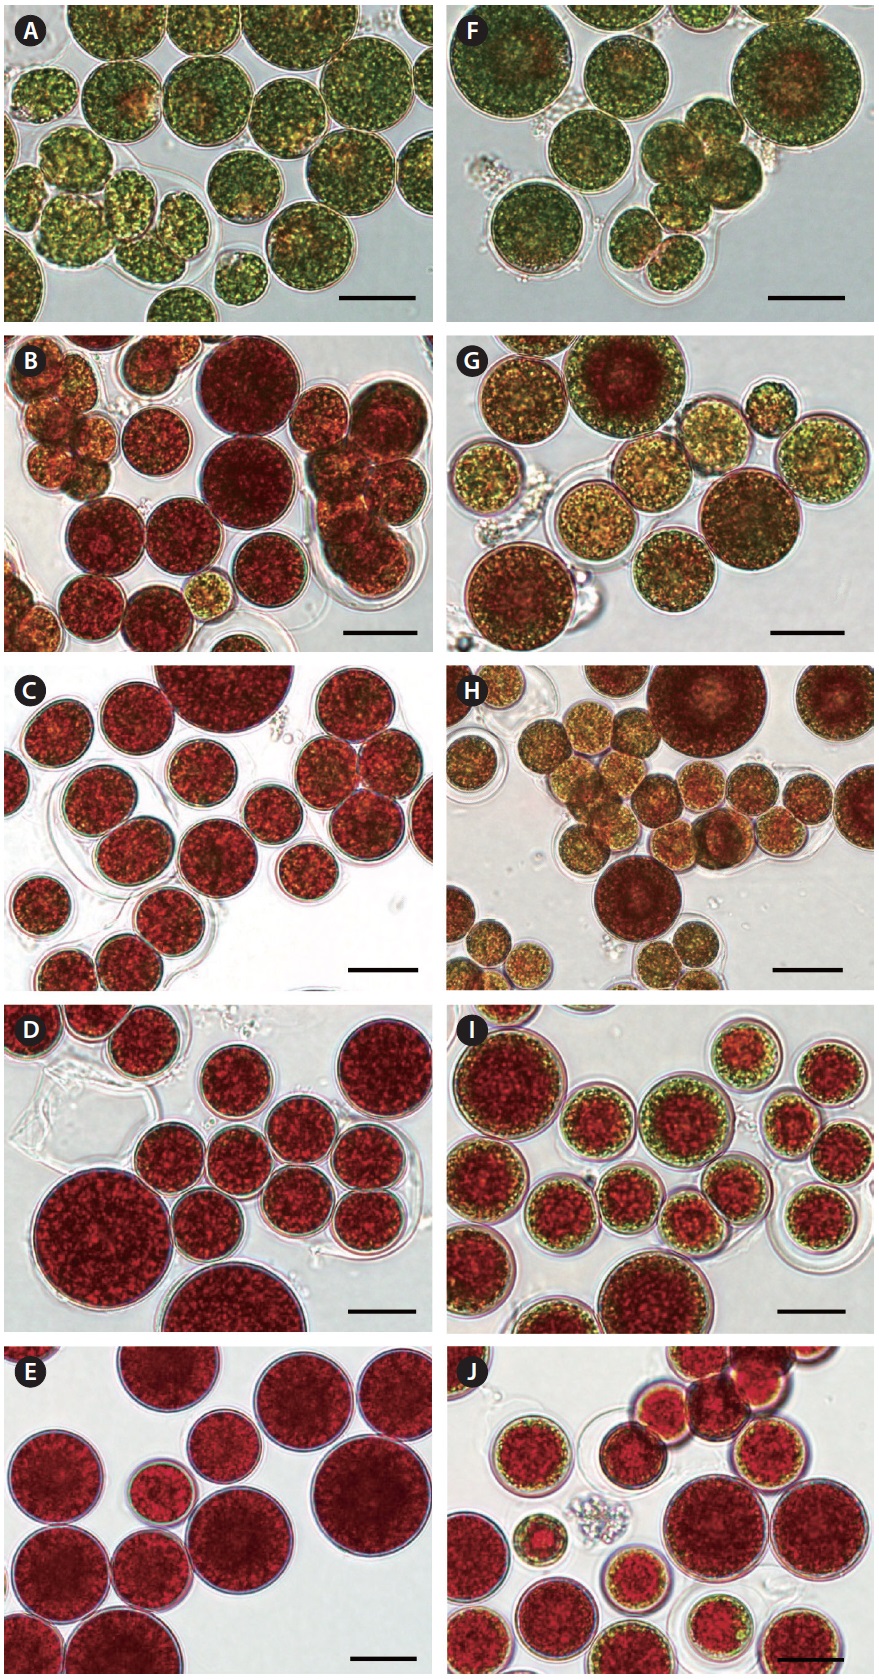
Fig. 4, Haematococcus cells underwent both reproduction and cell enlargement throughout the red stage. We further observed that under nitrogen-deplete conditions, the increase in biomass density was mainly contributed by the increase in cell size, and to a lesser extent cell reproduction. Conversely, it was cell reproduction and to a lesser extent cell enlargement that contributed to biomass increase in the nitrogen-replete cultures. At the end of the red stage, the average diameter of red cysts in the nitrogen-depleted and 4.4 mM nitrate cultures was 28 ± 6 μm, whereas that of red cysts was 18 ± 6 μm in the 8.8 and 17.6 mM nitrate cultures.
A reverse relationship between the initial nitrogen concentration and the maximum cellular astaxanthin content was observed, i.e., the lower the initial nitrogen concentration, the more rapid increase in cellular astaxanthin content and the higher the maximum cellular astaxanthin content. The highest cellular astaxanthin content of 3.84 ± 0.05% DW was obtained in the nitrogen-depleted cultures, whereas the lowest astaxanthin content of 2.20 ± 0.14% DW was measured in the 17.6 mM nitrate cultures (Fig. 3C).
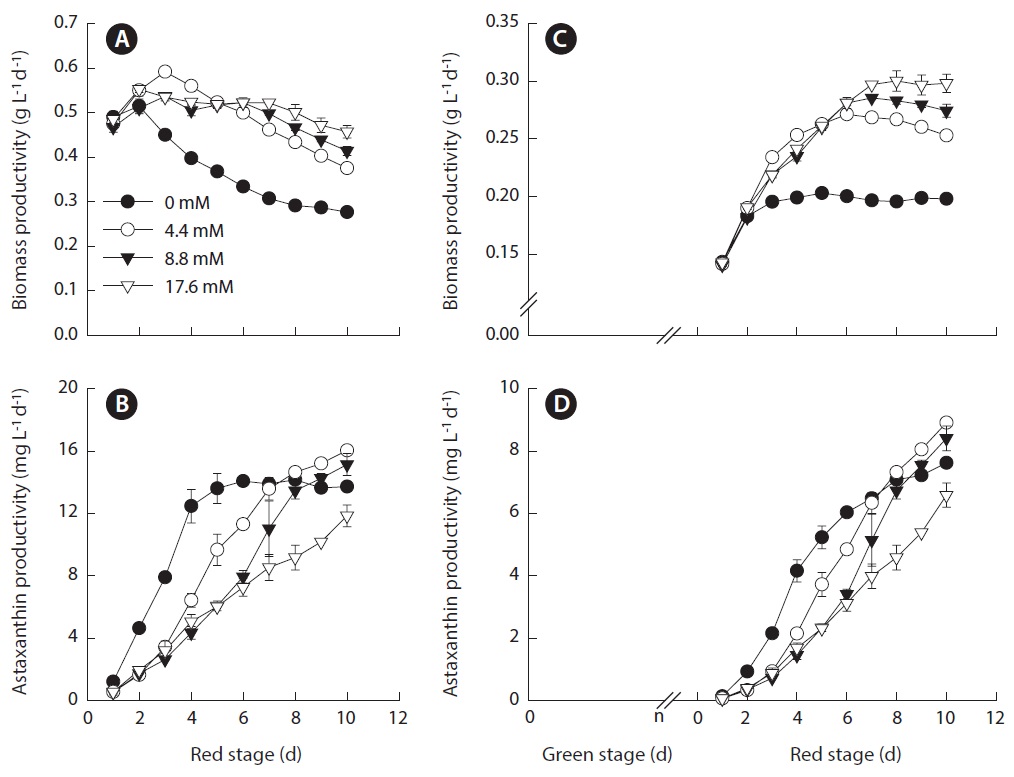
The volumetric biomass productivity as a function of initial nitrogen concentration is shown in Fig. 5A. The fact that the biomass productivity of the nitrate-deplete cultures were identical to that obtained in the nitrate-limited or nitrogen-replete cultures for the first two days suggested that the amount of intracellular nitrogen was sufficient to sustain initial vigorous growth. The highest biomass productivity of 0.59 ± 0.01 g L-1 d-1 was obtained in the 4.4 mM nitrate cultures. The culture with initial nitrate concentration that was lower or higher than this level resulted in reduced biomass productivity. A possible interpretation is that during the transformation of Haematococcus cells, particularly in the early process, from green vegetative cells to red cysts, the cells require a certain amount of nitrogen, which may be too low to sustain normal growth and reproduction but high enough to help augment cellular enzymatic defense systems to cope with high light stress. As a result, the cells can achieve a certain degree of growth / biomass production while synthesizing a large amount of astaxanthin as part of a molecular defense mechanism to protect the cells under stress. Severe growth inhibition with higher astaxanthin synthesis activity may occur in the cells deprived of nitrogen, as in nitrogen-deplete cultures, resulting in overall reduced astaxanthin productivity. When nitrogen is in sufficient supply, like in the case of 8.8 and 17.6 mM nitrate cultures, the cells can grow and reproduce while to a lesser extent synthesize astaxanthin under high light. Note that the optimal initial nitrogen concentration of 4.4 mM nitrate is comparable to that applied to H. pluvialis culture maintained in an indoor aerated mini-reactor (Orosa et al. 2001), an indoor tube bioreactor (30 mm inner diameter, 70 mL culture volume) (Fabregas et al. 2001) and an indoor vertical bubble column (70 mm inner diameter, 1.8 L culture volume) (Garcia-Malea et al. 2005). Regardless the nitrogen availability, the maximum biomass productivity of all the cultures was obtained on day 2 or 3 of the red stage, whereas the maximum astaxanthin content
[Fig. 4.] Photomicrographs of Haematococcus pluvialis cells grown in outdoor glass columns containing 0 or 17.6 mM nitrate medium. Cell images A, B, C, D, and E were taken on days 1, 3, 4, 7, and 10 of the nitrogen-deplete culture, respectively. Cell images F, G, H, I, and J were taken on days 1, 3, 4, 7, and 10 of the 17.6 mM nitrate culture, respectively. Scale bars represent: A-J, 20 μm.
occurred on day 10 or longer. At the red stage, the highest astaxanthin productivity of 16.0 ± 0.15 mg L-1 d-1 was obtained in the 4.4 mM nitrate cultures (Fig. 5B).
When the green stage was taken into account, the maximum volumetric biomass productivity of the nitrate-deplete cultures was 0.20 ± 0.002 g L-1 d-1. When the initial nitrate concentrations were 4.4, 8.8, and 17.6 mM, the maximum biomass productivities increased to 0.27 ± 0.004, 0.29 ± 0.002, and 0.30 ± 0.01 g L-1 d-1, respectively (Fig. 5C). The maximum astaxanthin productivity of 8.9 ± 0.08 mg L-1 d-1 was obtained in the 4.4 mM nitrate cultures, and reduced astaxanthin productivities occurred in cultures with lower or higher nitrogen concentrations (Fig. 5D).
Developing an understanding of the combined effect of algal biomass density and nitrogen availability on growth and astaxanthin synthesis of H. pluvialis has far-reaching biotechnological implications. It has been widely considered that nitrogen depletion combined with high light stress is the most effective method for maximum astaxanthin induction (Borowitzka et al. 1991, Boussiba and Vonshak 1991, Fabregas et al. 2001, Torzillo et al. 2003, Garcia-Malea et al. 2006, Aflalo et al. 2007). In this study, we demonstrated that the IBD and initial nitrogen concentration that lead to highest growth are different from that resulting in the highest cellular astaxanthin content. In other words, a combination of any IBD and initial nitrogen concentration would not simultaneously result in both maximum growth of and greatest cellular astaxanthin content in H. pluvialis. Maximum astaxanthin productivity is, therefore, a tradeoff between the two parameters. To ensure maximum astaxanthin productivity is the primary goal of Haematococcus mass culture, especially when the Haematococcus biomass is used as a food or feed additive. However, if astaxanthin rather than whole cell biomass is the end product, then maximum cellular astaxanthin content may be more critical, as it affects the efficiency and thus cost of astaxanthin extraction and purification from Haematococcus biomass. In the latter case, an optimal IBD in a nitrogen deplete culture medium during the red stage would be the best conditions for achieving maximum cellular astaxanthin content, albeit at somewhat reduced biomass productivity.