Sodium hypochlorite (NaOCl) is widely used to disinfect seawater in power plant cooling systems in order to reduce biofouling, and in ballast water treatment systems to prevent transport of exotic marine species. While the toxicity of NaOCl is expected to increase by ongoing ocean acidification, and many experimental studies have shown how algal calcification, photosynthesis and growth respond to ocean acidification, no studies have investigated the relationship between NaOCl toxicity and increased CO2. Therefore, we investigated whether the impacts of NaOCl on survival, chlorophyll a (Chl-a), and effective quantum yield in three marine phytoplankton belonging to different taxonomic classes are increased under high CO2 levels. Our results show that all biological parameters of the three species decreased under increasing NaOCl concentration, but increasing CO2 concentration alone (from 450 to 715 μatm) had no effect on any of these parameters in the organisms. However, due to the synergistic effects between NaOCl and CO2, the survival and Chl-a content in two of the species, Thalassiosira eccentrica and Heterosigma akashiwo, were significantly reduced under high CO2 when NaOCl was also elevated. The results show that combined exposure to high CO2 and NaOCl results in increasing toxicity of NaOCl in some marine phytoplankton. Consequently, greater caution with use of NaOCl will be required, as its use is widespread in coastal waters.
The anthropogenic input of CO2 into the atmosphere and ocean has been on a constant rise since the Industrial Revolution, resulting in decreased pH and changes in ocean carbon chemistry (Orr et al. 2005). Under the Intergovernmental Panel on Climate Change (IPCC) IS92a scenario, the pH of the ocean will drop 0.2-0.3 units by the end of this century (Caldeira and Wickett 2003), which will drive massive alterations to the lives of marine organisms (Kroeker et al. 2013). Undoubtedly, many studies have shown the combined effects of increased CO2 and other environment parameters, such as iron availability on marine organisms (Endo et al. 2013), changes in the depth of euphotic zone on phytoplankton (Gao et al. 2012
NaOCl is one of the most widely used antifouling agents in power plant cooling and ballast water treatment systems (Gregg and Hallegraeff 2007, Saleem et al. 2012). Given that many power plants are located near coastal regions due to the use of seawater as a coolant, fouling organisms such as barnacles, oysters, and bryozoans often colonize surfaces in their coolant systems, which then interfere with water flow and heat transfer efficiency (Taylor 2006, Polman et al. 2013). Moreover, the number of large transport vessels has expanded on the world’s oceans due to increased global economic activity, resulting in approximately 3,500 mega tons of ballast water being used globally each year for stability and maneuverability of ships during voyages (Endresen et al. 2004). As a result, many exotic marine species have invaded new coastal regions through ballast water, causing serious disturbances to marine ecosystems (Gray et al. 2006, Smayda 2007). UV radiation, ozone (O3) treatment, heat exposure, and various chemicals are all used to prevent biofouling and the introduction of exotic species. Also chemical treating these waters with NaOCl has received considerable attention as a simple and efficient method of reducing fouling (Allonier et al. 1999, Gregg and Hallegraeff 2007).
When NaOCl is added to water, it dissociates into sodium hydroxide (NaOH) and hypochlorous acid (HOCl), as shown in Eq. (1). HOCl further dissociates into hypochlorite (OCl-) and hydrogen ions (H+) as shown in Eq. (2). This dissociation is reversible and strongly dependent
[Table 1.] Seawater carbon chemistry of two CO2 levels
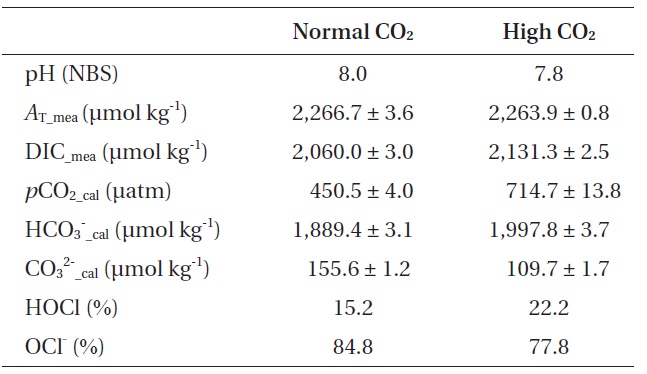
Seawater carbon chemistry of two CO2 levels
on pH (Sarbatly and Krishnaiah 2007). Generally, 25% of the HOCl will occur as free chlorine at pH 7.7 in 20℃ seawater under a 30 psu condition, but the proportion of HOCl increases as pH decreases (Sugam and Helz 1976). According to the Eq. (2) equilibrium, almost 99% of the HOCl will be free chlorine at pH 5.2, and about 99% will be OCl- at pH 9.3.


HOCl is 80-200 times stronger than OCl- in terms of pathogen disinfection (White 1992). A pH reduction of 0.2-0.3 units will increase the proportion of HOCl by 7% (Table 1). Despite this small change, increased CO2 (lower pH than present day) will increase the proportion of HOCl, which might also increase NaOCl toxicity to organisms.
In this study, we examined the short-term effects of increased levels of CO2 and NaOCl, both alone, and in combination, on the abundance, Chl-
Three species of marine phytoplankton,
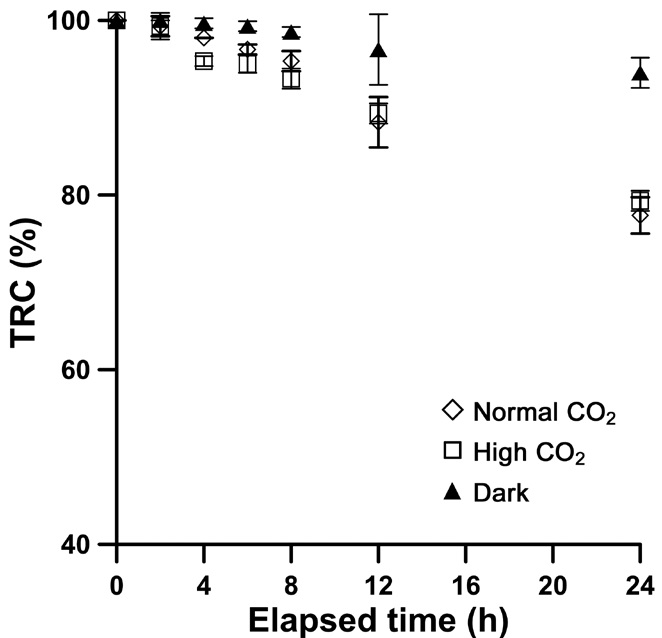
The NaOCl solution was produced by electrolysis from GF/F filtered seawater with an immediate reaction from a 4.5 A electrical current supply. Total residual chlorine (TRC) concentration was determined by the iodometric method (Clesceri et al. 1999). In this experiment, the same seawater was used, as the NaOCl TRC concentrations vary depending on the presence of organic matter, temperature, salinity, and the chemical speciation of elements (Kester 1986).
Two levels of seawater CO2 concentration, normal (450 μatm) and high (715 μatm) CO2 were prepared for the experiment based on IPCC’s IS92a scenario. Specifically, high CO2 seawater was established by spiking CO2-saturated seawater into normal seawater (dilution ratio of CO2-saturated SW to normal SW = 4/1,000). The pH difference was about 0.2 units initially (calibrated using standard NBS buffers at pH 7 and 10; checked using pH meter; PHM 210; Radiometer Analytical SAS, Lyon, France), and total alkalinity (
To evaluate the synergistic effects of high CO2 and Na- OCl on the three phytoplankton species, each species was exposed to the two levels of CO2 and four NaOCl concentrations (0, 1.0, 2.0, and 3.0 ppm for
>
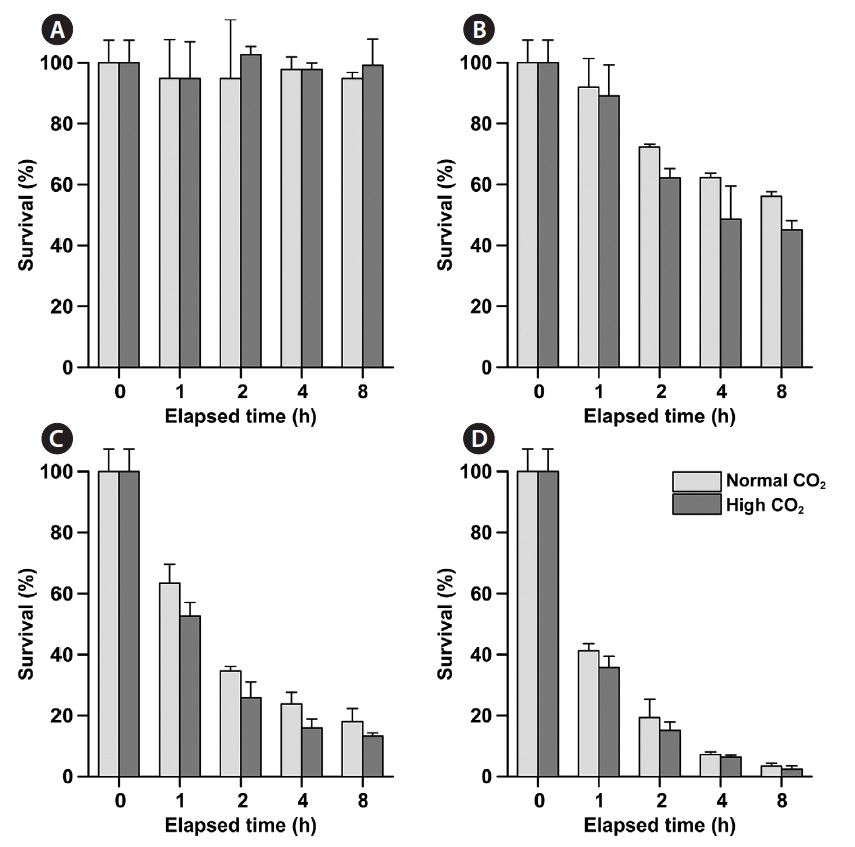
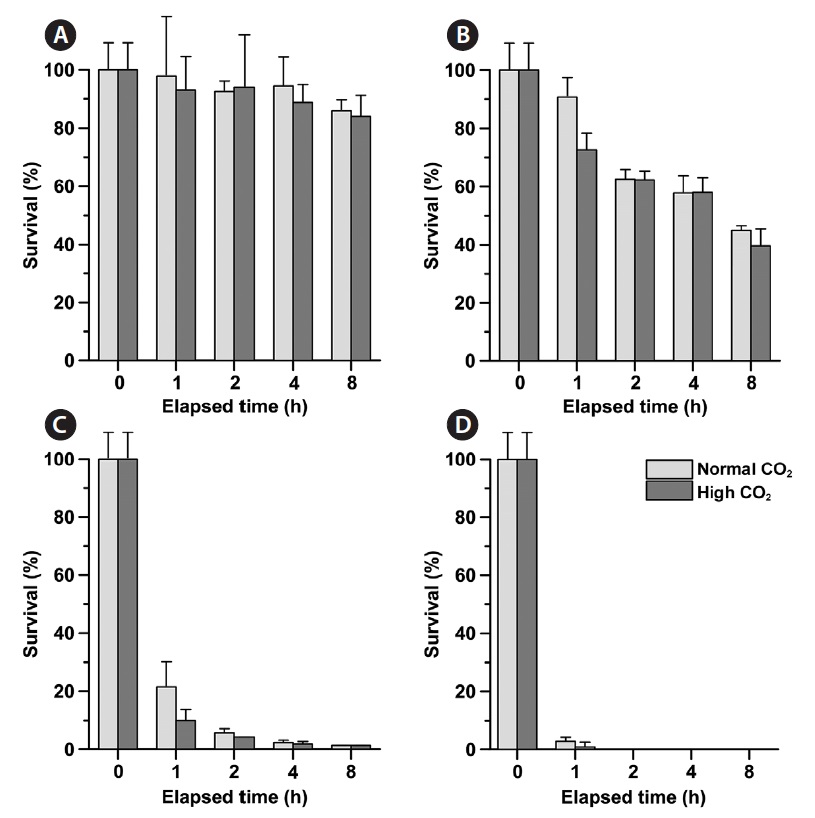
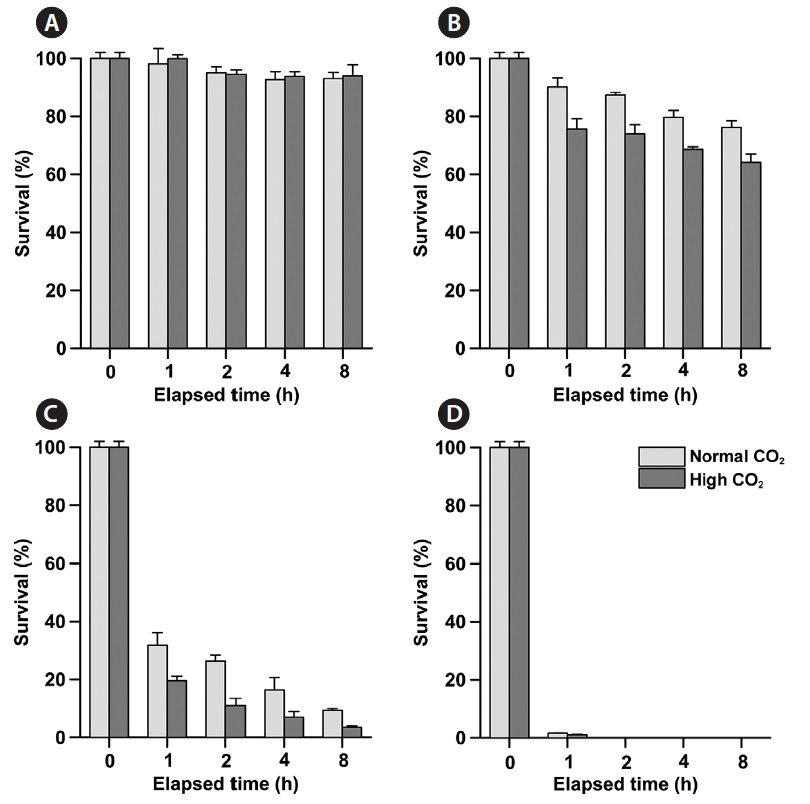
Phytoplankton abundance and survival
Preserved phytoplankton cells from single and combined CO2 and NaOCl experiments were enumerated using a Sedgwick-Rafter counting chamber (1 mL) and an inverted microscope (Axiostar plus; Carl Zeiss, Oberkochen, Germany). Survival (%) was calculated by dividing the number of live individuals by the total number of individuals in each treatment. Additionally, the 1-h lethal median concentration (LC50) was determined by the Probit analysis method (Finney 1971).
To determine the Chl-
>
Effective PSII quantum yield measurement
PSII photochemical efficiency was assessed at set time intervals (0, 1, 2, 4, and 8-h) using a Phyto-PAM (Walz, Effeltrich, Bavaria, Germany). The Phyto-PAM applies light emitting diodes with a peak emission at 650 nm, saturating flashes, and actinic irradiance. The fluorescence of a cell-free control was determined using seawater filtered with a Whatman GF/F filter to correct the background fluorescence. The effective quantum yield (ΦPSII) was measured using light-adapted samples, at 50 μmol photons m-2 s-1.
The Shapiro-Wilk’s test was used to determine the normality of the distribution at the 0.05 level, and equal variances were tested using the Levene’s test. Although for the majority of test cases, the assumptions of normality were not met even after arcsine transformation, statistical differences in untransformed data (initial / final) were examined by general linear model (GLM) and twoway analysis of variance (ANOVA) was used to assess the effects of NaOCl and high CO2 level, both alone, and in combination. Additionally, non-parametric Kruskal-Wallis test and Shapiro-Wilk’s test were used to identify the statistical significant differences among the treatments
(two levels of CO2 and four concentrations of NaOCl) on the abundance, survival, Chl-
>
Carbon chemistry and TRC concentration
The carbon chemistry of high CO2 seawater was altered as the
>
Phytoplankton abundance and survival
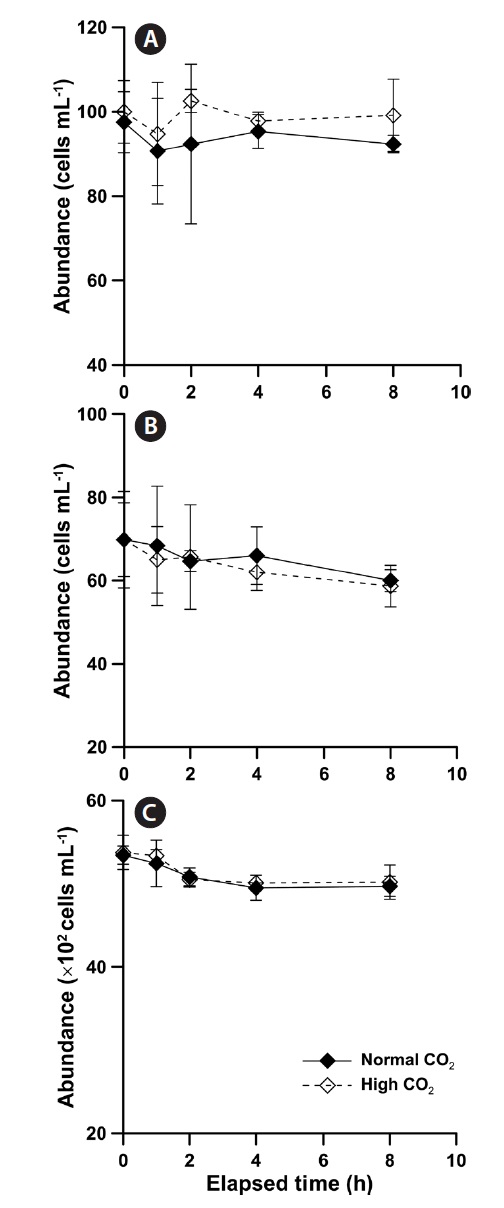
The abundances of
The abundance of
8-h and there were no significant differences between initial and final abundance (Fig. 2B & C).
Phytoplankton survival (%) was dependent upon Na- OCl concentrations and varied between species. The 1-h LC50 values for
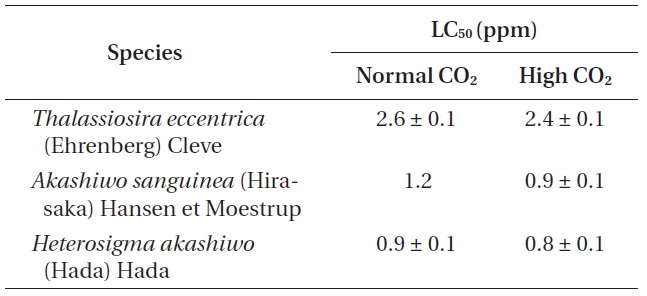
The 1-h LC50 (ppm) values of three phytoplankton species exposure to four different concentrations of sodium hypochlorite (NaOCl) under normal and high CO2 level seawaters
1-h LC50 values were observed for
The LC50 values of
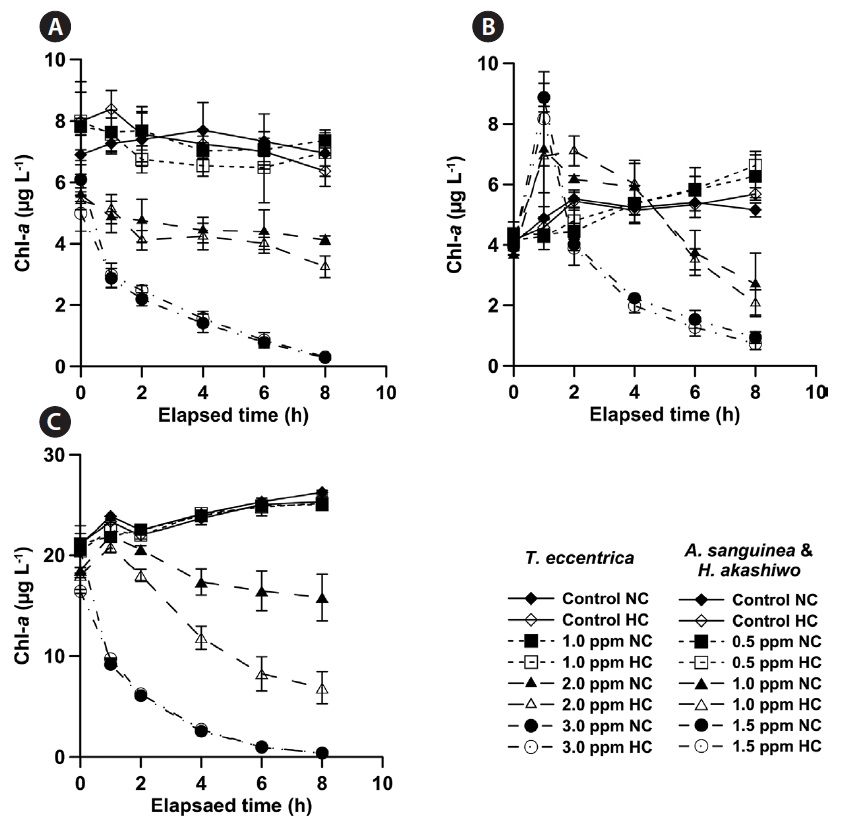
The Chl-
Regardless of CO2 concentration, Chl-
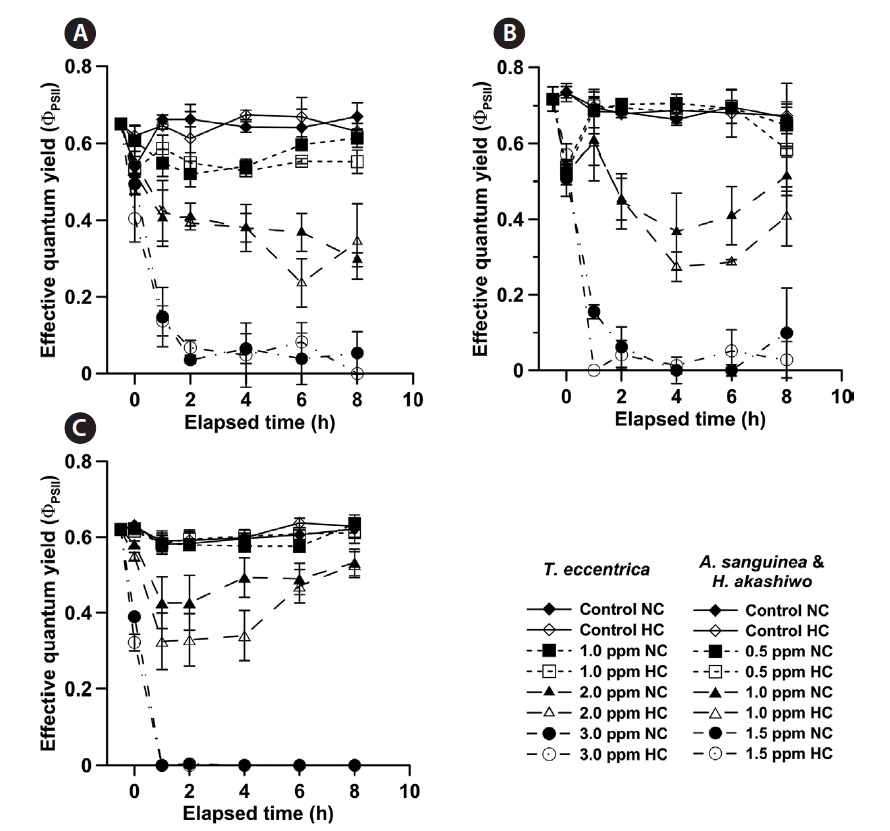
No significant changes in the ΦPSII of
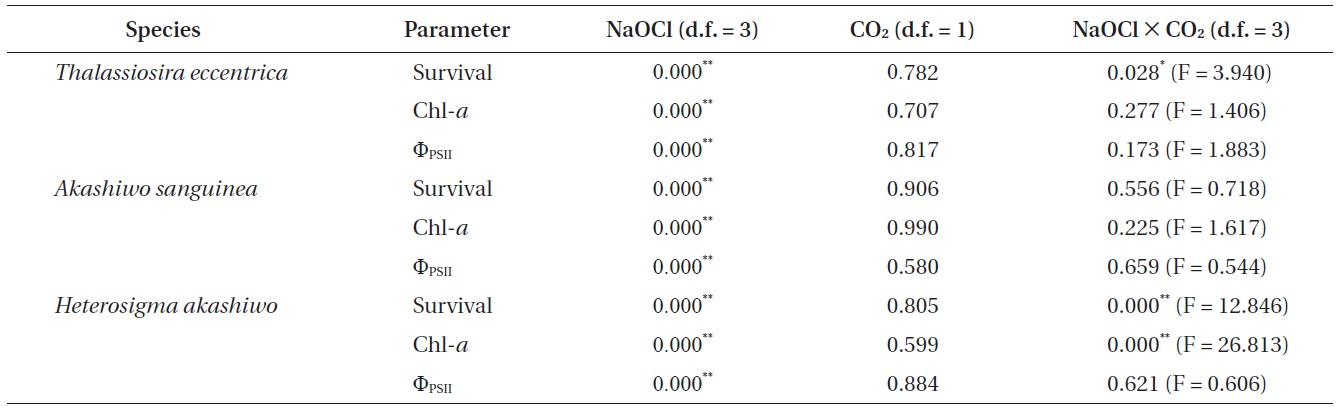
The results of the General Linear Model or two-way ANOVA for determining the effects of NaOCl and CO2 level, both alone, and in combination on survival, chlorophyll a (Chl-a), and effective quantum yield (ΦPSII)
Our study provides the first insight into the effect of elevated CO2 on NaOCl toxicity in marine phytoplankton. Despite the importance of the chemical interaction between NaOCl and CO2, their synergistic effect on marine organisms remains to be assessed. The 1-h LC50 values for
Growth and photosynthesis of marine phytoplankton usually increase with increasing CO2 (Schippers et al. 2004, Gao et al. 2012
NaOCl in water is converted to NaCl over time in sunlight and particularly by UV radiation. However, longterm exposure to NaOCl has significant adverse impacts on marine organisms at any concentration (Rajamohan et al. 2007, Anasco et al. 2008). For example, previous studies have reported that TRC concentrations from NaOCl of 30 to 106 ppb will kill 50% of the exposed individuals in seven dinoflagellate species (
We used ΦPSII as an indicator of phytoplankton health, as it is a rapid and immediate measure of photosynthetic capacity, regardless of cell density and size. There was a discrepancy between the survival (%) and ΦPSII measurements of NaOCl effects. An 8-h exposure to the lowest NaOCl concentrations caused a significant reduction in survival (%) of
Chl-
Our study has demonstrated that NaOCl and elevated CO2 act synergistically to reduce survival and Chl-