A general purpose aircraft mission performance analysis program has been developed. The program can be used in design mode or in analysis mode. Fuel weight for a given mission profile can be estimated when the design mode is chosen, while mission time or mission range for a given fuel can be estimated when the analysis mode is chosen. The mission analysis program is written with JAVA and includes GUI(Graphic User Interface) for users’ conveniences. With a proper combination of databases for propulsion, aerodynamics and weight, the program can be configured to compute the performance of any type of aircraft. The program is validated by comparing its results with the results of a well known performance analysis program by ADD(Agency for Defense Development)
CD Drag coefficient
CL Lift coefficient
CLmax Maximum lift coefficient
M Mach number
p Pressure
Pset Power setting
T Net thrust
V Airspeed
W Aircraft weight
a Speed of sound
g Gravitational acceleration
x Range
△CD Delta drag coefficient
α Angle of attack
ρ Density
μ Viscosity
θ Pitch angle
As all other machines, in-flight performance of an airplane is one of the key factors to determine whether the airplane is worth buying over other airplanes. Many aspects of in-flight performance can be addressed. While point performance deals with the airplanes ability to fly at a specific point in flight, mission performance deals with the overall performance throughout the entire flight. With the mission performance analysis, engineers can determine the fuel required for a given flight mission with a specific payload. The mission performance analysis, therefore, is necessary to compute not only the design fuel weight for aircraft design, but also the fuel weight for a commercial flight. The mission performance analysis, therefore, must be done by aircraft manufacturers as well as aviation companies.
Mission performance analysis programs have been developed by research institutes, and aircraft developers. Program NSEG is a rapid mission analysis code based on the use of approximate flight path equations of motion[1]. It was originally developed by U.S. Air Force Aeronautical System Division of Wright-Patterson Air-Force Base. Equations vary with the segment types; accelerations, climbs, cruises, descents, and deceleration. DARcorperation developed APP(Aircraft Performance Program) for aircraft performance analysis which is used as a performance module for the company’s aircraft design program, AAA(Advanced Aircraft Analysis)[2]. RDSprofessional and RDS-student were developed and maintained by Conceptual Research Corporation[3]. They also have a common mission performance analysis module inside. The inhouse aircraft synthesis tool developed by Lockheed Martin is called the Adaptable Design Synthesis Tool(ADST)[4]. In this code, the aircraft design is perturbed by changing the wing geometric parameters from the baseline, and the aircraft is then fuel sized to meet the design mission. ADST equips with a performance module called MAPS(Mission Analysis and Performance System).
Most of the performance analysis programs and the design codes, however, were written with high level programming languages, which means they are highly machine-dependent. A mission performance analysis program called IMAP(Interactive Mission Performance Analysis Program) is developed with JAVA programming language. Java is a general-purpose, concurrent, class-based, object-oriented computer programming language that is specifically designed such that WORA(write once, run anywhere) is possible. WORA means that a code which operates on one platform does not need to be recompiled to run on another. JAVA programs are complied to bytecode that can run on any JAVA virtual machine regardless of computer architecture[5]. GUI(Graphic User Interface) is developed along with the program, so that users can use IMAP easily. Furthermore, IMAP is designed to be general-purpose. With a proper combination of aerodynamics, propulsion, and weight databases, it can be used from low-speed propeller driven aircraft to high-speed jet propelled aircraft.
The objective of the paper is to introduce the outline of IMAP, and to show its validity and its usefulness. To this end, we will first discuss the structure of IMAP, the databases needed to run the program, namely atmospheric database, aerodynamic database, weight database, and propulsion database. We will describe equations of motion for each mission segment and the numerical methods used in the program. Next, we will present three examples to demonstrate the validity and the usefulness of IMAP. Finally, we will summarize our work, and describe future research plans.
As stated in the introduction, IMAP is written in JAVA so that it can run on any operating system. User interface with JAVA graphic library is also included in IMAP for user conveniences. One of features IMAP has is that users have freedom to generate a mission profile by sequencing mission segments in order. The mission segments can be specified as outbound(increasing range), or inbound(decreasing range). Also, the users can designate some of the segments as reserve. During the reserve segments, the aircraft weight decreases while the mission range or the mission time does not increase.
IMAP can be used either design mode or analysis mode. With the design mode, the mission fuel weight can be computed for a given mission profile. With the analysis mode, on the other hand, the users are allowed to specify one or two mission parameters as unknowns. The unknown parameters are determined in order to use the fuel completely at the end of the mission. For example, the cruise range or the loiter time can be set as an unknown for a given fuel. If both the cruise range and the loiter time are to be determined, the user should specify the time or the position of the aircraft at the end of the mission.
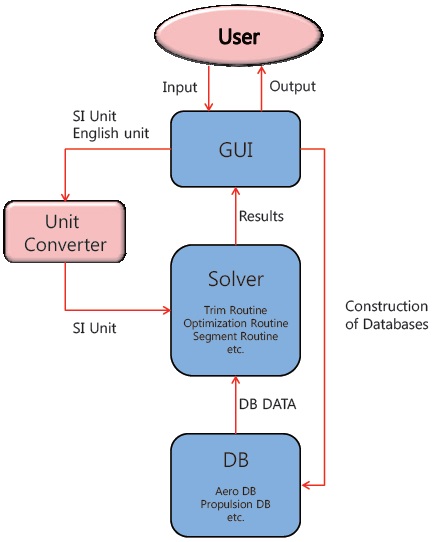
Figure 1 depicts the structure of IMAP. The users use GUI to input the mission profile, and to construct databases for an aircraft. The input data is then converted to SI unit via unit converter, and stored for later use. The solver consists of trim routine, optimization routine, segment analysis routine, and root finding routine. The databases that IMAP uses are atmospheric database, aerodynamic database, weight database, and propulsion database. The database can be generated by IMAP, text editors, or spreadsheet programs. Once the databases are set up, IMAP loads the database from files whose names are specified by the users.
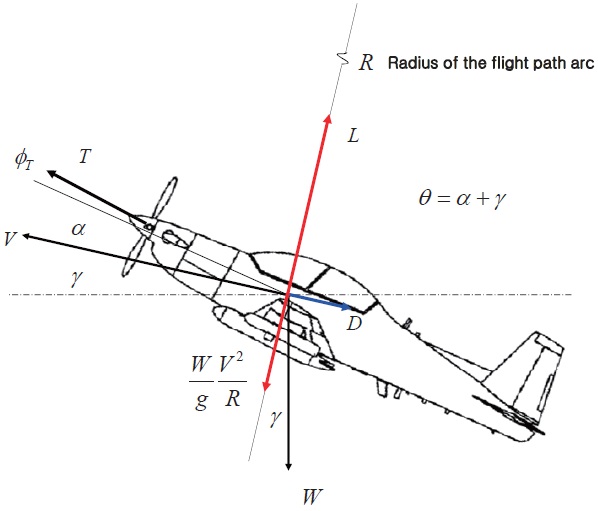
Figure 2 depicts the free body diagram of an aircraft. It is
assumed that the pitching moment acting on the aircraft is trimmed with horizontal trim devices. It is equivalent to assume that the aircraft is modeled as a point-mass for the performance evaluation. As a consequence, the user should use the trimmed aerodynamic data. The equations of motion for the aircraft in the stability axis can be found,
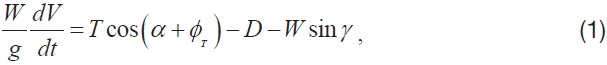
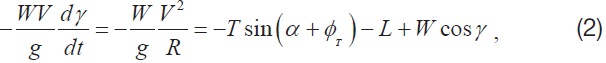
where

where
Forces acting on the aircraft must be trimmed for all steady flights. The trim condition can be determined from the following equations, which are derived from equations (1) and (2)


where
angle of attack and the power setting are the parameters to be determined from Eq. (4) and (5) with
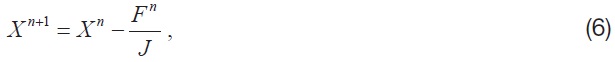
where
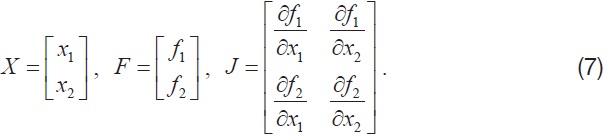
The derivatives are computed using the Newton quotient,
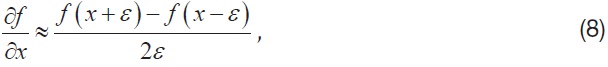
where
From Eq. (1), (2), the equations of motion for the acceleration segment can be found,
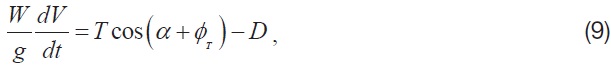

From Eq. (10), the angle of attack can be found with a full throttle. The Euler explicit time integration method, then, is used to integrate Eq. (9) to obtain the time histories.
BFGS(Broyden-Fletcher-Goldfarb-Shanno) method[6] is adopted for segment optimization. The BFGS method belongs to a class of quasi-Newton methods. In the quasi-Newton methods, the Hessian matrix of second derivatives does not need to be evaluated directly. Instead, the Hessian matrix is approximated using rank-one updates specified by gradient evaluations. The quasi-Newton methods are a generalization of the secant method to find the root of the first derivative for multidimensional problems. The BFGS method is one of the most popular methods for non-constrained optimization problems. Fibonacci search[7] is used as a one-dimensional search algorithm in conjunction with the BFGS method.
2.5. Mission Profile and Mission Segments
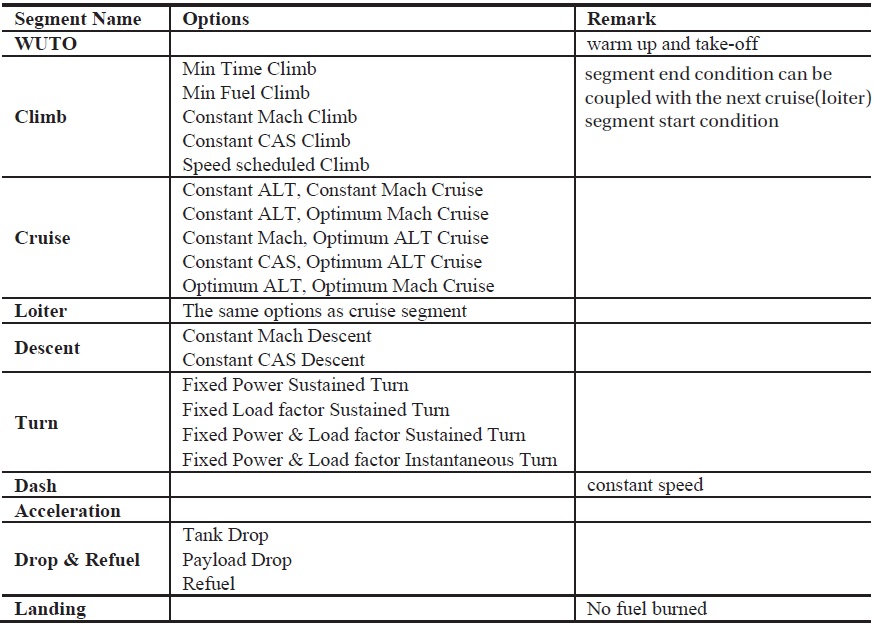
Mission profile is defined as an idealized diagram that describes the mission of the aircraft from take-off to landing. The purpose of the mission performance analysis is to determine the fuel required to complete the mission. The mission profile, therefore, is divided into number of mission segments, or mission legs. The mission segment can be modeled in terms of the states and control variables as function of time. Table 1 summarizes the types of mission segments with which the users can model the mission profile. Fuel consumption during landing is ignored because it is small compared to other flight phases.
2.5.1. WUTO(Warm-up and Take-off)
The fuel burned during the warm-up is computed from the power setting and the warm-up time that the users specify. The take-off is modeled as aircraft accelerating to a take-off speed at a fixed angle of attack. The aero database for the WUTO segment should include the ground effects as well as landing gears and flaps.
2.5.2. Climb
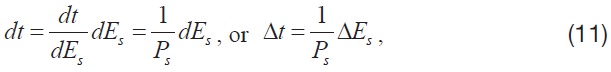
The minimum time climb schedule gives a path defined by altitude and Mach number for transitioning from one level of energy to a higher level of energy in the shortest time. The time required to climb can be written as
[Table 1.] Mission segment types

Mission segment types
where the specific excess power and the energy height are defined by
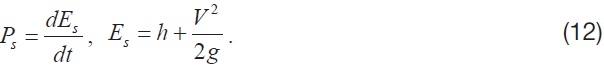
In order to climb in the shortest time, therefore, we can choose the climb condition where the specific excess power is the maximum at a constant energy height.
The weight change during the climb can be written as
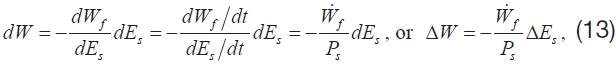
where
If a climb segment is followed by a cruise segment or a loiter segment, the user can couple the climb segment with the next cruise segment or loiter segment. The final altitude of the cruise segment is determined iteratively such that the next cruise segment or loiter segment is optimal in terms of the range or the loiter time.
2.5.3. Cruise and Loiter
The distance during the cruise can be written as a function of weight as
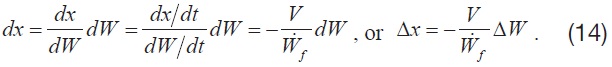
Here, it is assumed that the wind speed is zero. To maximize the range, therefore, we need to follow the flight path along which
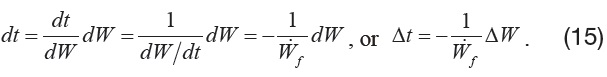
The flight condition for the optimum loiter time can be computed by maximizing 1/
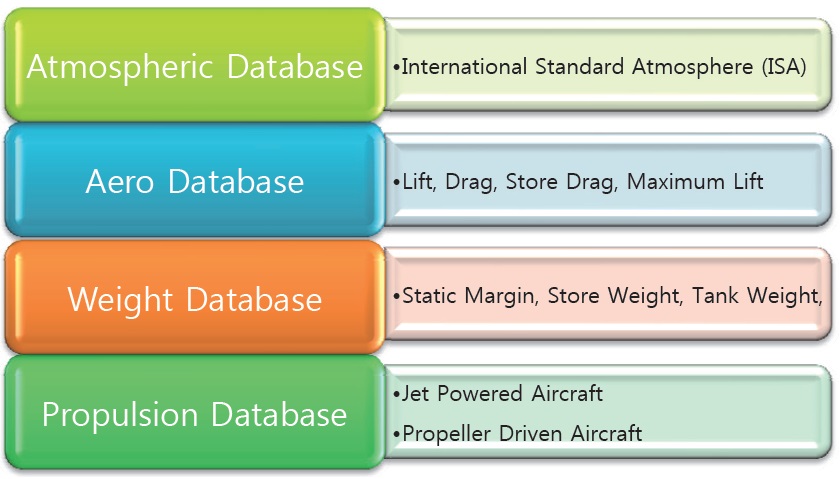
To use IMAP, the users should supply 4 databases, namely the atmospheric database, the aerodynamic database, the weight database, and the propulsion database. Figure 3 describes the details of the databases. The atmospheric properties are computed using ISA(International Standard Atmosphere) model. According to ISA model, density, speed of sound, viscosity and pressure are functions of the altitude and the deviation temperature from ISA condition, that is

where △
As stated in the previous section, IMAP uses the trimmed aerodynamic data, so that the aero database contains the lift and the drag coefficients as functions of static margin, and configurations of the aircraft. The aero database also includes the delta drag due to external stores, the maximum lift coefficient. The basic aero database is given in the form of


where
delta drag due to stores is a function of the store index,


The net thrust and the fuel flow rate for a jet engine are provided as following,


The shaft horse power, and the fuel flow rate for a propeller driven aircraft are given by


The weight database consists of the static margin, the store weight,


To demonstrate the validity and the usefulness of IMAP, three exemplary mission analyses involving two types of aircraft are presented. The results of IMAP are compared with the results of a well-known mission performance analysis program, AMAP(ADD Mission Performance Analysis Program)
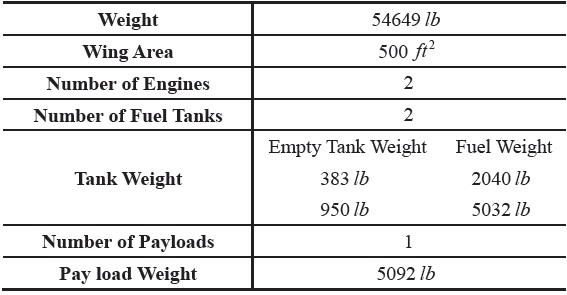
[Table 2.] Specifications of Jet Powered Aircraft

Specifications of Jet Powered Aircraft
[8] for comparison and validation. Examples are analyzed with both IMAP and AMAP using the analysis mode. In addition, IMAP is run with the initial and final conditions of all segments taken from the results of AMAP. Therefore, the computational methods used for mission segment analysis can be validated. The result with the analysis mode can validate IMAP for integrating segments.
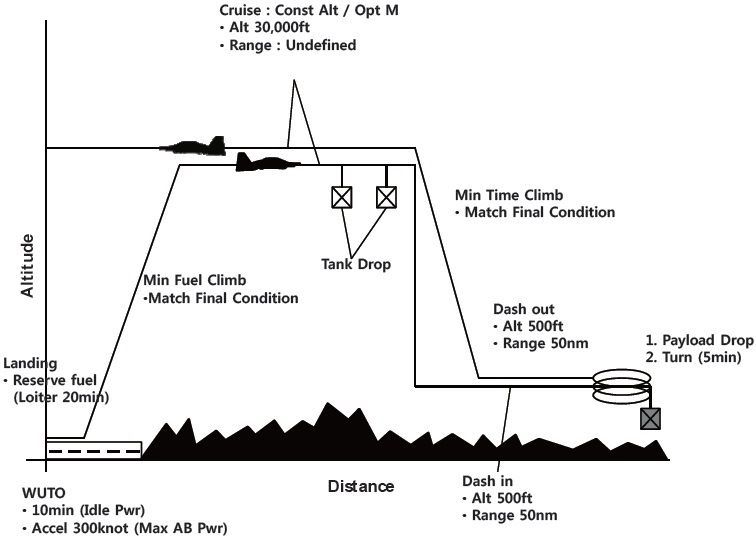
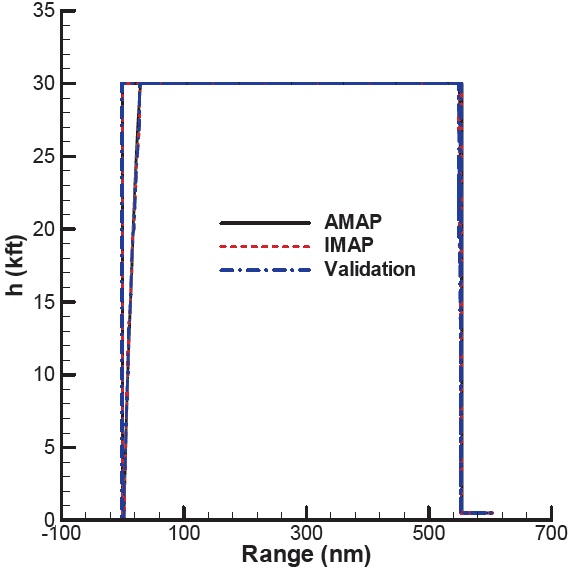
The first example is a Hi-Lo-Lo-Hi strike mission of a jet powered aircraft. The mission consists of a high altitude cruise, low altitude dash-in, weight drop, low altitude dashout, and high altitude cruise. Here, the total mission radius is
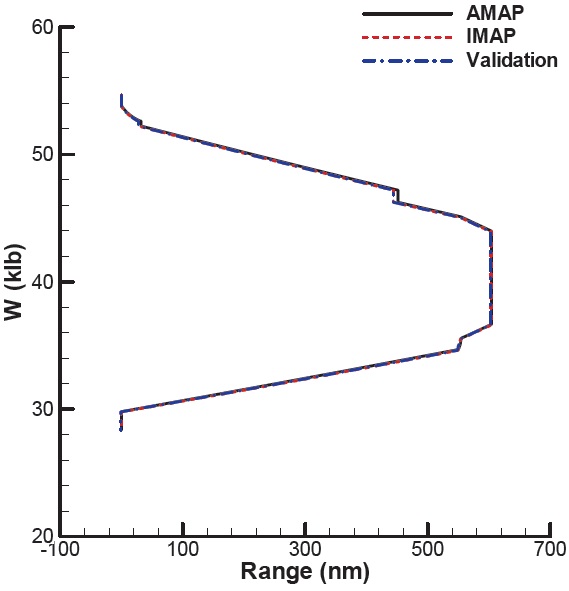
an unknown, and is to be determined from the total fuel. The details of the segments are presented in Fig. 4. The detailed descriptions of the aircraft including the weight of fuel tanks are listed in Table 2. The drag decrease and the weight decrease due to the tank release are included in the computation. Figures 5 and 6 present the two analysis results of IMAP. Figure 5 presents the results in terms of range and altitude, while Fig. 6 the results in terms of range and weight (wedge plot). The result of AMAP is also presented for comparison. As stated earlier, the initial and final conditions for the validation case are taken from s of AMAP. Three results match well each other, indicating IMAP is accurate.
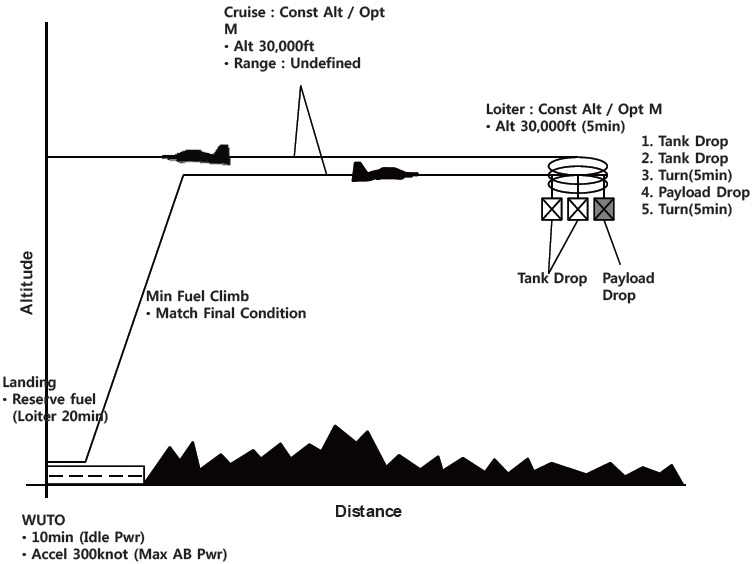
The mission profile of the second example is depicted in Fig. 7.
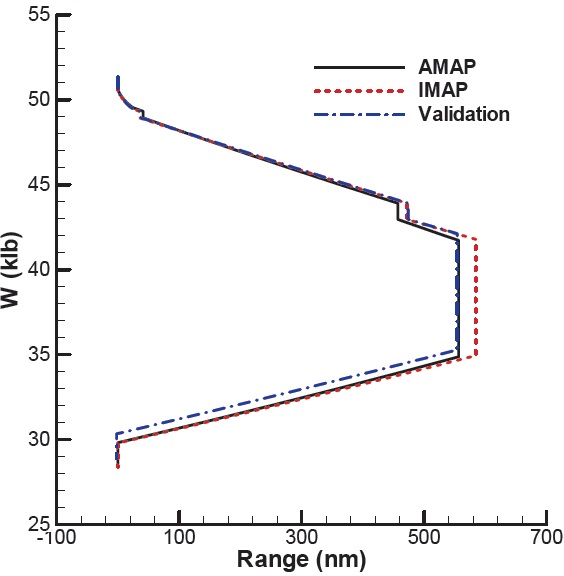
The mission comprises an outbound cruise, weight drop, and inbound cruise besides take-off and landing (Hi-Hi-Hi Attack). The same aircraft as the first example is used for the second example. The mission radius is going to be determined from the total fuel. Figure 8 and 9 summarize the mission analysis results. Figures show the validation result matches well with the results of AMAP, which indicates that the numerical methods used to solve the segments are correct. The mission range obtained with IMAP, however, is wider than that with AMAP. In addition, the wedge plot obtained with IMAP differs from that with AMAP. The reason for this discrepancy can be understood from Fig. 10. Figure 10 presents the optimization results of four segments for the mission profile with two programs.
must be maximal along the climb schedule. For the outbound and inbound cruise segments, on the other hand,
3.2. Propeller Driven Aircraft
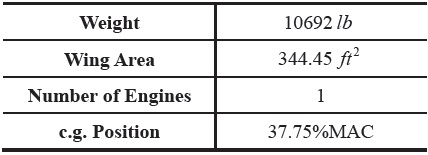
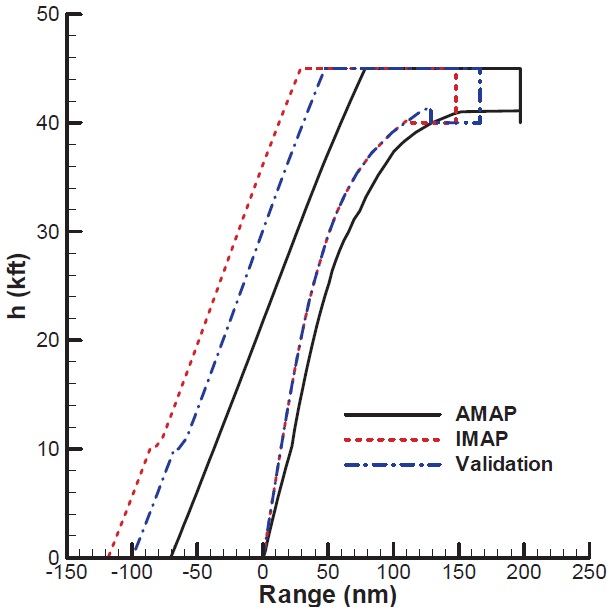
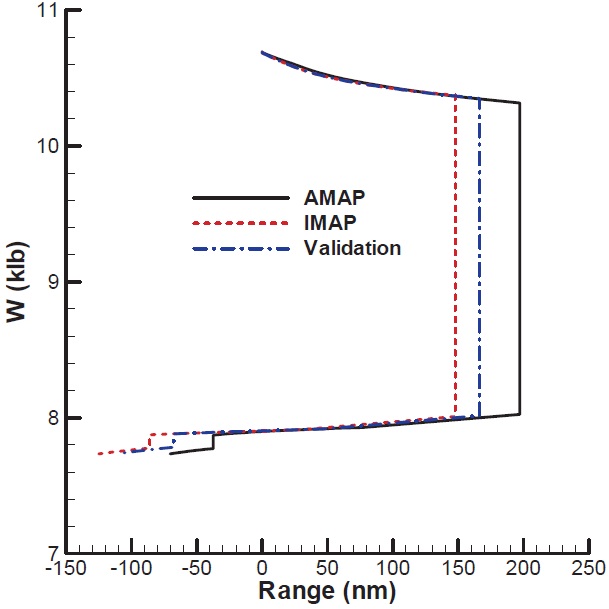
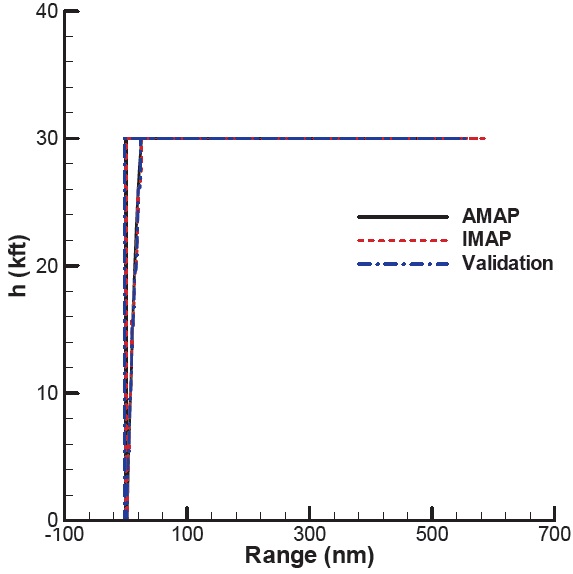
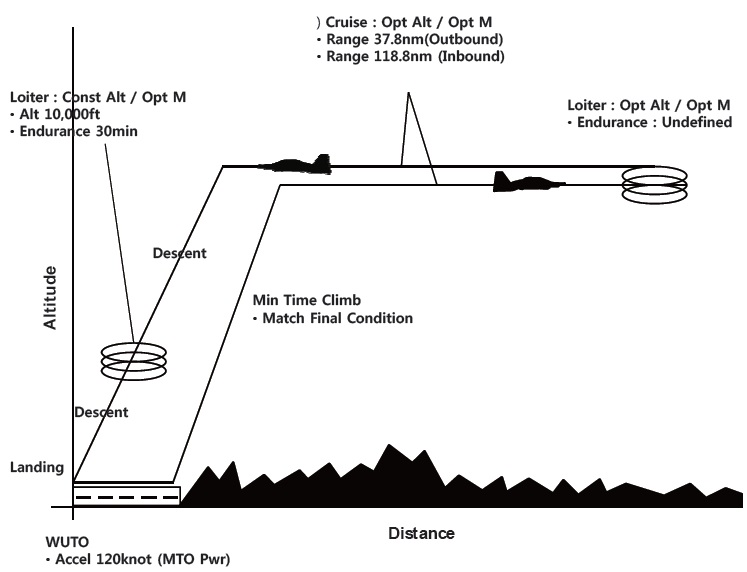
The mission profile of the final example is presented in Fig. 11. The aircraft used in this example is a propeller driven aircraft.
The mission starts with WUTO, is followed by a min time climb, fixed range outbound cruise, loiter, fixed range inbound cruise, and landing. In this example, the loiter time is to be determined from the given fuel. Furthermore, the final altitude of the min time climb segment is chosen such that the next cruise altitude is optimal. The specifications of the aircraft are summarized in Table 3. As before, the validation result is also presented for comparison. Unlike IMAP and AMAP cases, the initial climb segment for the validation is not linked to the next cruise segment. Moreover, the endurance for the validation is set with the result of AMAP.
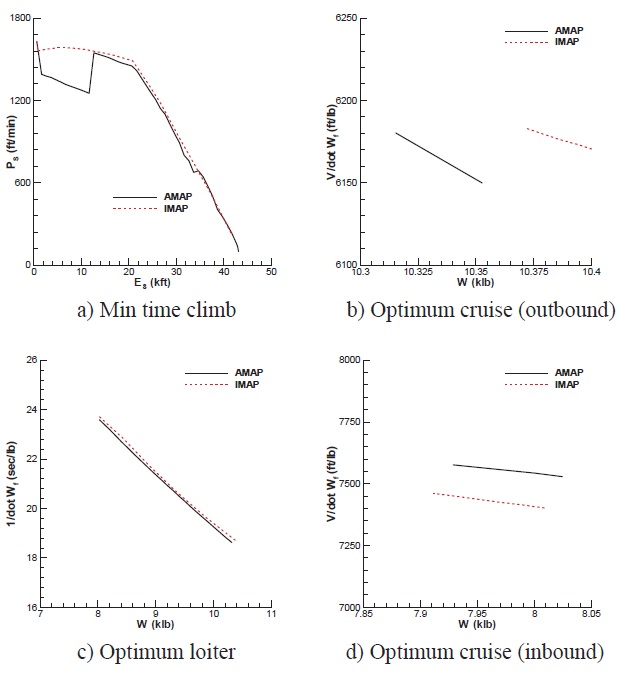
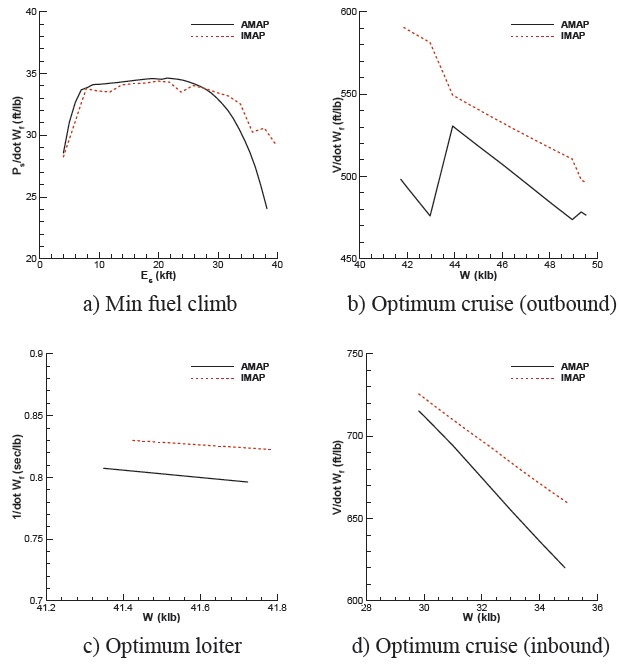
Figure 12 and 13 present the analysis results with IMAP and AMAP. The results with IMAP show the discrepancy with those of AMAP as well as the validation. Also, the difference occurred during the climb is maintained for the rest of the mission. IMAP finds the optimal cruise altitude of the outbound cruise segment lower than AMAP does. According the results of the validation case, the aircraft lowers its altitude after the min time climb in order to meet the optimal condition of the next cruise segment. The difference in the final altitude of the initial climb persists throughout the rest of the mission. In Fig. 14, the optimization results of four segments in regard to the mission are presented. The specific excess power with IMAP is higher than that with AMAP. As a result of higher climb rate, the distance for the climb segment is shorter. The difference in this segment persists over
[Table 3.] Specifications of Propeller Driven Aircraft

Specifications of Propeller Driven Aircraft
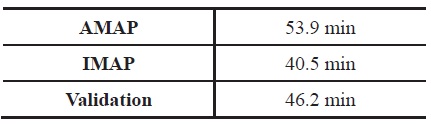
the rest of the mission. Table 4 summarizes the elapsed times calculated from two programs during the climb segment. The table also confirms that IMAP finds the shortest climb schedule. The value of 1/
the second examples, the differences in the results of IMAP and AMAP for the third example come from the optimization results. Therefore, it is safe to say that the differences in the results of the analysis come from the differences in optimization methods for the two programs.
4. Summary and Concluding Remarks
In this paper, an aircraft mission performance analysis program called IMAP was developed. IMAP was written in JAVA so that it is machine-independent. Also, a graphic user interface was developed with IMAP for users’ conveniences. IMAP can estimate fuel required for a given mission profile, or compute mission time or mission radius for a given fuel. Three exemplary mission analyses were chosen to demonstrate IMAP’s accuracy, efficiency and usefulness. IMAP is now being upgraded to include the point performance analysis capability. It is intended to further expand IMAP’s capability to include the
[Table 4.] Times Elapsed during Min Time Climb

Times Elapsed during Min Time Climb
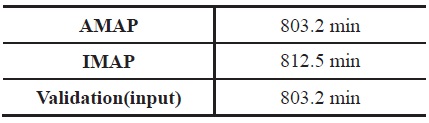
[Table 5.] Optimum Loiter Times

Optimum Loiter Times
aircraft synthesis in near future.