The semiannual variation of geomagnetic activity where the geomagnetic activity is stronger in spring and fall with a semiannual cycle has generally been explained by the axial hypothesis, equinoctial hypothesis, and Russell-McPherron Effect (RMP effect).
Svalgaard et al. (2002) and Cliver et al. (2004) summarized the three major hypotheses as follows. The axial hypothesis (Cortie 1912, Bohlin 1977) explains that the semiannual variation is basically induced by the change in the Earth’s heliographical latitude and the geomagnetic activity maxima occur in early March and September due to the inclination of solar equatorial plane relative to the ecliptic plane (7°). The equinoctial hypothesis (Bartels 1925, Chapman & Bartels 1940, Svalgaard 1977) explains that the geomagnetic activity maxima occur because the angle between the Earth’s dipole and solar wind flow direction has the maximum value of 90° near the spring and autumnal equinoxes due to the changes in the inclination of Earth’s equatorial plane relative to the ecliptic plane (~23°) and the offset between the Earth’s rotation axis and dipole (~11°) (Svalgaard et al. 2002). Lastly, the Russell and McPherron Effect (Russell & McPherron 1973) explains that the geomagnetic activity maxima occur because the southward component of magnetic field has the maximum value for GSM coordinate system in early April and October on the solar equatorial plane due to the changes in the angle between the solar equatorial plane and Earth’s equatorial plan and the angle between the rotation axis and dipole influenced by the Earth’s revolution.
The hypothesis for the semiannual variation of geomagnetic activity started from the axial theory and has been gradually developed to the equinoctial theory and RMP effect. The major hypotheses are challenged by the studies on the semiannual variation of geomagnetic activity using various geomagnetic activity indices (Cliver et al. 2000, Svalgaard et al. 2002, Ahn & Moon 2003). On the other hand, Mursula et al. (2011) recently suggested that the semiannual variation of geomagnetic activity is caused by the 22-year cycle variation of solar wind related with the Earth’s heliographic latitude. They also explained that the observed semiannual variation has been significantly overestimated and is an artifact of 22-year cycle variation. However, in the study using aa index, Svalgaard (2011) refuted that the semiannual variation of geomagnetic activity is not an artifact, is not overestimated, and does not require reconstruction. Meanwhile, unlike other previous studies, Oh & Yi (2011) analyzed the dependence of semiannual variation of geomagnetic activity on the solar magnetic polarity. Based on Russell and McPherron Effect (Russell & McPherron 1973), the Fig. 4 in Oh & Yi (2011) explains favorable magnetic field condition for geomagnetic activity at the spring equinox or autumnal equinox positions depending on solar magnetic polarity. In other words, the geomagnetic activity is stronger at the autumnal equinox when the solar magnetic field is anti-parallel to the geomagnetic field, and the geomagnetic activity is stronger near the spring equinox when the solar magnetic field is parallel to the geomagnetic field. To verify this model, Oh & Yi (2011) analyzed the occurrence of geomagnetic storm which is defined by the Dst index for minima during 1962-1998, but the difference of geomagnetic activity depending on solar magnetic polarity was not observed near the spring and autumnal equinoxes.
As the magnitude and occurrence of geomagnetic storm is determined by the solar activity, for understanding the tendency of geomagnetic activity depending on fundamental solar magnetic field environment, it is necessary to analyze the quiet time geomagnetic activity excluding the geomagnetic storm. Therefore, this study examined the solar magnetic polarity dependence of semiannual variation of quiet time geomagnetic activity excluding the geomagnetic storm. The Dst index values near the solar minima from 1957 were analyzed considering the solar magnetic polarity. And using the Dxt index reconstructed by Karinen & Mursula (2005) and Dcx index reconstructed by Mursula & Karinen (2005), the average values during the 3-year period near the solar minima were analyzed regarding the 8 solar cycles from 1932.
The Dst index is the most frequently used geomagnetic index, and is calculated by monitoring the strength and variation with time of geomagnetic storm, especially the ring current. It is calculated as a 1-hour average value of horizontal magnetic component disturbance observed from the 4 low-latitude stations (Hermanus, HER; Honolulu, HON; Kakika, KAK; San Juan, SJG) which are spaced relatively regularly at longitude. High-energy cations produced during the geomagnetic storm drift westward and generate a westward flowing current, and thus a major disturbance has a negative Dst index value. The contribution to the Dst index from other magnetospheric current systems as well as the ring current varies depending on the phase of geomagnetic storm. It is known that the ring current itself is not isotropic, and is asymmetrical depending on the local time which consists of numerous limited longitude/local time zones (Lui et al. 1987). Therefore, the local disturbances have fairly different values when observed from different Dst stations located at different longitude/local time zones.
The Dst index is provided by the World Data Center WDC-C2 in Kyoto, Japan. They only provide the global Dst index which is the average of local Dst indices observed from the 4 Dst stations. Karinen & Mursula (2005) reconstructed the Dst index using the original Dst derivation method (Sugiura 1964, 1969, Sugiura & Kamei 1991), and the reconstructed Dst index was named as Dxt index. The Dxt index shows a good correlation (98.7%) with the Dst index. Though they have a good correlation, the Dxt index corrects the error that is included in the original Dst index. For example, every annual average of Dxt index has a negative value, but the annual average of Dst index in 1965 has a positive value. Using the data from the Cape Town (CTO) station which is the former HER station, the Dxt index was calculated from 1932 by extending the data to include 25 more years than the original Dst index. In addition, other indices were calculated using the different treatment of quiet daily curve. The Dst index shows a large semiannual variation that is not related with the geomagnetic storm (Cliver et al. 2001). This non-storm component originates from the seasonal variation of quiet-time magnetic field. The Dst index which is corrected using the quiet-day curve is called Dcx index (Mursula & Karinen 2005). Compared to the Dst/Dxt indices, the Dcx index has a better correlation with other solar and geomagnetic activity indices (Karinen & Mursula 2006). The University of Oulu operates the Dcx Index Server (http://dcx.oulu.fi/) and provides the definite, provisional, and real-time indices.
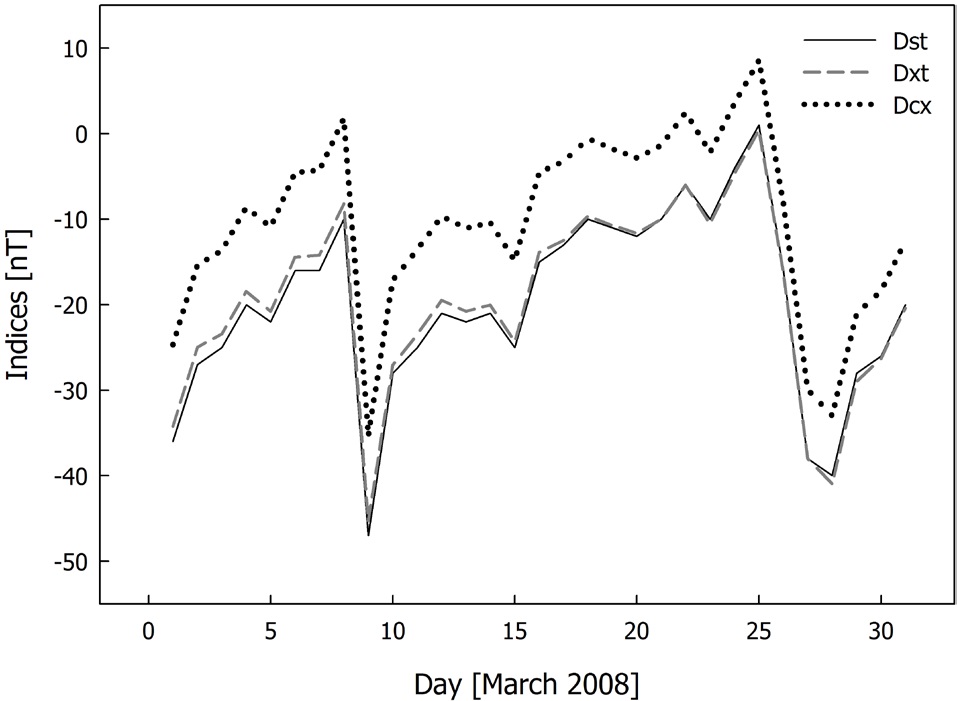
In this study, the hourly Dst index (Kyoto World Data Center WDC-C2; http://wdc.kugi.kyoto-u.ac.jp/wdc/Sec3.html) from 1957 was used. And for the data from the 4 reference stations (traditional station, HER/CTO, HON, KAK, and SJG), the definite indices of Dxt and Dcx were
[Table 1.] Minimum value of magnetic indices at equinoxes in anti-parallel and parallel periods.
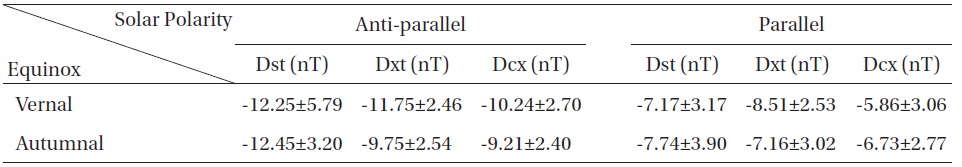
Minimum value of magnetic indices at equinoxes in anti-parallel and parallel periods.
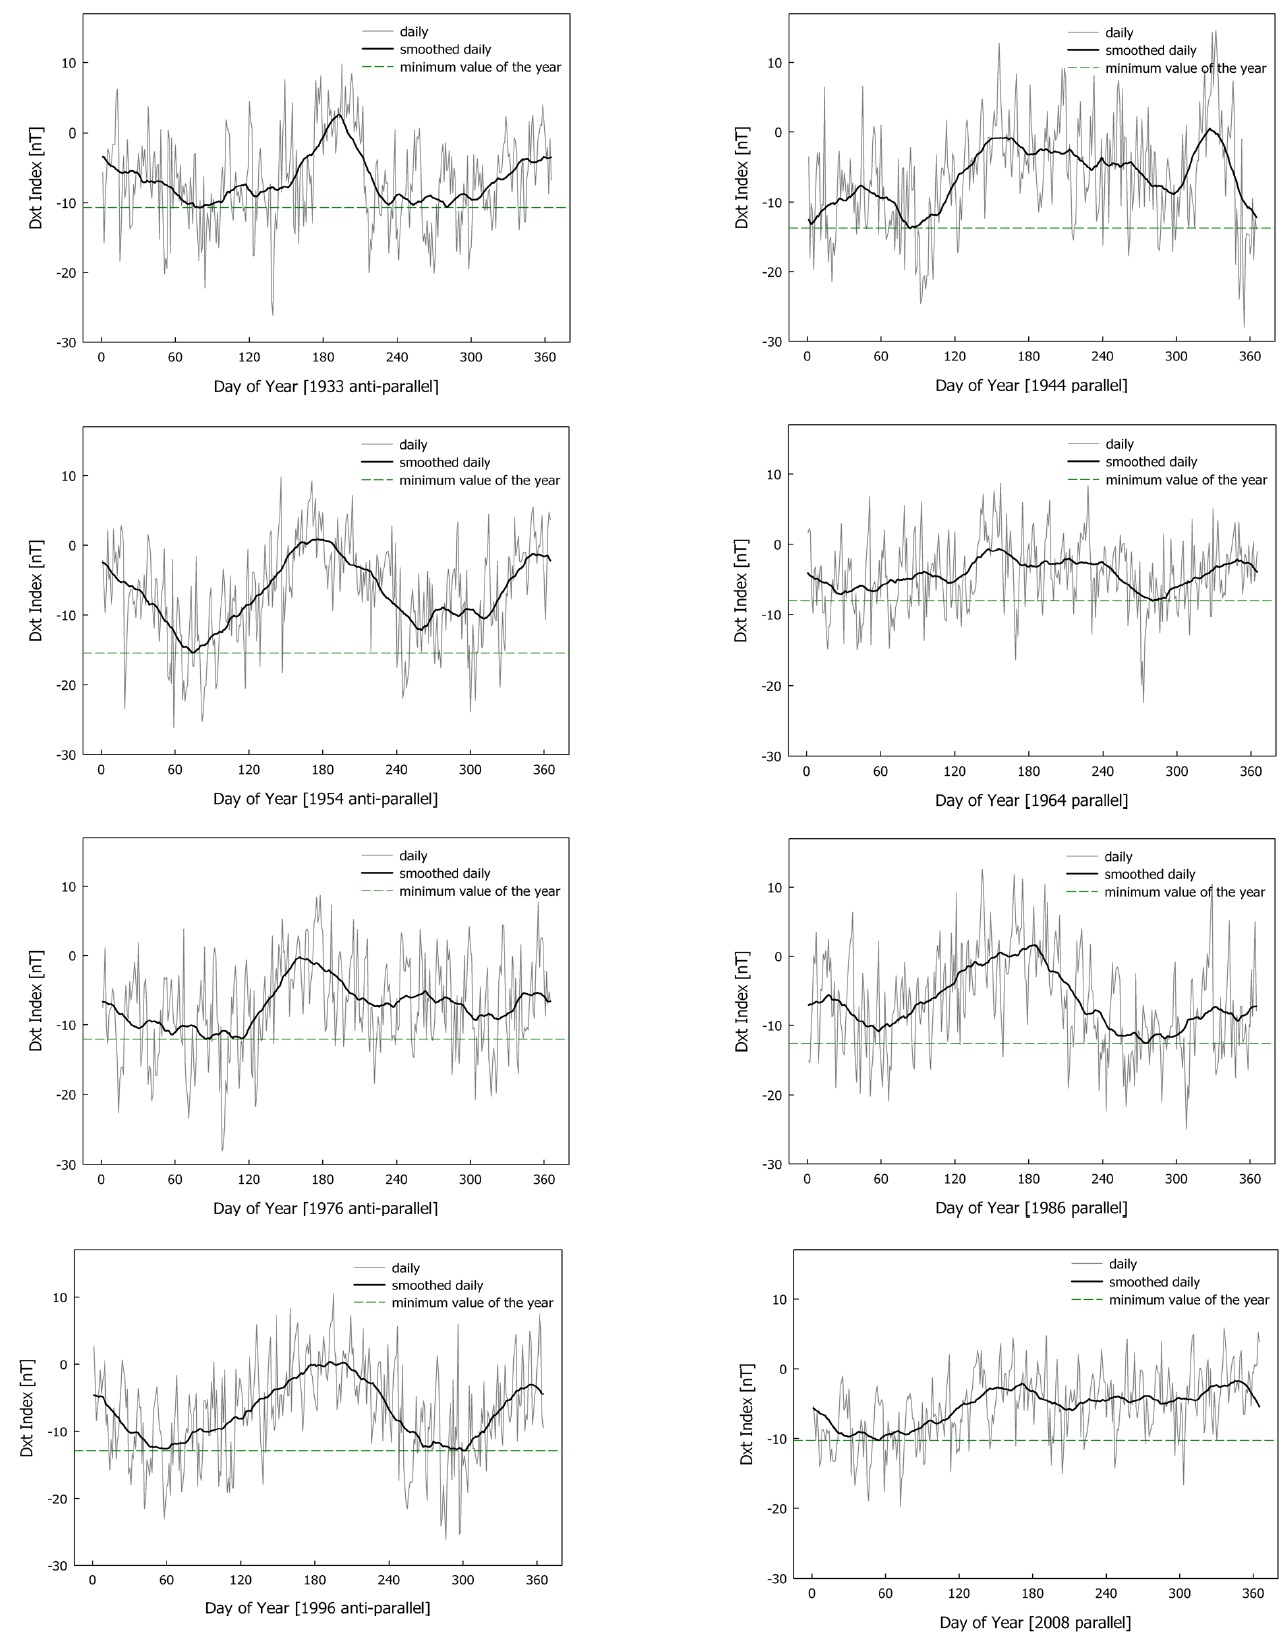
used from 1932 to 2009, and the provisional indices were used after 2009. Fig. 1 compares the Dst, Dxt, and Dcx indices used in this study. The Dst index and Dxt index are almost similar, but the Dcx index has more positive (+) values. However, the three indices have the same trend of variation. Accordingly, the analysis was focused on the Dxt index as the Dxt index has a longer observation period than the Dst index. The daily average index values during the 3-year period (i.e., the year that the solar minima occurred, the year before, and the year after) near the solar minima regarding the 8 solar cycles from 1932 were used. Generally, among the magnitudes of geomagnetic storm, the smallest magnitude is “weak” which has the Dst index range of -30 to -50 (Gonzalez et al. 1994, Oh & Yi 2004). Based on this criterion, the days with the index value of less than -30 were excluded to rule out the effect of geomagnetic storm. Depending on solar magnetic polarity, they were divided into two groups, parallel and anti-parallel. The former represents the period when the solar magnetic polarity is parallel with the geomagnetic polarity (solar minima: 1944, 1964, 1986, and 2008), and the solar magnetic polarity is expressed as - (negative, toward) with respect to the northern hemisphere. And the latter represents the period when the solar magnetic polarity is anti-parallel with the geomagnetic polarity (solar minima: 1933, 1954, 1976, and 1996), and the solar magnetic polarity is expressed as + (positive, away).
In Fig. 2, the left side shows the average Dxt daily profiles during the 3-year period near the solar minima year (1933, 1954, 1976, and 1996) when the solar magnetic polarity is anti-parallel, and the right side shows the average Dxt daily profiles during the 3-year period near the solar minima year (1944, 1964, 1986, and 2008) when the solar magnetic polarity is parallel. The negative exponential (
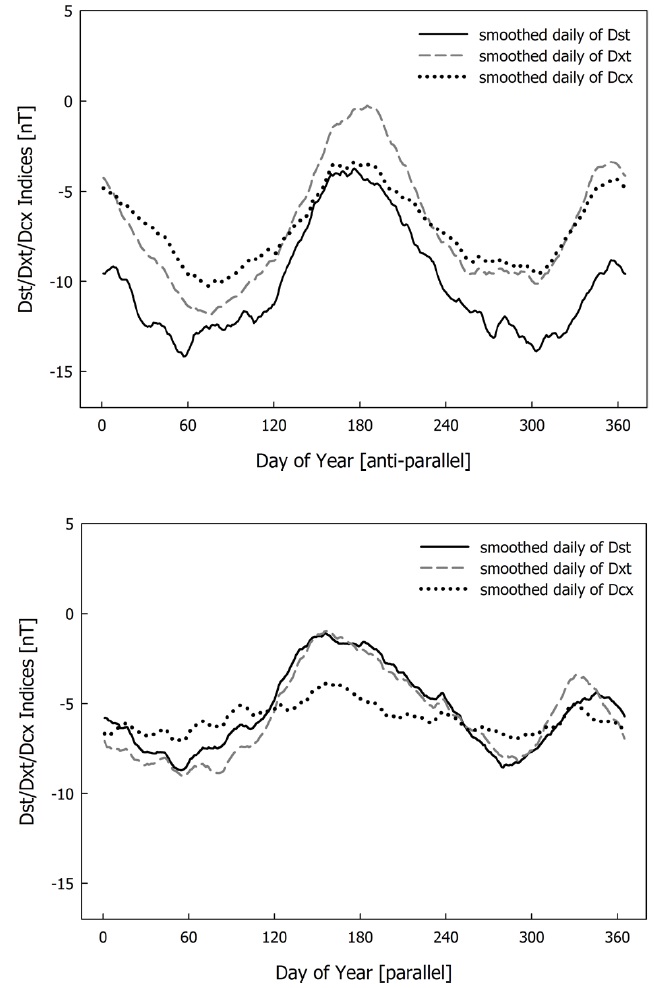
Table 1 summarizes the average value and standard deviation during 27 days with respect to the spring and autumnal equinoxes (March 20 and September 23) for the daily values of geomagnetic indices which averaged the entire 3-year period near the minima year during the quiet time geomagnetic activity for each solar polarity. According to Table 1, the magnitude of geomagnetic activity is larger when the solar magnetic polarity is anti-parallel. The difference of geomagnetic activity between the spring and autumnal equinoxes depending on solar polarity appears indistinct. Even though there is difference between the spring and autumnal equinoxes, the difference is smaller than the standard deviation, which is not statistically meaningful. For the Dst, Dxt, and Dcx indices, the daily
values which averaged every minima year corresponding to each solar polarity were smoothed, and the result is shown in Fig. 3. The semiannual variation was distinct for the Dst and Dxt indices, but the semiannual variation was weak for the Dcx index. In especial, the semiannual variation was nearly absent for the Dcx index when the solar polarity is parallel. The weak semiannual variation of Dcx index is thought to be because the Dcx index itself was corrected for the seasonal variationannual variation of geomagnetic activity is stronger and more distinct when the solar magnetic polarity is anti-parallel as shown in Table 1. In other words, with a 22-year cycle, the geomagnetic activity is stronger when the solar magnetic field is anti-parallel to the geomagnetic field, and the geomagnetic activity is weaker when it is parallel. However, the difference of quiet time geomagnetic activity between the spring and autumnal equinoxes depending on solar polarity was not found.
In this study, to investigate the solar magnetic polarity dependence of semiannual variation of quiet time geomagnetic activity excluding the geomagnetic storm which was suggested by Oh & Yi (2011), the average values during the 3-year period near the solar minima were analyzed regarding the 8 solar cycles using the Dst index value near the solar minima from 1957, the Dxt index near the solar minima from 1932 (Karinen & Mursula 2005), and the Dcx index (Mursula & Karinen 2005). The difference of geomagnetic activity between the spring and autumnal equinoxes depending on solar polarity (anti-parallel and parallel) was analyzed after removing the effect of geomagnetic storm by excluding the days with the index value of less than -30. The result of analysis can be summarized as follows. First, the geomagnetic activity changes with a 22-year cycle depending on solar polarity. In other words, the geomagnetic activity was stronger throughout the period when the solar magnetic field is anti-parallel to the geomagnetic field compared to when it is parallel. Second, during the period when the solar magnetic field is anti-parallel to the geomagnetic field, the geomagnetic activity maximum occurs at the phase near the spring and autumnal equinoxes, which shows distinct semiannual variation of geomagnetic activity. Third, depending on solar polarity, the geomagnetic activity seems to be stronger near the autumnal equinox when it is anti-parallel, and near the spring equinox when it is parallel, but the difference is not statistically meaningful. In other words, the difference of quiet time geomagnetic activity between the spring and autumnal equinoxes does not largely depend on solar polarity similar to the irrelevance of geomagnetic storm which was demonstrated by the result of Oh & Yi (2011).