We statistically investigated the properties of low-latitude Pi2 pulsations using Bohyun (BOH, Mlat = 29.8°, L = 1.35) ground magnetometer data in 2008. For this 1-year interval, 582 Pi2 events were identified when BOH was in the nightside from 1800 to 0600 local times. We found the following Pi2 characteristics. (1) The occurrence distribution of Pi2s is relatively constant in local times. (2) The Pi2 frequency varies in local times. That is, Pi2 pulsations in postmidnight sector had higher frequency than in premidnight sector. (3) Pi2 power in premidnight sector is stronger than in postmidnight sector. (4) Pi2 frequency has positive correlation with solar wind speed and AE index. (5) Pi2 power has not a clear correlation with solar wind parameters. This indicates that Pi2 power is not controlled by external sources. (6) It is found that the most probable-time between Pi2 onsets is Δt ~ 37.5 min: This is interpreted to be the period between Pi2 pulsations when they occur cyclically. We suggest that Δt ~ 37.5 min is the occurrence rate of reconnection of open field lines in the tail lobe.
Pi2 pulsations have been used as an important indicator for the onset of magnetospheric substorm because the pulsations occur almost simultaneously at the onset of substorm (Saito et al. 1976). The Pi2 pulsations are hydromagnetic waves with the period of 40~150 s, and they are observed on the ground in the nightside at large areas ranging from high latitudes to low latitudes, and also observed in the nightside of the near-Earth space together with the occurrence of substorm.
Takahashi et al. (1995) studied the spatial characteristics of Pi2 pulsations generated from the Earth’s magnetosphere using the data from the Active Magnetospheric Particle Tracer Explorers Charge Composition Explorer (AMPTE CCE) satellite and low-latitude Kakioka ground magnetometers. Takahashi et al. (1995) examined the coherence and radial phase variation between the Pi2 pulsations observed in space and at the low-latitude ground stations. When the CCE satellite is located in the inner magnetosphere (L < 4) on the nightside, the Pi2 pulsations observed in space was coherent with the low-latitude Pi2 pulsations, and there was no phase difference. Based on this observation, the inner magnetosphere Pi2 pulsations can be explained by the plasmaspheric resonance waves trapped in the plasmasphere.
The plasmaspheric resonance is the wave energy trapped in the plasmasphere, and its existence was directly identified using the electric and magnetic field data of Pi2 pulsations observed from the inner magnetosphere satellite (Takahashi & Liou 2004, Kim et al. 2010, Kwon et al. 2012).
Nose (2010) investigated whether the low-latitude Pi2 pulsations are caused by the cavity mode resonance or by the bursty bulk flow. The result of this study suggested that the sum of Kp index over the entire day is related with the size of plasmasphere, and that the ion mass or F10.7 index of plasma sheet can be substituted with the mass density of plasmasphere. Through the result, the period of Pi2 pulsations was shown to be proportional to the size and mass density of plasmasphere, and based on this, it was concluded that the occurrence of low-latitude Pi2 pulsations is closely associated with the plasmaspheric cavity mode resonance.
Cheng et al. (2002) studied the two low-latitude Pi2 pulsations that occur consecutively using the Sino Magnetic Array at Low Latitudes (SMALL) magnetic field observation network. Cheng et al. (2002) observed that the dominant frequency of consecutive Pi2 pulsations is 10~20 mHz, and that the frequency of the first Pi2 pulsation increases as the Kp index increases. In the result of interplanetary magnetic field observation using the Advanced Composition Explorer (ACE) and Wind satellites, the two consecutive Pi2 pulsations showed different characteristics. The first Pi2 pulsation occurred when the interplanetary magnetic field points south, and the second Pi2 pulsation occurred as the interplanetary magnetic field turns to north. The first Pi2 pulsation is known to be associated with the magnetic field reconnection phenomenon as the flux of magnetic field originating from the dayside is accumulated at the Earth’s magnetotail. And the second Pi2 pulsation is explained by the reconnection of open magnetic lines of force which are located at the magnetotail lobe region. However, the time interval between the two Pi2 pulsations was not mentioned.
This study analyzed the local time distribution of low-latitude Pi2 pulsations observed at Bohyun ground magnetic field station using the data of the period when the Earth’s magnetosphere is not in extremely quiet condition (Kp > 2), investigated the correlation between the solar wind condition and the Pi2 pulsation frequency and pulsation strength, and examined the time interval between the consecutive Pi2 pulsations. In Section 2, the data used in this study and the Pi2 pulsation selection method were described, and in Section 3, the statistical characteristics of Pi2 pulsations were mentioned. The observation results were discussed in Section 4, and this study was summarized in Section 5.
2. DATA AND PI2 PULSATION DETECTION
The BOH magnetic field data during 1 year for 2008 was used to investigate the low-latitude Pi2 pulsations. The longitude of Bohyun ground station is 128.9°E, the magnetic L shell is 1.35, and the local time is UT + 9. In the case of magnetic field data, the 1-second data was averaged for 5 seconds, which was then used for the statistical analysis. The AE index and Kp index were used to understand the perturbation of geomagnetic field. Regarding the AE index and Kp index, the data was obtained from the World Data Center for Geomagnetism, Kyoto (http://wdc.kugi.kyoto-u.ac.jp/index.html). The interplanetary magnetic field data and the magnetic field strength, speed, density and dynamic pressure data for solar wind collected from the ACE satellite were utilized. As for the solar wind data from the ACE satellite, the 1-minute data which was time shifted to the bow shock nose that is provided by the National Aeronautics and Space Administration (NASA) was used (http://omniweb.gsfc.nasa.gov/).
In this study, the Pi2 pulsations were established with the use of following conditions. The data obtained when the Bohyun magnetic field station is located on the nightside (18~06 local time) was used, and the time series analysis was performed by removing the data values averaged for 5 minutes from the raw data. The Pi2 power value was calculated by integrating the frequency domain (5~25 mHz) of Pi2 pulsations in 3 minute interval using the Fourier transform method of time series data. With the automated procedure (Takahashi et al. 1995), the Pi2 pulsations were sampled so that the calculated H-component power (PH) value is more than 0.02 (10-1.7) nT2 and the maximum PH value is 10 times higher than the preceding 9 minute values and the following 17 minute values. Lastly, only the Pi2 pulsations which occurred when the Kp index value excluding the quiet condition is higher than 2 were sampled. And through this method, total 582 Pi2 pulsations were selected.
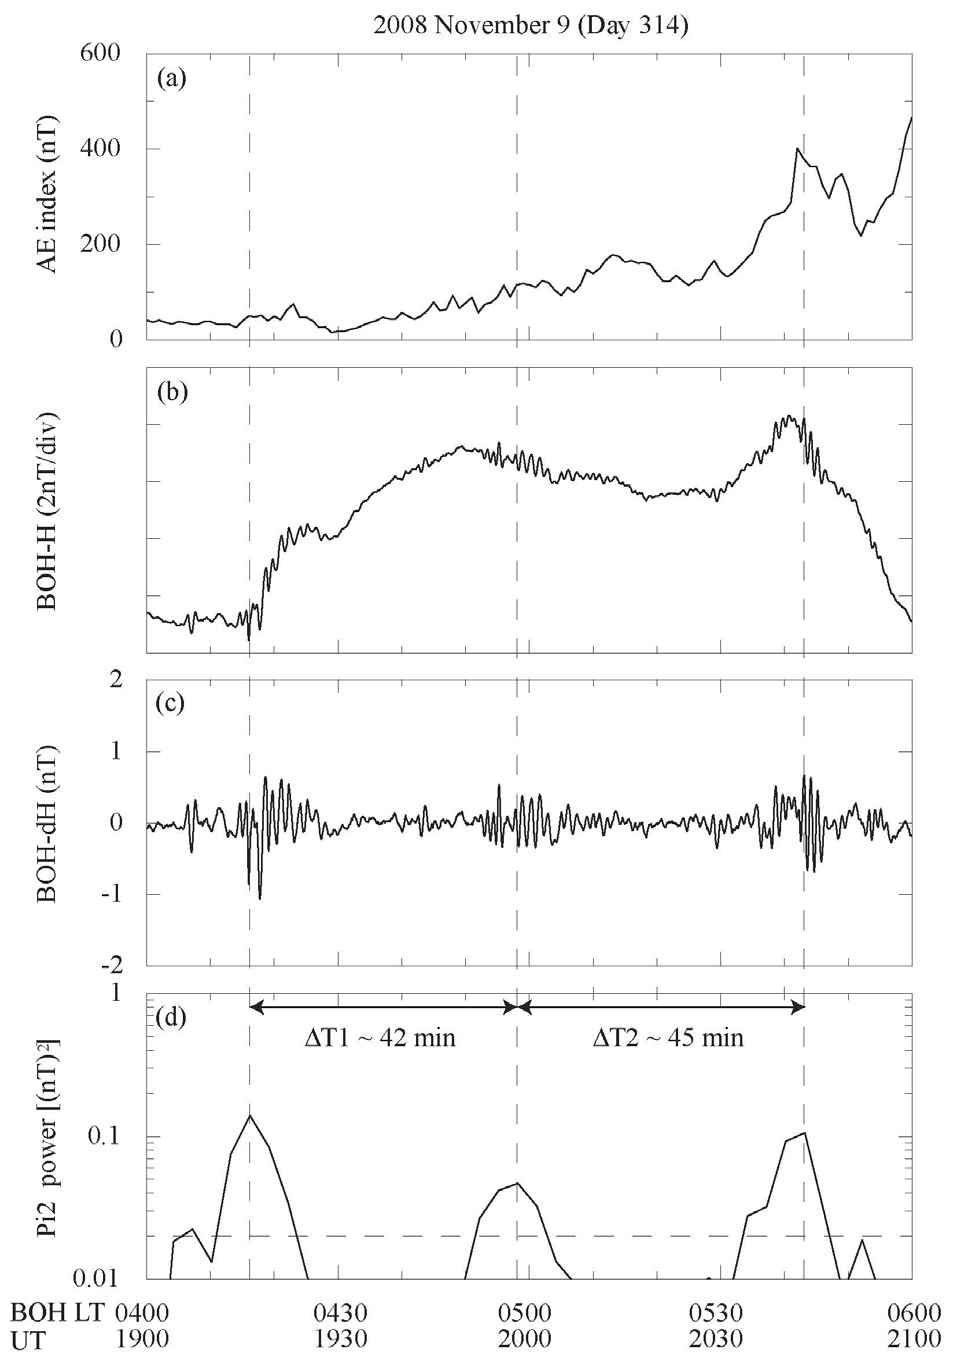
Fig. 1 shows the AE index, Bohyun magnetic field H-component, and the Mt. Bohyun H-component and Pi2 power which removed the 5-minute average values, that were observed at 04~06 LT on November 9, 2008. Fig. 1d clearly shows the 3 independent Pi2 powers which exceed the threshold value for 2 hours. The vertical dashed line indicates the time that the maximum Pi2 power value is observed which was obtained by the Pi2 pulsation sampling method. At 04:16 LT, the Pi2 pulsation was observed overlapping with the positive bay. The positive bay is generally observed in mid-low latitudes along with the occurrence of substorm, and this means that the Bohyun ground station is located within the substorm current wedge (Clauer & McPherron 1974). The variation of AE index when the substorm occurs is generally about 100 nT. However, in this event, the AE index increased about 30 nT, and this
could be classified as a pseudo-substorm (Koskinen et al. 1993, Ohtani et al. 1993, Nakamura et al. 1994). For the second Pi2 pulsation at 04:58 LT, the positive bay was not observed and there was no abrupt variation of AE index. For the third Pi2 pulsation at 05:43 LT, the positive bay and the increase of AE index (about 250 nT) were observed in the Bohyun H-component. The time intervals for the 3 events were ΔT1 = 42 minutes and ΔT2 = 45 minutes, respectively.
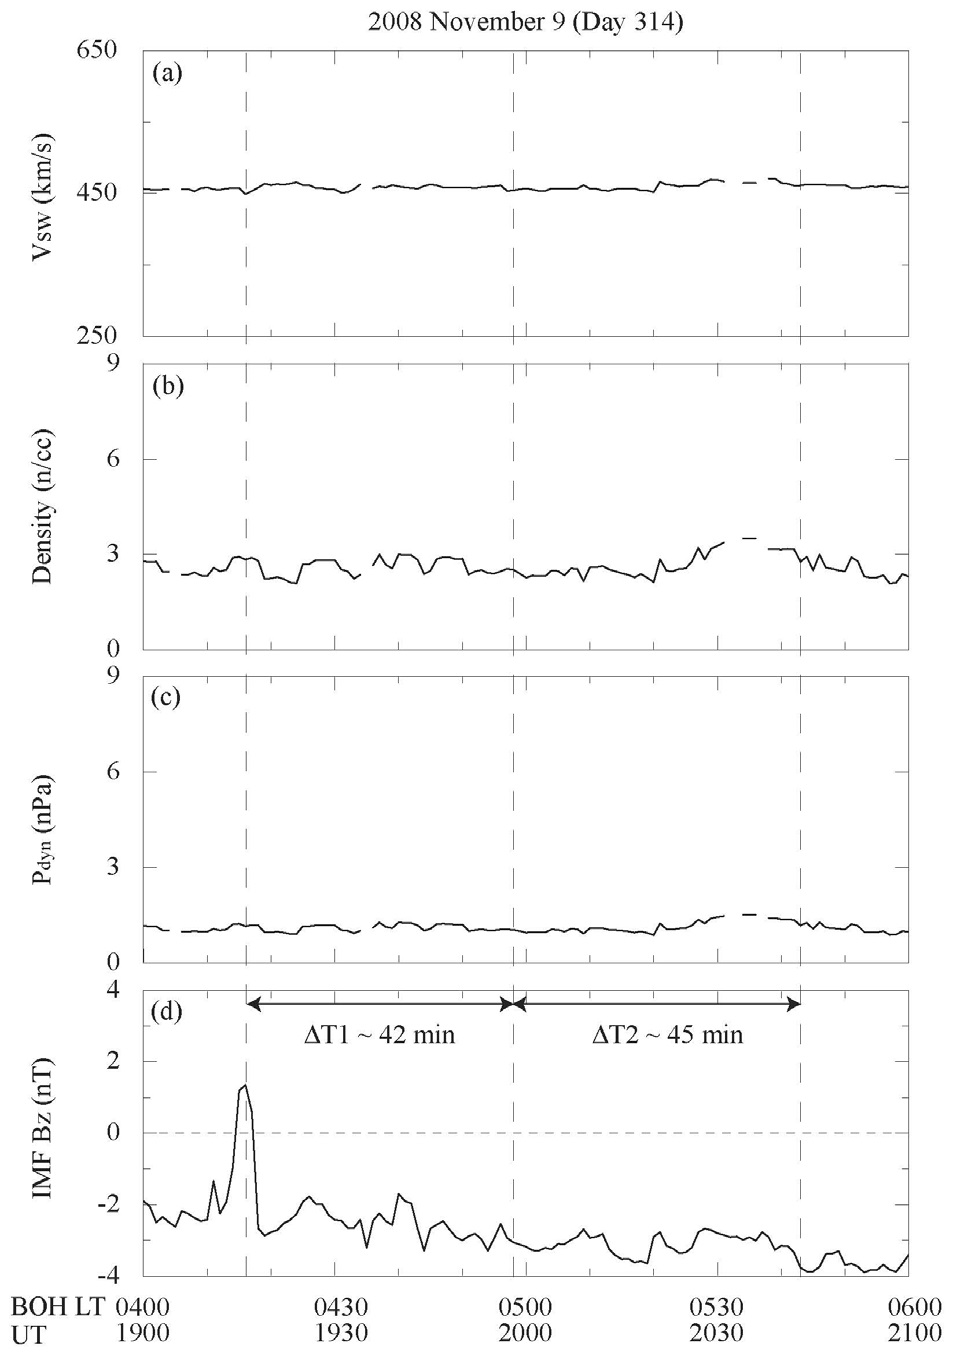
The speed, density and dynamic pressure for solar wind and the interplanetary magnetic field Bz-component observed by the ACE satellite were time shifted to the bow shock nose of Earth’s magnetosphere, which are shown in Fig. 2. The vertical dashed line indicates the time that the maximum Pi2 power value is observed. The interplanetary magnetic field Bz-component pointed south for almost 2 hours excluding the time that the first Pi2 pulsation occurred, and the average value was about 2.5 nT. The average solar wind speed was about 450 km/s, the average density was 2.5 cm-3, and the average solar wind
dynamic pressure was about 1 nPa. And there were no large variations during 2 hours.
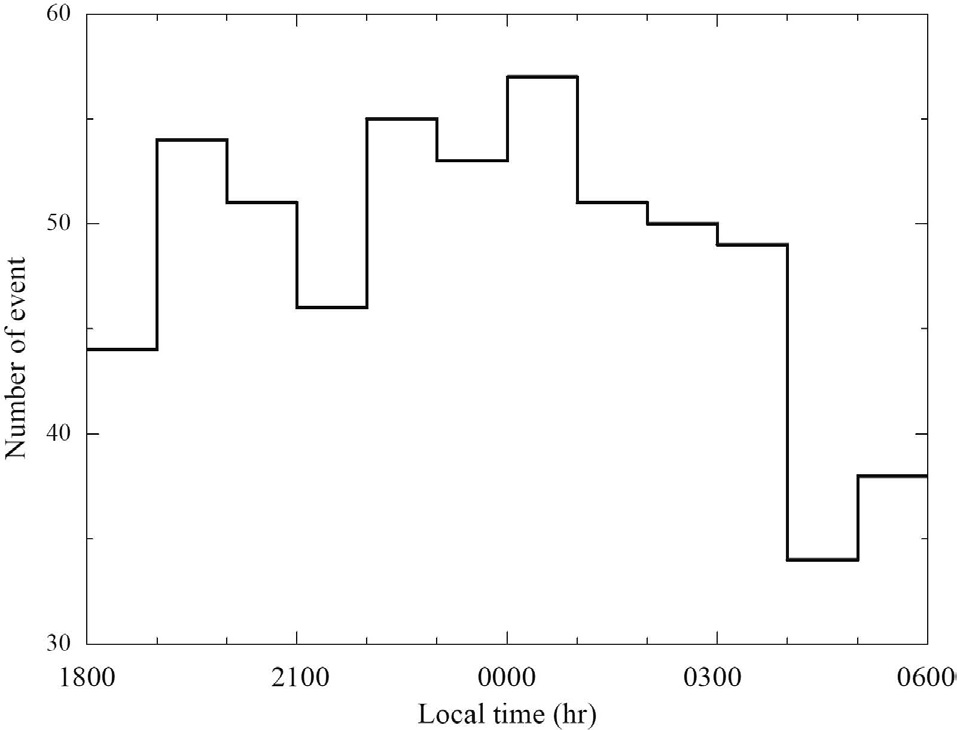
Fig. 3 shows the event number distribution based on local time. In Fig. 3, the histogram represents the number of Pi2 pulsation occurrence in an interval of 1 hour for the time that Pi2 pulsations occurred, which were observed during 2008 when the Bohyun magnetic field station was located on the nightside. As for the nightside, the Pi2 pulsations were evenly distributed from 19:00 to 04:00 LT, and relatively small number of pulsations were observed from 04:00 to 06:00 LT.
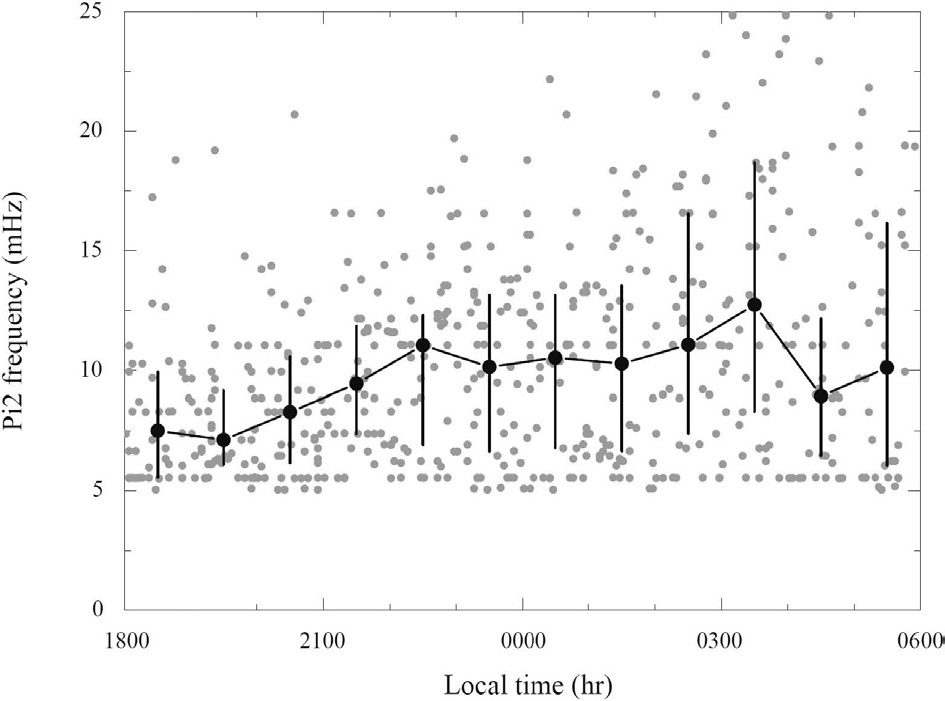
Fig. 4 is the Pi2 frequency distribution data based on local time. In Fig. 4, the gray dot represents the data for each Pi2 pulsation frequency observed during 2008 when the Bohyun magnetic field station was located on the nightside.
The black dot represents the median value of Pi2 pulsation frequency obtained within the 1-hour interval, and the black vertical line connects the low quartile and upper quartile. The Pi2 pulsation frequency was obtained by the following method. The Pi2 pulsation frequency was sampled so that the Pi2 pulsation power obtained from 5~25 mHz during the time that the Pi2 pulsations occurred has the maximum value. In this data, the Pi2 pulsation frequency mostly showed increasing trend from 18:00 to 04:00 LT. This result is consistent with the result of recent Pi2 pulsation study which used the Thermal Emission Imaging System (THEMIS) satellite data and Bohyun data (Kwon et al. 2012).
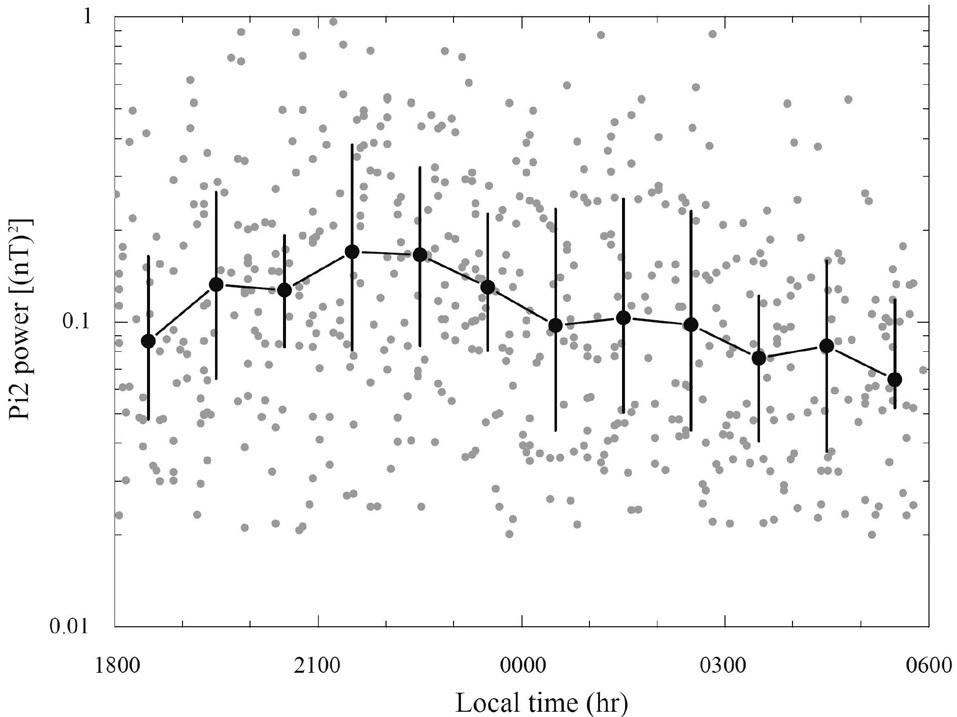
Fig. 5 is the Pi2 power data based on local time. According to the variation of median value, the Pi2 power has the
highest value at 21~22 LT, and the asymmetry phenomenon of Pi2 power occurs around the midnight. This result is
similar to the result of Takahashi & Liou (2004).
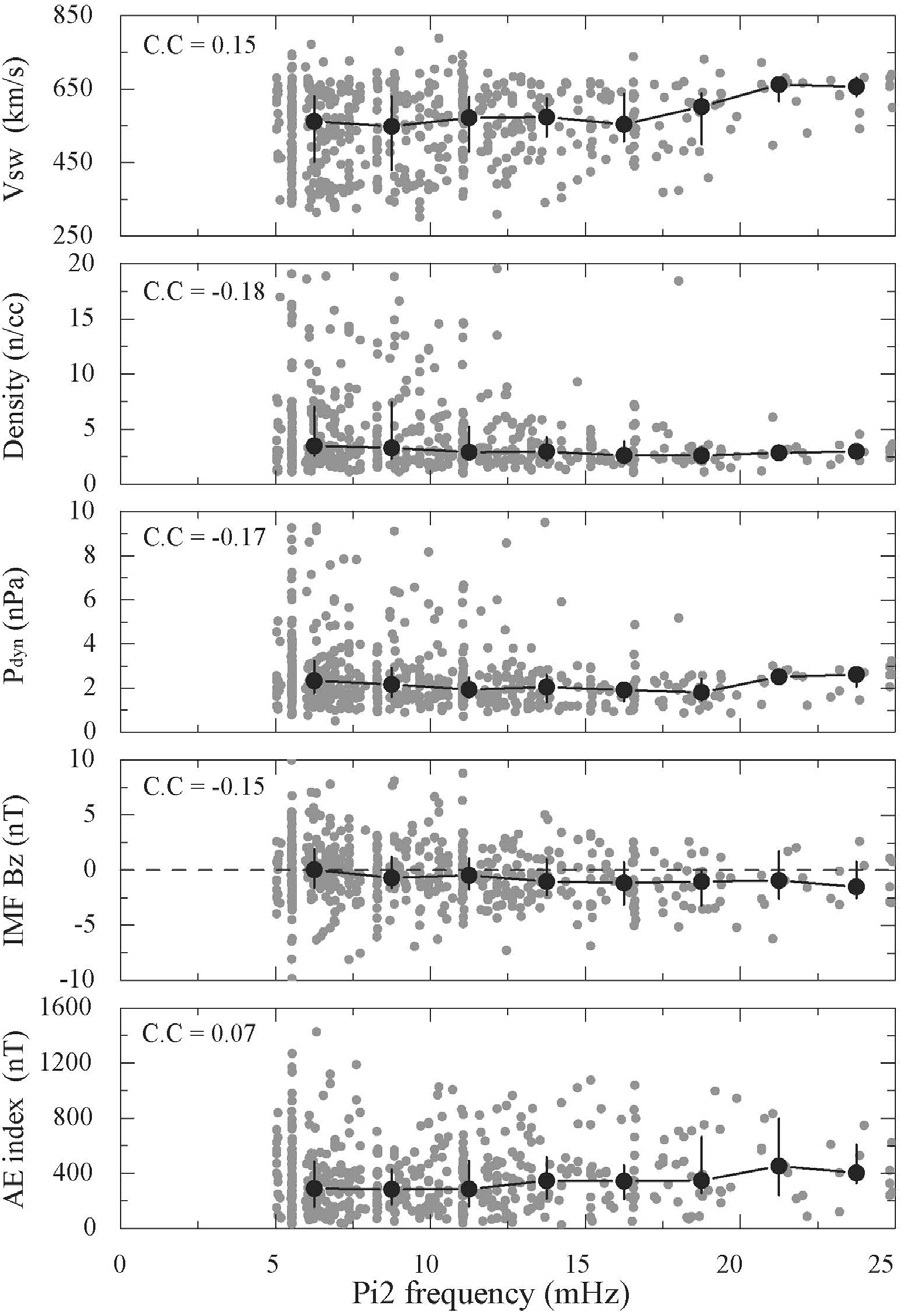
Fig. 6 shows the relation of Pi2 pulsation frequency with the solar wind parameters and AE index. In Fig. 6, regarding the speed, density, and dynamic pressure for solar wind and the interplanetary magnetic field Bz-component, the average value data for the 30 minutes which is from 1 hour before to 30 minutes before the Pi2 pulsation occurrence was utilized considering the time it takes for the Earth’s magnetosphere to respond to the solar wind parameters (Bargatze et al. 1985). With regard to the AE index, the maximum value for the duration time of Pi2 pulsation was used. The gray dot represents the value for each Pi2 pulsation frequency, the black dot represents the calculated median value at an interval of 2.5 mHz, and the black vertical line connects the low quartile and upper quartile. The correlation coefficient for each data relative to the Pi2 frequency was shown on the upper left side of each figure.
In this data, the solar wind speed and Pi2 frequency had a positive correlation (Troitskaya 1967), but regarding the
variation of median value, the variation range was small. The solar wind density had a negative correlation, but there seems to be no relation considering the variation of median value. As for the solar wind dynamic pressure, the variation of median value showed similar trend to the solar wind speed at the Pi2 frequency of 20~25 mHz. This is because the solar wind speed is reflected in the calculation of dynamic pressure (ρV2.:ρ = solar wind density, V = solar wind speed). The interplanetary magnetic field Bz-component had a negative correlation, and it increased toward the south direction depending on the increase of Pi2 pulsation frequency with the variation range of about 1.5 nT. As for the AE index, the variation range of median value increased about 120 nT for 7~22 mHz.
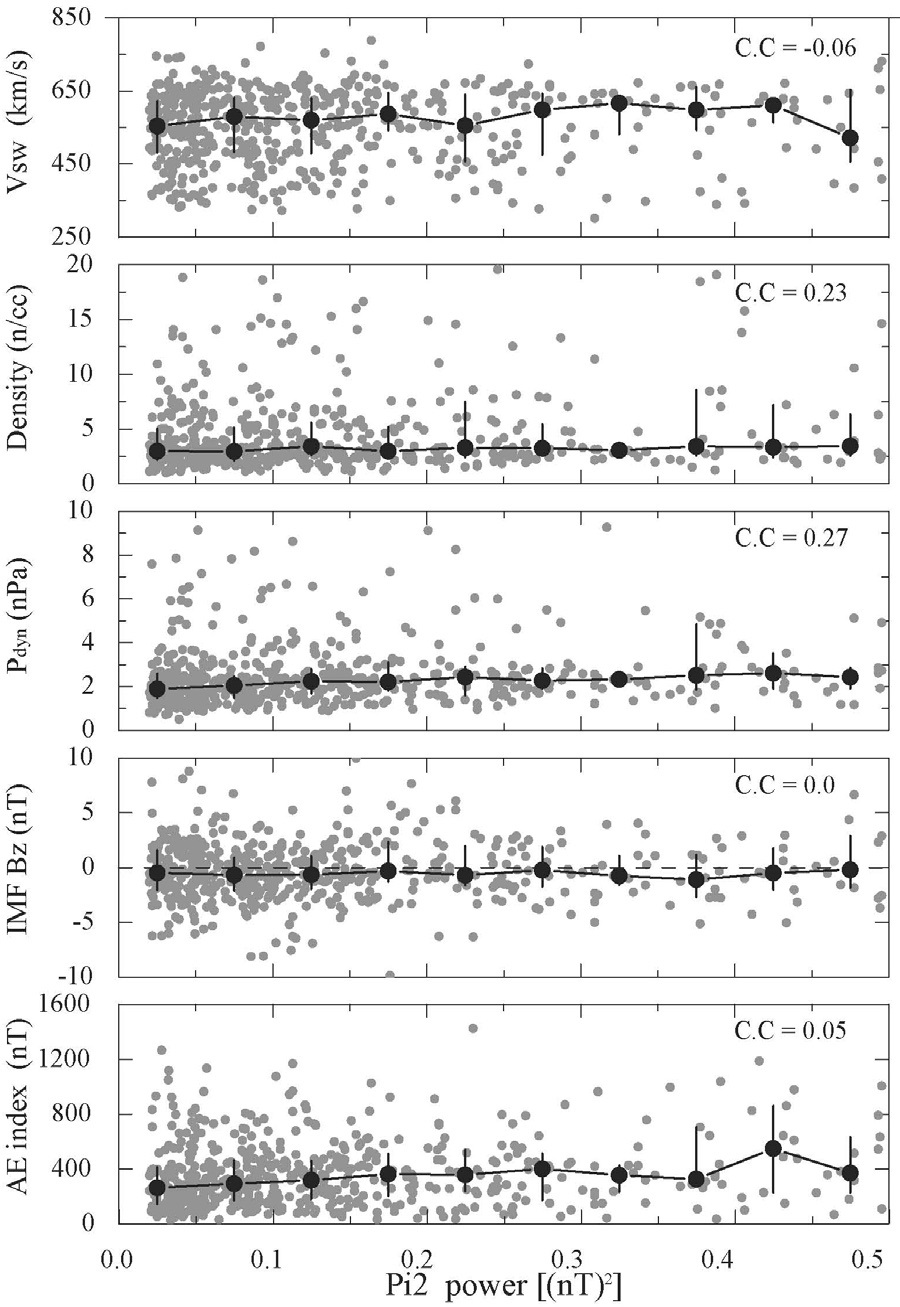
Fig. 7 shows the relation of Pi2 power with the solar wind parameters and AE index. The correlation coefficient for each data relative to the Pi2 power was shown on the upper right side of each figure. In Fig. 7, according to the correlation coefficient, there was no particular relation between the solar wind parameters and Pi2 power except for the solar wind density and solar wind dynamic pressure. The solar wind density and solar wind dynamic pressure had higher correlation coefficient compared to other solar wind parameters, but regarding the variation of median value, the variation range was insignificant. However, as for the relation to the AE index, it had positive correlation with the Pi2 power although the correlation coefficient was small, and the variation range of median value increased about 100 nT.
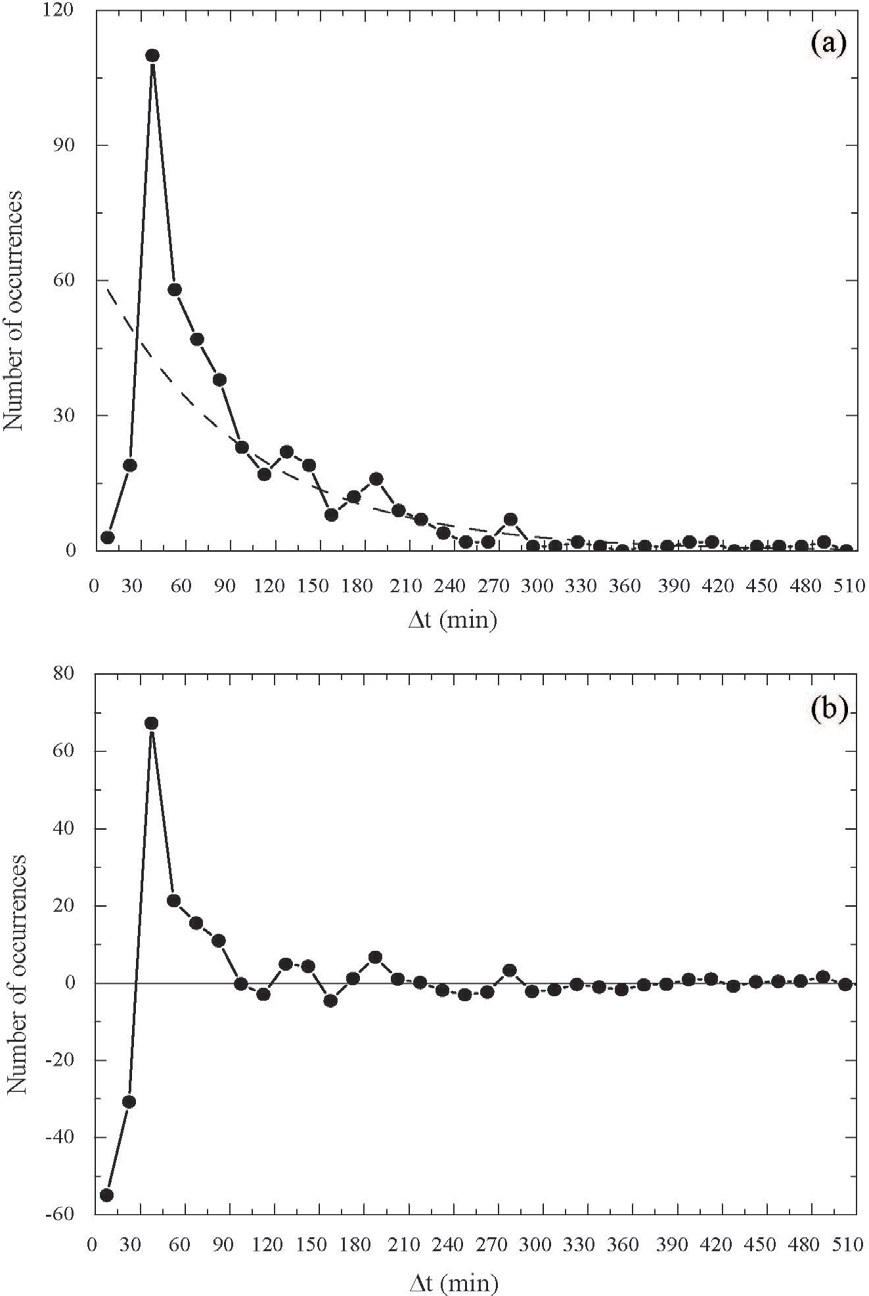
Fig. 8 shows the time interval distribution between the consecutive Pi2 pulsations. In this distribution, the time interval between the two Pi2 pulsations was investigated, and the time interval of distribution chart was set to 15 minutes. The black dot represents the number of events depending on time interval, and the black dashed line represents the Poisson distribution. The Poisson distribution indicates the theoretical distribution of time interval when the two events occur randomly. The equation for the Poisson distribution is defined as in Eq. (1) (Boas 2006).
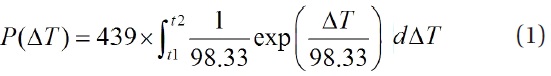
where Δ
Statistically, in the data from Fig. 8a, there is the interval which does not follow the Poisson distribution. To examine the interval in detail, the Poisson distribution was subtracted from the observed distribution, and the resulting values are shown in Fig. 8b. The first interval is between 37.5 and 82.5 minutes which accounts for about 26% (115/439) of the total events, and the time interval that has the most events is about 37.5 minutes. The second interval is between 127.5 and 142.5 minutes (2.1~2.4 hours) which accounts for about 2% (9/439) of the total events, and the third interval is between 172.5 and 217.5 minutes (2.9~3.6 hours) which accounts for about 2% (9/439) of the total events.
The number of Pi2 pulsation occurrence was found to be almost evenly distributed in the nightside depending on local time. As for the cause of this study result, the source of Pi2 pulsation occurrence is considered to be near midnight for the Earth’s magnetotail region, but when the pulsation occurred, it is thought to be propagated into the broad local time area in the inner magnetosphere for the nightside, which leads to the result.
In this study, the local time dependence of Pi2 pulsation frequency was observed. This result was consistent with the recent result of Kwon et al. (2012) which used the THEMIS satellite data and low-latitude ground magnetic field station data. Kwon et al. (2012) suggested that the local time dependence of Pi2 frequency is caused by the asymmetry of plasmapause depending on local time, and that this is determined as the Pi2 pulsation period oscillates on the meridional plane.
Other characteristics of low-latitude Pi2 pulsations depending on local time were shown in the Pi2 pulsation power distribution. According to Takahashi & Liou (2004), the fact that the Pi2 pulsation power depending on local time is higher in the pre-midnight portion is because the highest point of auroral power is around 21 LT and the source region of Pi2 pulsations is located near the eastern head of auroral surge. However, the exact cause is not yet known. In this study, the Pi2 pulsation power was higher in the pre-midnight portion than the post-midnight portion, and the highest Pi2 pulsation power was observed between 21 and 22 LT, which is consistent with the previous study result.
This study examined the relation of Pi2 pulsation characteristics with the solar wind condition and AE index. When the Pi2 pulsation frequency was compared with the solar wind condition and AE index, there was a correlation that the Pi2 pulsation frequency increases as the speed and dynamic pressure for solar wind and the AE index increase. The interplanetary magnetic field Bz-component had a weak negative correlation. If the Pi2 pulsations observed had been caused by the plasmaspheric resonance, the major factor that determines the period is the location of plasmapause. The location of plasmapause is inversely proportional to the square root of the electric field (Esw) which is produced by the plasma convection that flows from the magnetotail toward the Earth (Parks 2004). The Esw corresponds to about 10~20% of solar wind electric field (VBs: V = Vsw, Bs = southward IMF) (Goldstein & Sandel 2005). Therefore, in this study, the positive correlation between the Pi2 frequency and solar wind speed and the negative correlation between the Pi2 frequency and interplanetary magnetic field Bz-component indicate the migration of plasmapause toward the Earth, which is considered to be related with the increase of Pi2 frequency. The positive correlation with the AE index is considered to be caused by the increase of energy influx to the ionosphere due to the increase of convection in the magnetosphere.
The relation of Pi2 power with the solar wind parameters and AE index was investigated. For the AE index, the variation range was about 100 nT, and the AE index showed increasing trend as the Pi2 pulsation power increases. For
the solar wind condition, the variation range was very small, and there was no particular correlation. The relation between the AE index and Pi2 pulsation power indicates that the stronger Pi2 pulsations occur when the western auroral jet current increases. And the lack of the relation between the Pi2 pulsation power and solar wind condition indicates that the Pi2 pulsation power is not controlled by the external factors, but could be affected by the characteristics within the Earth’s magnetosphere.
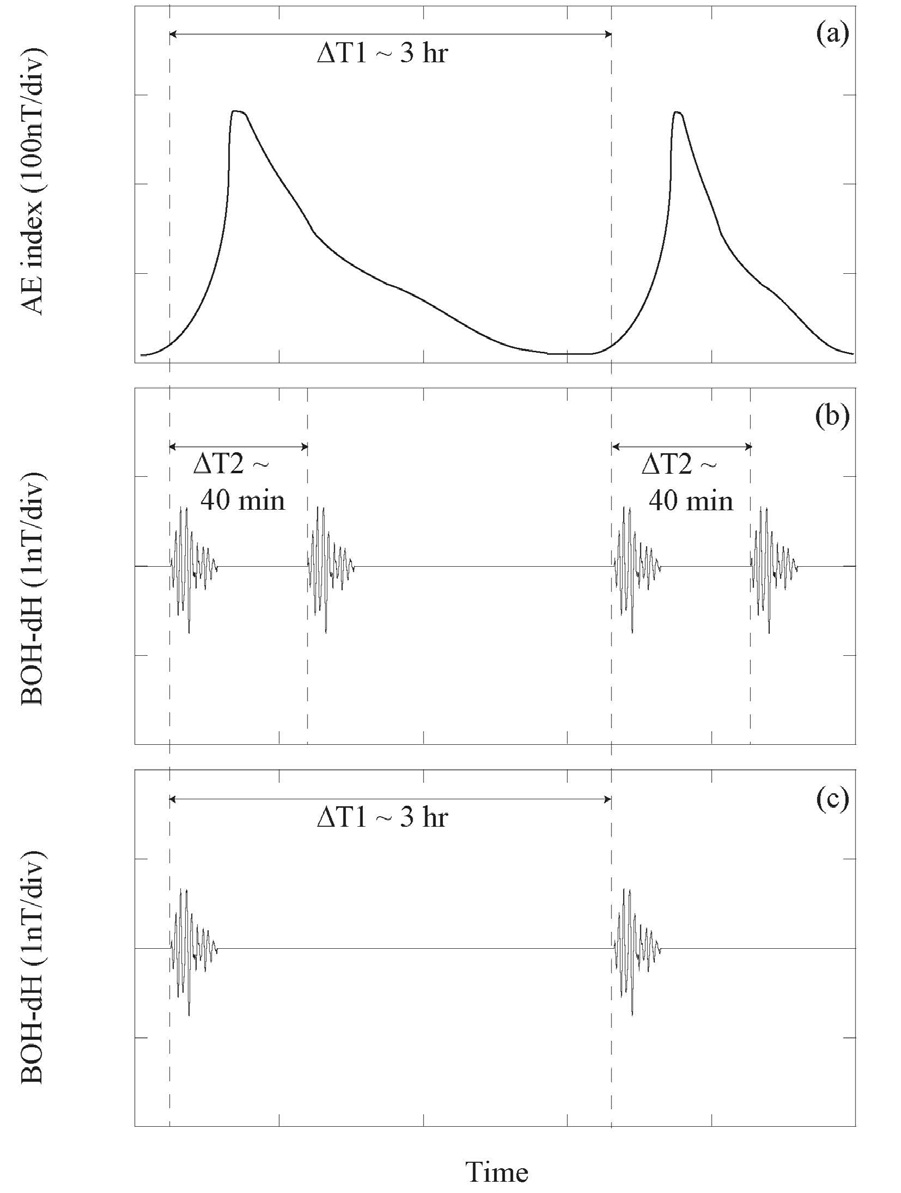
In this study, the 3 time intervals which could be produced by non-random factors were identified through the statistical analysis of time interval between the consecutive Pi2 pulsations. According to Borovsky et al. (1993), the substorm mostly occurs continuously every 2 to 3 hours. For this study, the time interval between the consecutive Pi2 pulsations was found to be 30 to 40 minutes which is much shorter than the period of substorm, and it accounts for 26% of the total events. The Pi2 pulsations that have the time interval of 2 to 3 hours were only 4%. Fig. 9 shows the diagram of Pi2 pulsations which occur in association with the substorm. According to the result of this study, for most consecutive Pi2 pulsations, a number of Pi2 pulsations occur when a single substorm occurs as shown in Fig. 9b, and the one-to-one correspondence between the Pi2 pulsation and substorm is very uncommon as shown in Fig. 9c. The 40 minute time interval between the consecutive Pi2 pulsations observed in this study is thought to be the time it takes for the open magnetic lines of force at the tail lobe to move to the center of plasma sheet and to complete the magnetic reconnection after the onset of substorm.
We performed the statistical analysis for total 582 Pi2 pulsations using the low-latitude Bohyun ground magnetic field data (Kp > 2) obtained in 2008.
In this study, the Pi2 pulsations were found to occur evenly depending on nightside local time (18~06 LT). The Pi2 frequency showed increasing trend as it goes from dusk to dawn. This variation of frequency is thought to be caused by the asymmetry of plasmapause depending on local time. In addition, for the Pi2 power distribution based on local time, it showed higher value in the pre-midnight portion than the post-midnight portion, and this is thought to be because the source region of Pi2 pulsations is located in the pre-midnight portion.
The Pi2 frequency had a positive correlation with the solar wind speed and AE index, and had a negative correlation with the interplanetary magnetic field Bz- component. This indicates that the size of plasmapause changed due to the variation of convection caused by the solar wind electric field and thus the Pi2 frequency changed due to the plasmaspheric resonance. The Pi2 power showed no correlation with the solar wind condition, but showed a positive correlation with the AE index. This means that the Pi2 power is determined by the variation in the Earth’s magnetosphere rather than the external effects.
As for the time interval distribution between the consecutive Pi2 pulsations, the intervals that have 30 to 40 minutes time distribution which is shorter than the time interval of general substorm occurrence were observed, and this indicates that a number of Pi2 pulsations occurred with respect to a single substorm. This time interval is thought to be the time it takes for the open magnetic lines of force at the tail lobe region to move to the center of plasma sheet and to complete the magnetic reconnection.