Water demand is concentrated in urban areas due to higher population densities, as well as the diversity of industries and facilities which require water supplies. Given future climate trends, which are expected to result in more frequent and severe droughts, it will be necessary to retain further rainwater resources as part of a sound hydrological cycle [1]. Much dam construction and water conveyance projects have been carried out for obtaining water resources to support urban activities, but to the reception for such water resource development projects had declined, due to environmental concerns, land usage priorities, and public levels of acceptance. Rainwater harvesting, on the other hand, is an effective way of satisfying our water demands with minimum impact on groundwater levels, since it reduces rainwater runoff. Additionally, the use of harvested rainwater contributes to reducing the amount of water taken from rivers and other natural water sources. Because of these benefits, as of the end of 2008 fiscal year there were around 3,400 facilities throughout Japan making use of rainwater and reclaimed water [2]. The average rainfall of Tokyo is 1,405 mm/yr, equivalent to the average daily amount of tap water supply; but half of this rainwater runs off directly into rivers and to the ocean [3]. It would be wise to utilize this rainwater, along with tap water, as water for domestic use, for use in urban activities, and for a variety of other water needs for cities [4].
In assessing the potential for using rainwater as a water resource in urban areas, in addition to the water balance analysis of water demand versus internal renewable water resources, which is widely used in assessing water scarcity due to climate change [5,6], it is important to carry out a multifaceted evaluation of factors such as the amount of water used in urban activities, the quality of rainwater, and local characteristics, taking into account spatial distribution. Watanabe et al. [7] developed water balance diagrams of 23 major cities in Japan, and conducted research on water use stress, taking into account such quantitative factors as a city’s water self-sustainability and utilization ratio of its own internal water resources. Murakami and Furumai [8] discussed the possibility of using rainwater for different purposes according to the quality level of the rainwater. Another study examined the feasibility of installing rainwater storage tanks in existing buildings in low-lying parts of Tokyo’s special wards, based on geographic information system (GIS) data and field surveys, and estimated the benefits of rainwater harvesting [3].
In this study, based on the use of rainwater for miscellaneous purposes and focusing on the water demands of different types of buildings: 1) we made use of GIS data and various statistical data to estimate water demand in the Tokyo wards, taking into account miscellaneous water usage patterns per building type; 2) we proposed a method for relatively and quantitatively determining rainwater utilization potential based on the amount of available rainwater resources and miscellaneous water demands per building type. This was then applied to the 23 Tokyo wards; and 3) assuming miscellaneous water use to be augmented by rainwater harvesting based on the roof area of individual buildings, we evaluated the benefits of such usage and considered the effectiveness of rainwater utilization from the standpoints of reducing the water supply burden in large cities and stabilizing water resources.
2.1. Ratio of Miscellaneous Water Use to Total Water Usage Amount per Building Type
Table 1 summarizes the ratio of miscellaneous water use to total water usage amount per building type in Tokyo. The miscellaneous water uses are of three kinds, for toilet flushing (TF), air conditioning (AC), and garden watering (GW), not requiring
[Table 1.] Water demand units by building type and percentage of water use
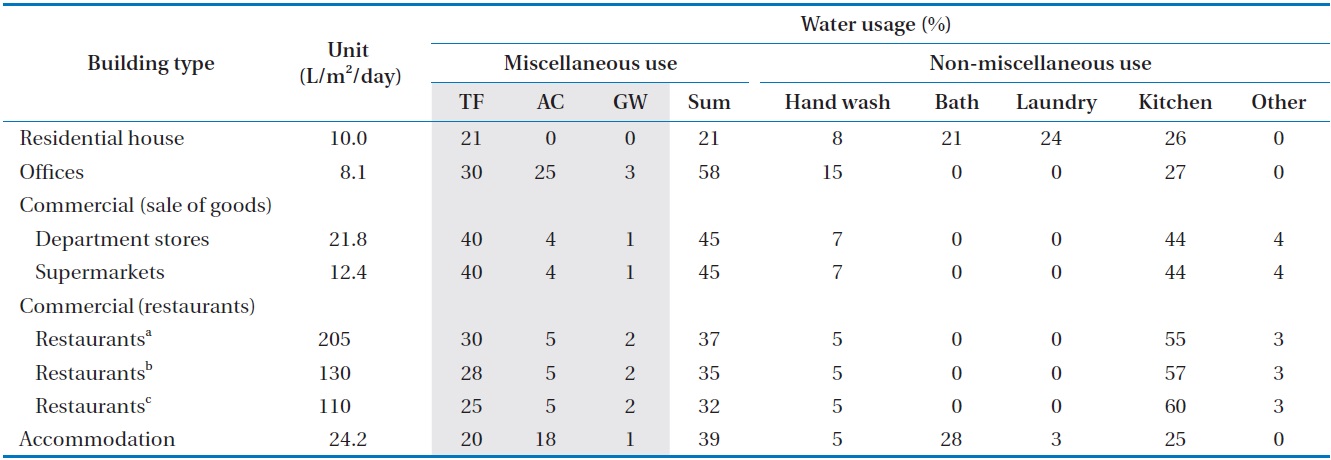
Water demand units by building type and percentage of water use
water of potable quality. While the table divides restaurants into three types, water demand was calculated based on the average unit demand across these three types to avoid complicating the classification of building types. Tokyo’s the average miscellaneous water demand for restaurants, department stores, accommodations, supermarkets, office buildings, and residential houses are 51.9, 9.8, 9.4, 5.6, 4.7, and 2.1 (L/m2/day), respectively [9]. The miscellaneous water demand unit for restaurants is notably higher than that of other building types.
2.2. Classification of Building Types in the Tokyo Wards
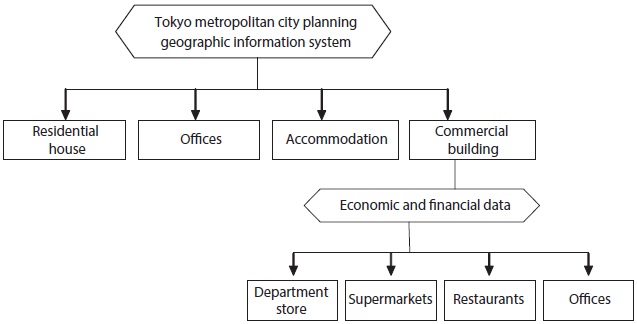
For classifying buildings based on their purposes for miscellaneous water use, we referred an electronic database on building status of the Tokyo Metropolitan City Planning Geographic Information System (2001), as shown in Fig. 1.
The data relates to the classification of buildings on residential land into 15 types, namely, government buildings, educational and cultural facilities, health and welfare facilities, utilities and waste disposal facilities, office buildings, dedicated commercial facilities, combined residential and commercial buildings, accommodations, sports facilities, detached houses, multi-family residences, dedicated factories, combined residences and factories, storage and transport facilities, and agriculture and fishery facilities, etc. For each building there are 20 layers of data, including number of floors, below-ground floors, structure, purpose, area, and location. The present study covers 13 types of buildings, omitting agriculture and fishery facilities as well as factories, which have water supply systems different from ordinary systems. For each of these 13 types of buildings we compiled statistical data on the roof area, number of floors, and number of buildings.
Since, the Tokyo Metropolitan City Planning Geographic Information System does not include department stores, supermarkets, or restaurants in its building classification; we investigated the numbers of these building types in the Tokyo wards using the statistics from economic and financial data by the Ministry of Internal Affairs and Communications [10]. Since department stores have the same purpose throughout the building, we simply used the number of buildings as it is. Supermarkets and restaurants, on the other hand, may combine different kinds of services in the same building, so we adopted a method of distributing the number of supermarkets and restaurants among dedicated commercial use and combined commercial and residential use buildings.
GIS data of Zmap-TOWN II (ZENRIN Co., Ltd., Fukuoka, Japan) was used to identify buildings in the study area and to classify building types based on their usage. This map contains detailed information on individual buildings in the attribute table of the vector layer, such as building and owner names, number of stories, and business type. The data reflects the situation in 2000. Each building type was characterized using usage/business type information which was contained in the attribute table of the GIS map.
2.3. Evaluating Rainwater Utilization Potential for Miscellaneous Water Use
This study defined rainwater utilization potential as the ratio of available rainwater to the amount of miscellaneous water demand. While there may be constraints on rainfall use such as economic or installation feasibility, we looked at utilization potential assuming the maximum possible usage of rainfall over a year.
As for the rainfall data, we used AMeDAS (Japan weather satellite) hourly precipitation data from Otemachi, Tokyo. The Japan Meteorological Agency calculates average annual rainfall using observations for year 1981 to 2010, so we used the rainfall data for that period to find the average annual rainfall amount in Tokyo. Moreover, we determined dry years and wet years with the minimum and maximum rainfall in the past ten years (2001?2010), in line with the concept of standard drought water discharge assumed to occur around once every ten years.
Based on the water demand for each building type, we calculated annual water demand, taking into account the following constraints on water use.
1) Use of air conditioning for a three-month period between July and September.
2) Garden watering for a nine-month period between March and November, but not on rainy days.
In order to estimate demand for miscellaneous water relative to the amount of rainfall, we used this demand in units of mm/yr as equivalent rainfall per unit building area.
2.4. Analyzing the Benefits of Rainfall Harvesting and Use
We calculated how much rainwater could be collected from
building roofs and utilized as miscellaneous water use. The rainwater harvesting facilities were assumed to be large enough to hold up to 50 mm of rainwater. Since the Act on Maintenance of Sanitation in Buildings sets a water quality turbidity standard of 2 degrees as a water quality control standard, in this analysis we calculated the amount of collected rainwater assuming a limit of 2 mg/L or below for suspended solids (SS) in rainwater flowing into the storage facilities. For calculating SS concentration in rainwater, we used the model of Hijioka and Furumai [11] and parameters such as sediment amount and runoff were adopted from this model.
3.1. Building Type Classifications
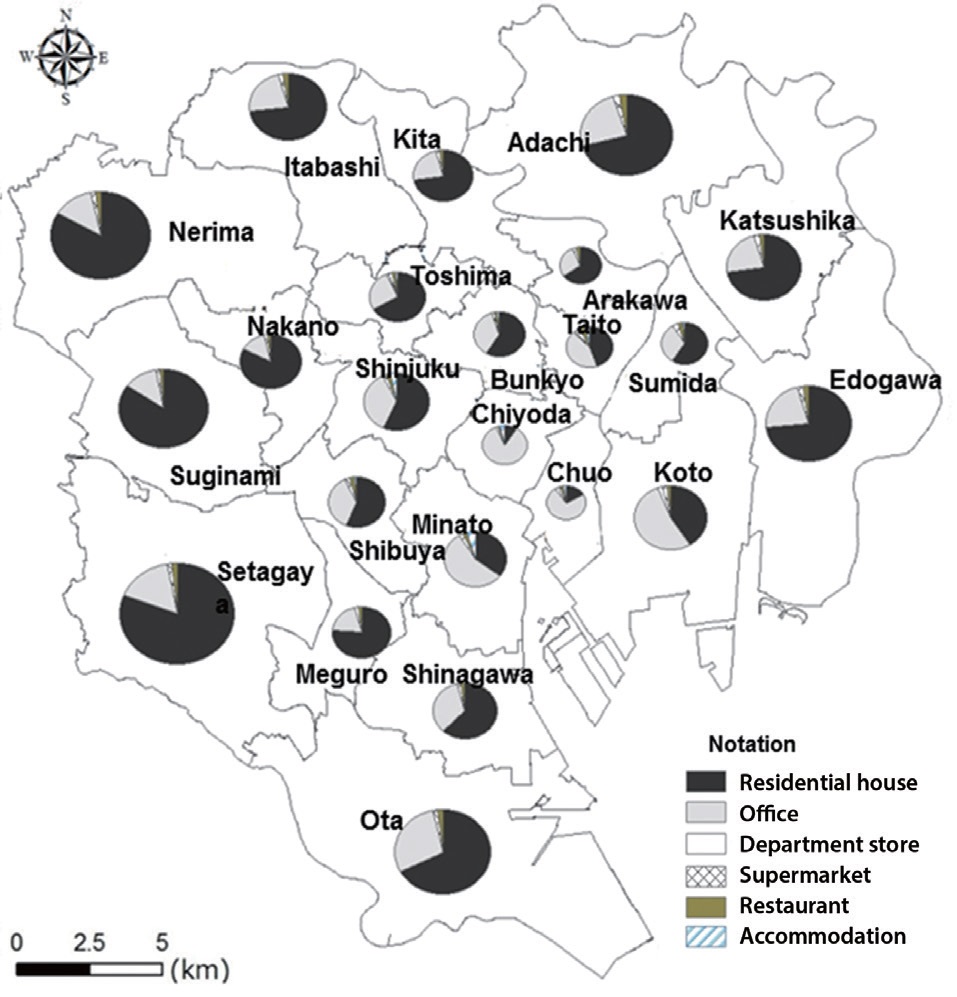
Based on the classification of building types in the Tokyo wards, the ratio of residential houses, offices, department stores, supermarkets, restaurants and accommodation and their distribution in each ward are as shown in Fig. 2 using GIS.
The most common uses of buildings are for residential house and office purposes; these two uses combined make up 94% of the total building area within the Tokyo wards. Of the 23 wards, Suginami, Nerima, and Nakano have the highest ratio of residential houses, accounting for more than 80% of the total building area; and buildings for office use are the smallest in area at 13%, 14%, and 14%, respectively. Chiyoda and Chuo wards have the highest ratio of office buildings at more than 82% and 72% of the total building area, with housing taking up the smallest area at 10% and 17%, respectively. In the overall Tokyo ward area, office buildings are heavily concentrated in the area along Tokyo Bay, which includes Chiyoda ward, while residential houses are concentrated in the parts surrounding this area.
3.2. Rainwater Utilization Potential per Building Type
Average annual rainfall of Tokyo and miscellaneous water demand per building type are summarized in Table 2. Compared to average annual rainfall over the past 30 years of 1,594 mm, annual miscellaneous water demand was 767, 1,133, 3,318, 1,887, 16,574, and 2,227 mm, respectively, for residential houses, offices, department stores, supermarkets, restaurants, and accommodation. Taking the miscellaneous water demand in residential houses as base, the demand for offices, department stores, supermarkets, restaurants, and accommodation facilities is 1.5, 4.3, 2.5, 21.6, and 2.9 times this amount, respectively.
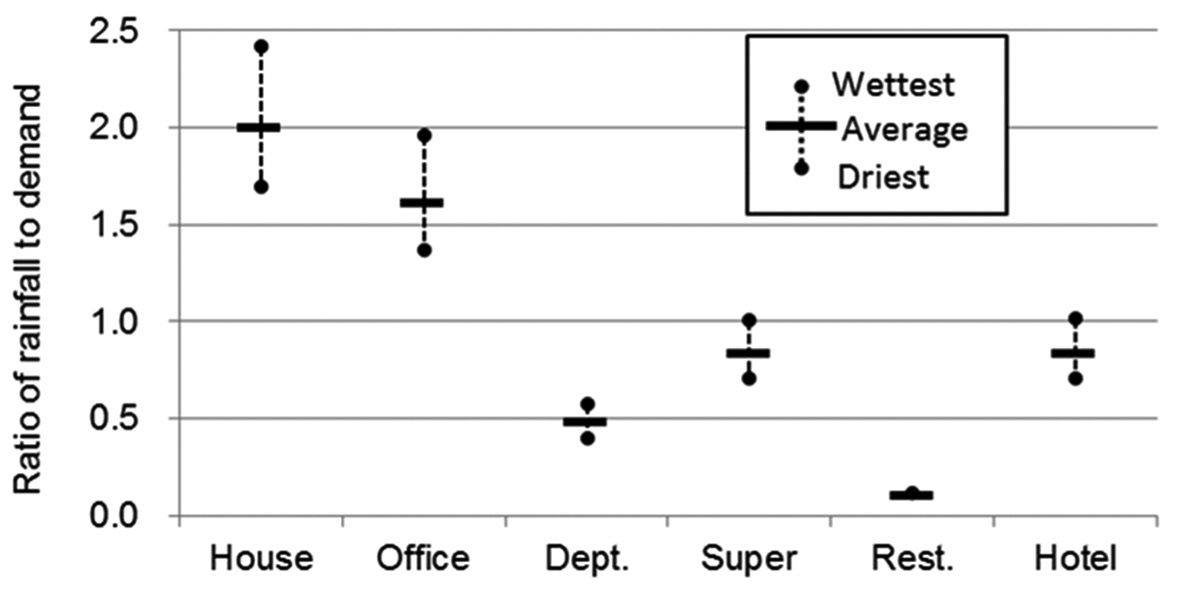
In addition, Fig. 3 shows the ratio of rainfall to miscellaneous water demand for each building type.
We also see that the ratio of average annual rainfall to miscellaneous water demand for each building type is 2.0, 1.6, 0.5, 0.8, 0.1, and 0.8 times, respectively. While there is variation between dry and wet years, in the case of the residential and office buildings, making up the majority of buildings in Tokyo, the amount of rainfall exceeds miscellaneous water demand. This indicates that the potential for utilizing rainwater in meeting the

Average rainfall of Tokyo in the past 20 years and miscellaneous water demand by building type as equivalent rainfall
demand is higher for residential and office buildings than for other building types. For restaurants, on the other hand, among the six building types, it seems to be quite difficult to meet their demand by rainwater utilization alone.
3.3. Rainwater Utilization Potential in Each Tokyo Ward
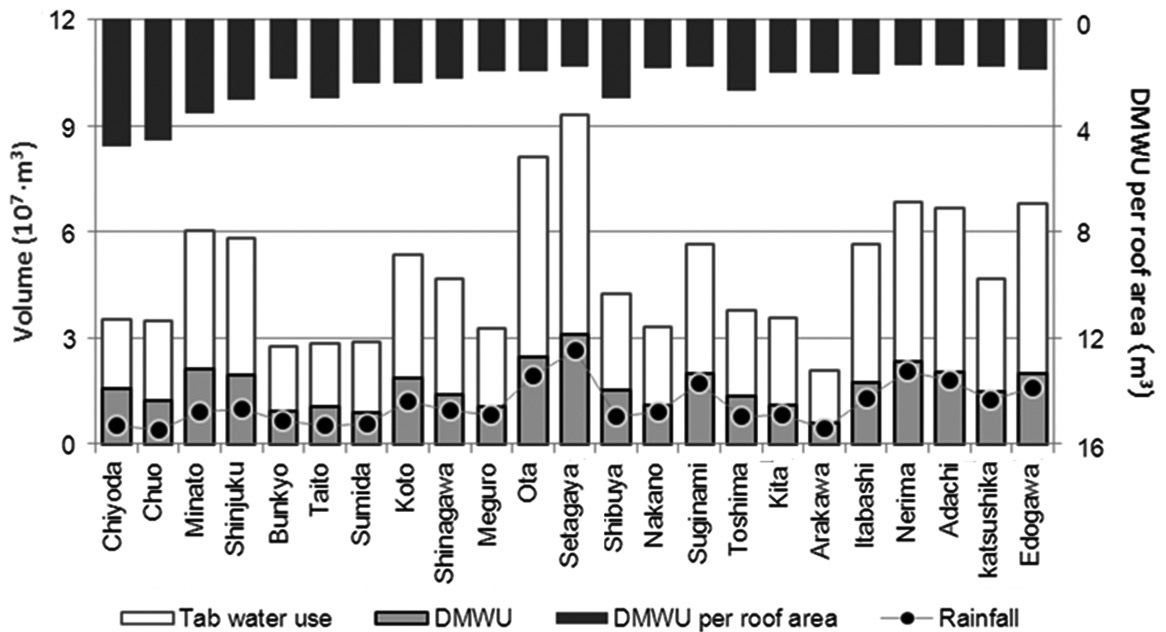
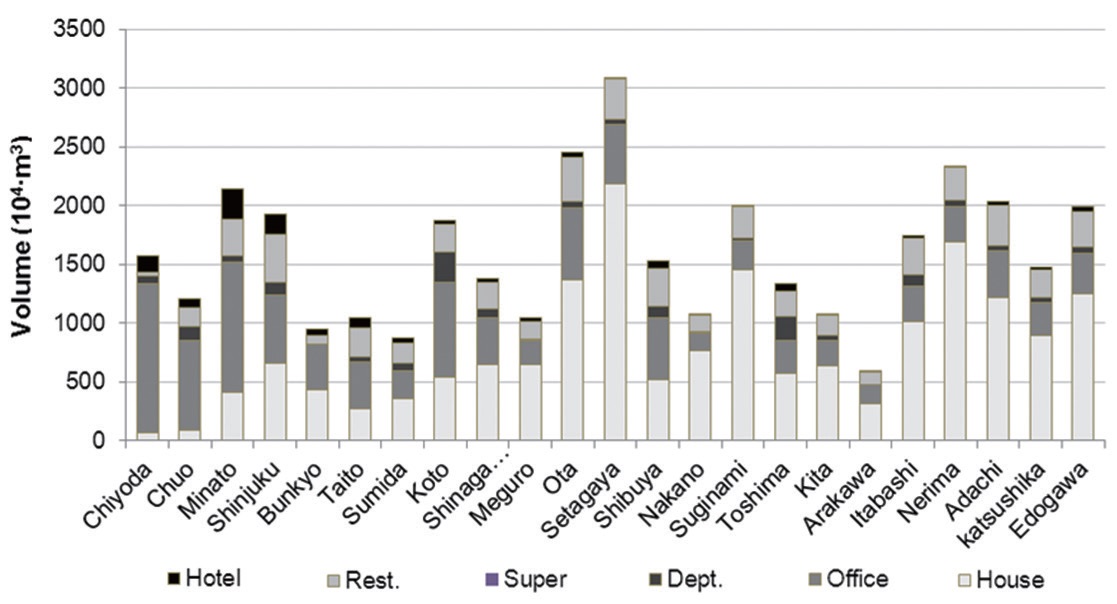
We calculated miscellaneous water demand, taking into account the numbers of buildings and floors, etc., in each ward. Fig. 4 shows the amount of miscellaneous water demand in each of the 23 wards along with the tap water supply amount in year 2006 data, rainfall and miscellaneous water demand per roof area.
Both tap water supply and miscellaneous water demand are highest in Setagaya and Ota wards. In miscellaneous water demand, Minato ward is in third place following these two wards. The reasons for the high demand in these wards are the large area of residential housing in the case of Setagaya and Ota wards, and for Minato ward, the high ratio of office buildings and higher than average number of floors than in other parts of Tokyo. In terms of miscellaneous water demand per roof area, the top three wards are Chiyoda, Chuo, and Minato wards, reflecting the concentration of office buildings and tall buildings in the central business area of Tokyo. The results also show that in the Tokyo wards, demand for miscellaneous water ranges from 30% (Arakawa ward) to 52% (Chiyoda ward) of existing tap water usage.
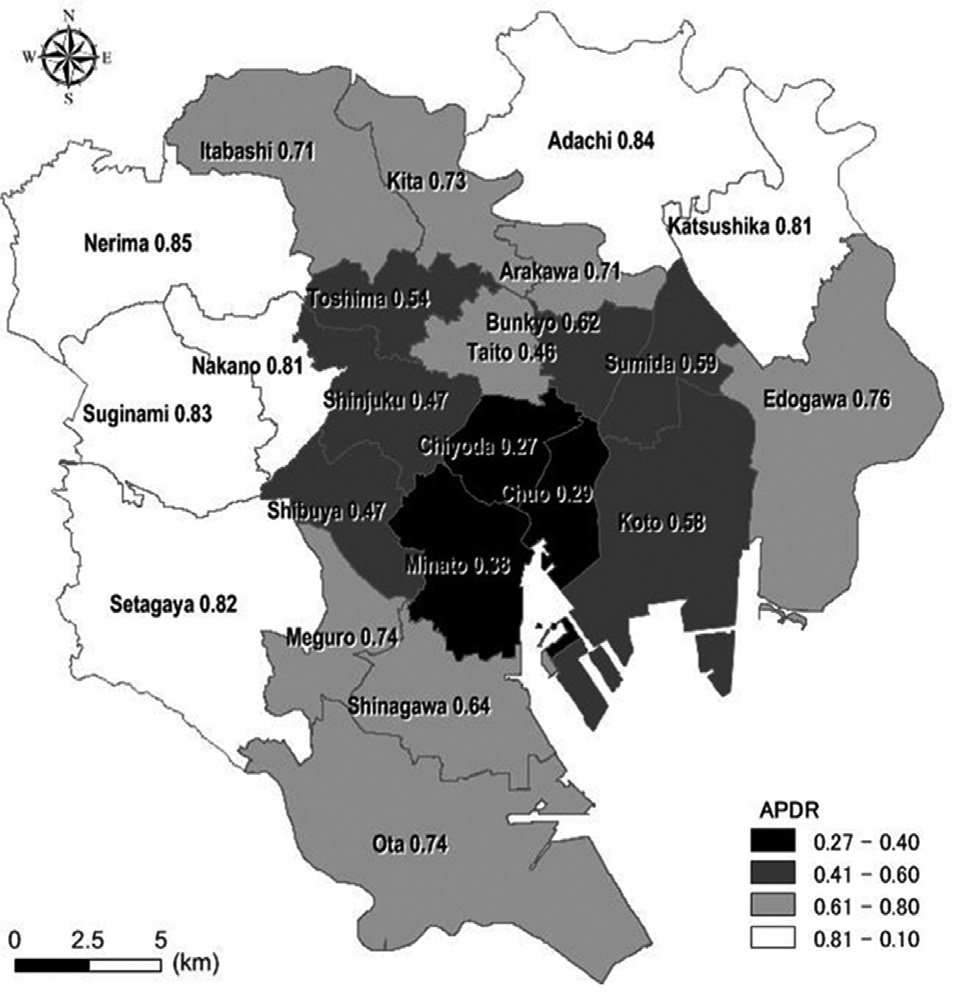
Fig. 5 shows the area precipitation-demand ratio (APDR), indicating the rainwater utilization potential compared to miscellaneous water demand, for the Tokyo wards. Using the data for miscellaneous water demand by building type as equivalent rainfall of Table 2, we define the APDR using the following equation.
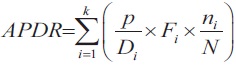
Here, i is the building purpose type identification factor, k is the number of building types (k = 6), D is miscellaneous water demand (mm), P is annual precipitation, F is average number of building floors, n is number of buildings of each type, and N is the total number of buildings covered. The feasibility of rainwater collection facility installation is not included in the equation.
Rainwater utilization potential differs between the central areas around Chiyoda ward, which contain high concentrations of office and commercial buildings, and the surrounding areas, which contain many residential buildings, while the areas inbetween are well represented as with a mixture of both kinds of buildings. The six wards―Nerima, Adachi, Suginami, Setagaya, Nakano, and Katsushika―have high rainwater utilization potential of APDR 0.8 or above. Chiyoda and Chuo wards, on the other hand, have low rainwater utilization potential of 0.3 or below. These results indicate the need for different rainfall utilization plans in residential areas and in office and commercial areas. In the residential areas, for example, it should be possible to meet a significant part of miscellaneous water demands with roof rainwater,
whereas in office and commercial areas roof water collection alone is not enough, making it necessary to install largescale rainwater harvesting facilities on relatively large public areas such as parks, in order to make extensive use of reclaimed water.
3.4. Benefits of Rainwater Harvesting and Using Building Roof
To evaluate the benefits of introducing rainwater harvesting facilities, we considered a scenario in which facilities for collecting up to 50 mm of rainfall are introduced for all buildings in each ward. The amount of rainfall that can be utilized by collecting and using building roof rainfall was calculated to be 573, 679, 819, 766, 930, and 787 (mm, equivalent rainfall) for residential houses, offices, department stores, supermarkets, restaurants, and accommodation, respectively.
Based on the ratios of building types in each ward, the amounts of miscellaneous water demand for each building type and rainwater available for those uses are shown in Fig. 6. Harvesting rainwater from building roofs throughout Tokyo wards, based on the aforementioned assumptions, would recover a maximum of 102.76 × 10⁶ m3 of rainwater for miscellaneous water uses. This amount is equivalent to 9.2% of the annual tap water supply and 26.2% of the annual miscellaneous water demand in the Tokyo wards. Of the 23 wards, rainwater utilization would be greatest in Setagaya ward (10.2 × 10⁶ m3), Nerima ward (7.9 × 10⁶ m3), and Ota ward (7.6 × 10⁶ m3), equivalent to 47%, 48%, and 57% of their respective residential house miscellaneous water demand.
In the Tokyo wards, buildings cover 27% of the total administrative area, and therefore can be very effective in harvesting and storing rainwater. One of the good examples of large scale rainwater harvesting facility is Ryogoku Kokugikan (Sumo wrestling arena) in Tokyo. Another symbolic example is a rainwater tank at Tokyo Dome, which is not only utilized for rainwater harvesting, but also for flood control and as an emergency water supply. In managing water resources properly geared to the complex water use structures in urban areas, it is important to use buildings as basic units of water usages while taking into account the different water use patterns in different building types and determining the water use balance. In this study, we considered the miscellaneous water demand of each building type in the Tokyo wards as well as the distribution features in each ward and then clarified the difference in rainwater utilization potential and benefits between commercial and residential areas.
The water resource obtained by rainwater harvesting facilities should be useful in reducing the water supply burden and enabling urban areas to obtain stable water resources. In business centers such as Chiyoda ward with concentrated water demands, it will be more feasible to consider not only using rainwater but also combining this with other alternative water resources such as reclaimed water.