검색 전체 메뉴
PDF
맨 위로
OA 학술지
Comparison of Major Nutrients in Eels Anguilla japonica Cultured with Different Formula Feeds or at Different Farms
  • 비영리 CC BY-NC
  • 비영리 CC BY-NC
ABSTRACT
Comparison of Major Nutrients in Eels Anguilla japonica Cultured with Different Formula Feeds or at Different Farms
KEYWORD
Anguilla japonica , Vitamin A , Vitamin E , Cholesterol , Fatty acids
  • Introduction

    Anguilla includes 19 species of eel distributed worldwide. Among these, the Japanese eel Anguilla japonica and European eel Anguilla anguilla are popular health foods in southeast Asia (mainly Japan, Korea, Taiwan, and China) and European countries (mainly Italy and Netherlands), respectively, as these species are rich in protein, fat, minerals, and vitamins compared to other fish species. In addition, these eels are common freshwater fish that have been cultured for a very long time (Liao, 2002). The eel aquaculture industry in these countries has been growing every year; for example, in Korea, production increased from 2,739 tons in 2000 to 6,766 tons in 2009 (Son et al., 2011).

    Eels are catadromous species that hatch in the sea but migrate as elvers (pre-juveniles) to freshwater to grow to adulthood. Artificial eel-spawning and even aquaculture of the complete life cycle have been conducted, and some experimental efforts have been successful (Ohta and Tanaka, 1997; Ohta et al., 1997; Kim et al., 2007; Kagawa et al., 2009). However, the supply of elvers for aquaculture still depends on natural resources which is the principal restriction on the volume of eel culture. In addition, elver arrest, especially in A. japonica, is not constant every year, and the number of elvers has been drastically reduced due to indiscriminate catching. As an alternative, the Atlantic eel A. anguilla has been cultured at several farms in Japan, Korea, and China, but the results have so far been less than satisfactory because of disease and nutritional problems. In addition to price increases for A. japonica elvers, overall changes to eel culture, such as increases in the cost of raw materials for formula feeds (FFs), labor costs, and various expenses, have maintained constant pressure on eel farmers. In response, researchers have examined the use of FFs with no or reduced amounts of fish meal; how to lower the mortality rate; the development of functional feed additives; the application of high-density culture; and the relationships between rearing tank size and stocking density, between body weight and stocking density, and between body weight and daily feeding rate (Bae et al., 2008; Choi et al., 2008; Kim et al., 2008; Hwang et al., 2010; Son et al., 2011).

    We previously reported that the major nutrients (vitamins A and E, cholesterol, and fatty acid composition) of A. japonica eels cultured in Korea differ across farms. We also suggested that differences in FFs or in the physiochemical culture environments used at each farm may affect the nutritional content of eels (Cho et al., 2011). In the present study, we evaluated the relative importance of these two main factors (feeding diet and physiochemical culture environment) for the accumulation of major nutrients in cultured eels.

    Materials and Methods

      >  Eels and culture conditions

    Eels A. japonica (about 300-350 g) were provided by five commercial eel aquaculture farms located in Jeollanam-do and Jeollabuk-do, Korea; each farm uses an FF from a different company. From each farm, three eels were randomly selected, and only fresh eel meat, excluding the head, bone, and innards, was used for analysis. Eels for analysis were collected from each farm on 20 January 2011. We did not consider differences in elver stocking time, physiochemical conditions for culture, or culture period. In experiments to compare growth rates and specific nutrient contents (proximate composition, vitamins A and E, cholesterol, and fatty acids) of eels on diets of various commercial FFs (two domestically produced brands, one domestic brand produced by original equipment manufacturing in Japan, and one Taiwanese brand), 1 kg worth of eels (20-30 g each) were transferred to a water tank (1 ton) installed at Chenogsan Eel Farm Co. (Yeonggwang, Korea). The eels were fed 1.5-2.0% of their body weight in FF per day for 5 weeks, and their weight gain was measured. The entire eel body was used for analysis. In the feeding experiments to measure weight gain, feed remaining 30 min after feeding was recovered and stored in the freezer; after it was dry, the feed was weighed, and that weight was subtracted from the total feed weight.

      >  Analysis of general compounds

    The proximate composition of general compounds (water content, crude protein, crude lipids, and ash) contained in cultured eels was analyzed using Association of Official Analytical Chemists methods (1995). Water and fat contents were measured using a CEM automatic extractor (Labwave 9000/ FAS 9001; CEM Corp., Matthews, NC, USA). Protein was analyzed using a Kjeltec System (Kjeltec Auto 2400/2460; Foss Tecator AB, Hoganas, Sweden), and ash was measured using an ash analyzer (Mas 7000; CEM Corp.). In addition, the proximate composition of various adult eel FFs that were on sale in October 2011 were also determined using the above methods.

      >  Analysis of vitamin A and E

    For analyses of vitamins A (VA) and E (VE), 0.5 g freezedried sample, 3 mL 95% ethanol (EtOH), and 0.5 m 10% pyrogallol/EtOH were added to a test tube and mixed well. Then 1 mL 50% KOH solution was added to the tube, and the sample was saponified in a 95℃ water bath for 30 min and cooled rapidly on ice. Then we mixed in 3 mL distilled water and petroleum ether (v/v), after which only the petroleum ether layer was collected. This step was repeated three times. The resulting solution was filtered using anhydrous Na2SO4 to remove moisture and then evaporated using a rotary evaporator. The concentrate was dissolved in 1 mL isopropyl alcohol for VA analysis or in 1 mL hexane for VE. After filtration through a 0.2 μm membrane filter, the solution underwent HPLC analysis for vitamin content using an HPLC column (μ-Porasil, 4.6 × 250 nm; Waters, Milford, MA, USA) and nhexane: isopropanol (99.92:0.08, v/v, isocratic mode) as the mobile phase. The flow rate was 1 mL/min. Detection was conducted at 336 nm for VA and at 280 nm for VE, using a UV/ VIS detector (Model 2489; Waters).

      >  Analysis of cholesterol

    One gram of freeze-dried sample and 3 mL 95% EtOH were added to a test tube and extracted using sonication for 30 min. Subsequently, 1 mL 50% KOHA was added to the tube, and the solution was incubated in a 50℃ water bath for 1 h and then cooled rapidly on ice. Next, 5 mL hexane was added to the solution, and after mixing for 5 min, 1 mL of the upper layer (organic layer) was removed and evaporated to dryness using N2 gas. Then we added 3 mL Liebermann-Burchard reagent, and the sample was vortexed and placed at room temperature for 30 min. Then the absorbance was measured at

      >  Analysis of fatty acids

    Extractions for fatty acid analysis followed the procedure of Folch et al. (1957), and the extract was methylated according to Morrison and Smith’s method (1964). The supernatant of methylated extract was removed and stored at -80℃. The analysis was conducted using a gas chromatograph equipped with an autoinjector (Varian 3400; Varian, Oshawa, ON, Canada). The instrumental conditions are described in Cho et al. (2011).

      >  Statistical analysis

    All measurements were performed in triplicate. The results of all measurements are expressed as means ± SD. If necessary, results were analyzed using one-way ANOVA with a 95% confidence level.

    Results and Discussion

    We reported previously that the major nutritional ingredients in cultured eels significantly varied across eel farms (Cho et al., 2011). To determine the mechanism driving this result, we must first examine the extent to which differences in FFs or in physical/chemical conditions among farms affect the main nutritional content of eels. Five different eel farms, each using just one of four FFs from different companies to feed mature eels, were selected for analyzing the levels of VA, VE, cholesterol, and fatty acids in mature eels (about 300-350 g) at each farm. In addition, for comparative evaluation among FFs under the same environmental conditions, 15 1-ton tanks were installed at Farm A (in Yeonggwang-gun, Jeollanam-do, Korea), and the above ingredients were analyzed after feeding eels (25-30 g) each FF for 6 weeks.

    The proximate composition of nutrients (i.e., water content, crude protein, crude lipids, ash, calcium, phosphorous, and crude fiber) must be determined to register FFs for fish in Korea (Statute Book for Feed Management, 2002). The contents of several main nutritional ingredients ((VA, VE, and fatty acids) of eels were determined for eels fed the four different

    [Table 1.] The comparison of proximate compositions between four different formula feeds for mature eel culture

    label

    The comparison of proximate compositions between four different formula feeds for mature eel culture

    types of FFs (Tables 1 and 2).

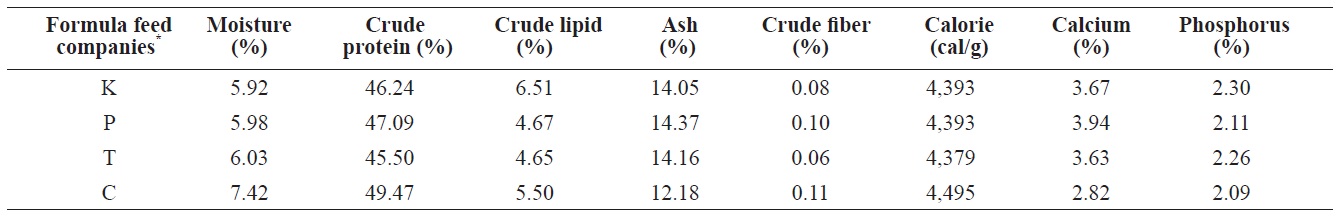
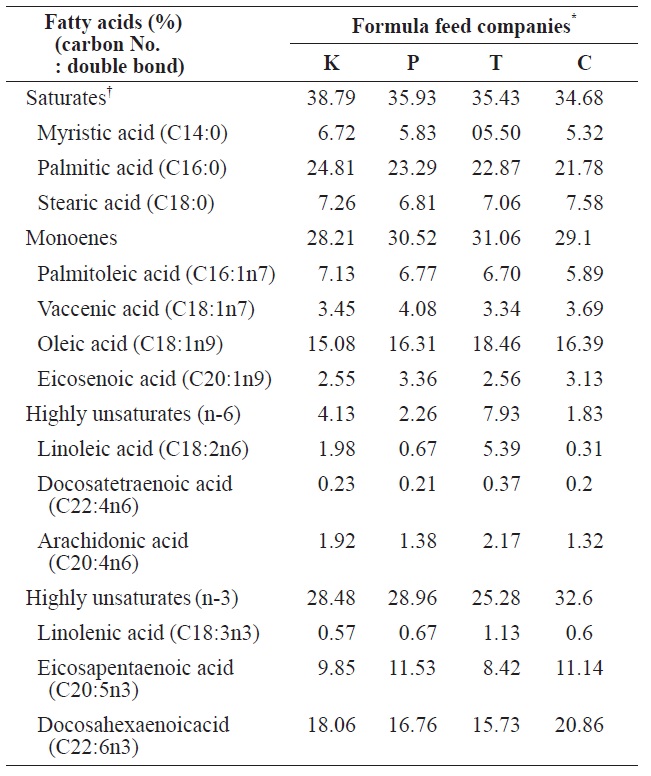
    The proximate composition of adult eel FFs was also determined (Table 1). Moisture content ranged from 5.92% (K Co. FF) to 7.43% (C Co. FF). Crude protein levels, a main factor determining both eel growth and the feed efficiency of an FF, did not significantly differ across the four FFs, ranging from 45.5% (T Co. FF) to 49.47% (C Co. FF). The protein requirements of eels depend on size and species, but protein content must be approximately 45-50% (Arai et al., 1971; Nose and Arai, 1973; Degani et al., 1985 Han et al., 2005). Crude lipids, which contain essential fatty acids needed for the normal growth and survival of fish, ranged from 5.5% (C Co. FF) to

    [Table 2.] The comparison of fatty acids compositions between four different formula feeds for mature eel culture

    label

    The comparison of fatty acids compositions between four different formula feeds for mature eel culture

    6.51% (K Co. FF). Ash and crude fiber contents ranged from 0.11% (C Co. FF) to 14.37% (P Co. FF) and from 0.08% (K Co. FF) to 12.18% (C Co. FF), respectively, and these variables did not significantly differ among the tested FFs. Calories ranged from 4,379 cal/g (T Co. FF) to 4495 cal/g (C Co. FF), calcium content ranged from 2.82% (C Co. FF) to 3.67% (K Co. FF), and phosphorous content ranged from 2.11% (C Co. FF) to 2.3% (K Co. FF). Because the fatty acid composition of FFs has been shown to affect the growth and fatty acid composition of cultured eels (Takeuchi et al., 1980; Bae et al., 2004), the fatty acid composition of the four FFs was also analyzed. Saturated fatty acids (SFA) and monounsaturated fatty acids (MUFA) did not differ among the four FFs. In contrast, the highly unsaturated fatty acid (HUFA) ω-6 HUFA ranged from 1.83% (C Co. FF) to 7.93% (T Co. FF), and ω-3 HUFA levels were highest in C Co. FF (32.6%) and lowest in T Co. FF (25.28%). These differences may have been caused by differences in the type of fish meal or oil used as feed additives.

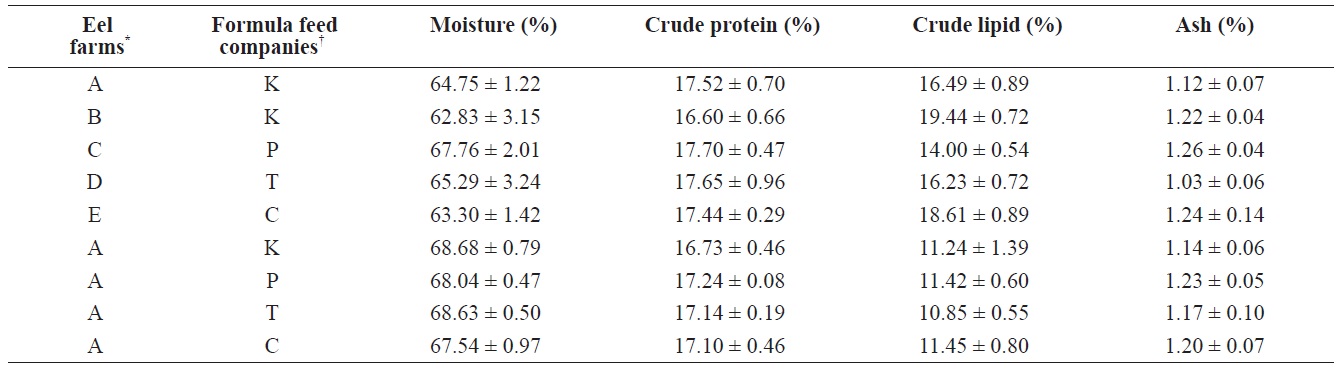
    For the eels fed the four different FFs at the same eel farm, the proximate composition analysis revealed no significant differences in moisture (67.5 ± 1.0% to 68.7 ± 0.8%), crude protein (16.7 ± 0.5% to 17.2 ± 0.1%), crude lipids (10.9 ± 0.6% to 11.5 ± 0.8%), or ash (1.1 ± 0.1% to 1.2 ± 0.1%), suggesting that although the proximate composition did vary somewhat among FFs and between domestic and imported FFs, these differences were not large enough to affect the quality or proximate composition of cultured eels. In contrast, the results from eels cultured at the five different farms were markedly different. Across the five farms, moisture content of the eels ranged from 62.8 ± 3.2% (Farm B, K Co. FF) to 67.8 ± 2.0% (Farm C, P Co. FF), but values did not significantly differ among farms. Crude protein levels were lower in eels from Farm B (16.6 ± 0.7%), but the values from the other farms were similar (about 17.5%). Crude lipids in cultured eels significantly differed across farms; eels from Farm B had the highest crude lipid content (K Co. FF, 19.4 ± 0.7%), whereas

    [Table 3.] The comparison of proximate compositions between eels fed with four different formula feeds for mature eels and between eels cultured at 5 different eel farms where eels fed with one of the four different formula feeds

    label

    The comparison of proximate compositions between eels fed with four different formula feeds for mature eels and between eels cultured at 5 different eel farms where eels fed with one of the four different formula feeds

    those from Farm C had the lowest crude lipid content (P Co. FF, 14.0 ± 0.5%). Ash content did not significantly differ across either the four FFs or the five farms (Table 3). Because the difference between domestic FF brands was not significant, the effect on the proximate composition of eels was not expected to be significant. However, because the proximate compositions of eels from farms that used different FF brands did significantly differ, differences in the physical or chemical environments of each farm likely strongly affected the major proximate composition of cultured eels.

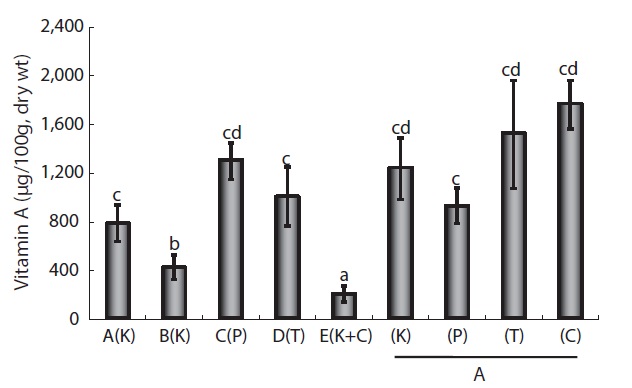
    The VA content of wild mature eels is typically 1 mg/100 g dry weight (wt; about 3,500 IU), although values vary depending on the species and tissue analyzed. In addition, VA levels tend to increase with the age and size of fish (Edisbury et al., 1937; Cho et al., 2006). VA content differed among the four FFs, but values were very low compared to those in eels (data not shown). VA content differed among eels fed the four different FFs; values were highest in those fed C Co. FF (1.76 ± 0.3 mg/100 g dry wt) and lowest in those fed P Co. FF (0.92 ± 0.25 mg/100 g dry wt), indicating that VA content may be somewhat correlated with the content in FFs. Across the five farms that used different FFs, differences in VA content were more remarkable, being highest (1.3 ± 0.25 mg/100 g dry wt) in eels from Farm C (P Co. FF) and lowest (0.42 ± 0.2 mg/100 g dry wt) in those from Farm E (T Co. FF) (Fig. 1). The differences in eel VA content among FFs and among farms were not significant, suggesting that differences in culture techniques or culture environments more strongly affect the VA content of eels compared to variation in VA content of different FFs.

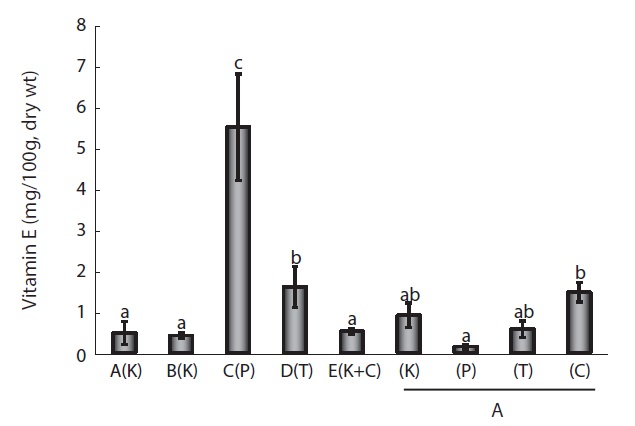
    VE (α-tocopherol) content was compared in the same samples as described above for VA (Fig. 2). Tocopherol in cultured eels is composed of primarily the α-type and small amounts of the β- and γ-types (Cho et al. 2011). VE levels in wild eels are 4-7 mg/100 g dry wt, and the content of cultured eel muscle in Japan is 21-37 mg/100 g dry wt, which serves as an indicator of the quality of cultured eel (Furuita et al., 2009). Compared

    to eels fed each of the four FFs, those fed the C Co. product had the highest VE levels (1.47 ± 0.5 mg/100 g dry wt), whereas those fed the P Co. product had the lowest (0.15 ± 0.1 mg/100 g dry wt); however, overall values were not high compared to the content in cultured eels. In eels cultured at the five different farms, those from Farm C had the highest content (5.5 ± 2.3 mg/100 g dry wt), while eels from the other farms ranged from 1.6 ± 1.0 to 0.42 ± 0.2 mg/100 g dry wt. Based on

    these results, differences in VE levels among commercial FFs appeared to affect the VE content of cultured eels. Moreover, the environmental differences in cultures across farms also affected VE content. In summary, the fat-soluble VA and VE contents in fresh eel varied depending on the commercial FF used. Vitamin levels were much more strongly affected by the culture environment, including differences in water purity, the types of microorganisms present, and whether vitamin supplements were administered.

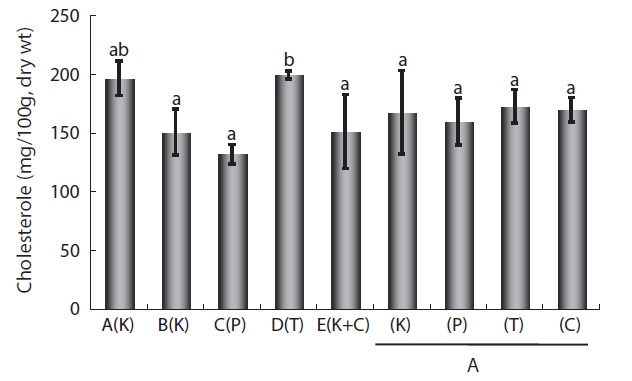
    In an experimental system, Burgos et al. (1990) demonstrated that cholesterol, a major nutritive component of eels, constituted nearly 7.5% of total lipids in the liver and about 1% in the muscle of control eels. Cholesterol content in fish was proportional to the amount of lipids, and lipid content was affected by various environmental (diet, season, water temperature) and biological factors (age, sex, size). However, these factors do not necessarily lead to significant changes in protein and ash contents (Jeong et al., 1998). Thus, we determined whether cholesterol content varied across cultured eels fed different FFs and among eels cultured at different eel farms. For eels fed one of the four FFs under the same culture conditions (i.e., at the same farm), cholesterol content ranged from 172 ± 10 mg/100 g dry wt to 159 ± 3 mg/100 g dry wt and did not significantly differ among FF types, which was consistent with the lack of a significant difference in the crudelipid content of eels fed the different FFs (Table 2). However,similar to the results for VA and VE contents, cholesterol content significantly differed for eels cultured at the five different farms the highest content was 198.6 3.4 mg/100 g dry wt at Farm A (K Co. FF), and the lowest content was 131.4 6.8 mg/100 g dry wt at Farm C (P Co. FF) (Fig. 3), these differences did not appear to be correlated with the type of FF and were likely related to the farm itself, i.e., the eel culture environment. Although the cholesterol content and fattyacid content of eels differed across the five different farms, the lower levels of cholesterol and fatty acids in Farm C eels are likely related to each other.

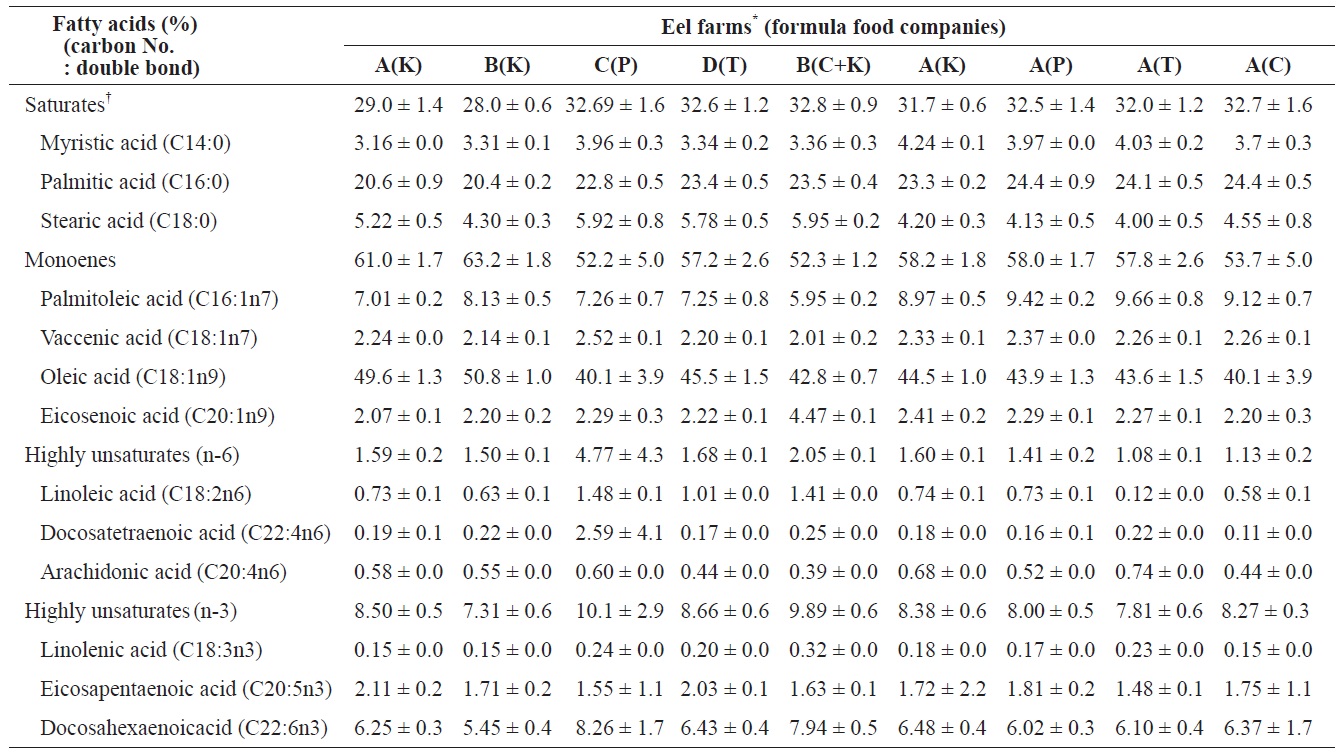
    The SFA, MUFA, and HUFA of cultured eel flesh/whole body eel were compared (Table 4). SFA and MUFA did not significantly differ across eels fed different FFs, whereas -6HUFA did significantly vary among FFs. Values of ω-6 HUFA in eels fed K Co., P Co., C Co., and T Co. FFs were 1.60 0.1%, 1.41 ± 0.2%, 1.13 ± 0.2%, and 1.08 ± 0.1%, respectively, whereas the values of ω-3 HUFA in eels at the same farms/ FFs were 8.38 ± 0.6%, 8.0 ± 0.52%, 8.27 ± 0.29%, and 7.81 ± 0.55%; however, ω-3 HUFA did not significantly differ across farms (P > 0.05). Of the ω-3 HUFAs that have nutritional implications, eicosapentaenoic acid (EPA) did not significantly differ among eels fed different FFs, except for slightly lower levels (1.48 ± 0.1%) in those fed T Co. FF. Docosahexaenoic acid (DHA) levels ranged from 6.48% to 6.02% and did not significantly vary among eels fed different FFs. Bae et al. (2004) reported that the dietary addition of EPA or DHA in young eel cultures did not affect the growth of eels or the EPA or DHA content, although the ratio of linoleic acid (n-6) to

    [Table 4.] The fatty acids compositions in total lipids of eels fed with four different formula feeds for mature eels and between eels cultured at the five different eel farms where eels fed with one of the four different formula feeds

    label

    The fatty acids compositions in total lipids of eels fed with four different formula feeds for mature eels and between eels cultured at the five different eel farms where eels fed with one of the four different formula feeds

    linolenic acid (n-3) in eel food did affect the composition of fatty acids. However, as shown in the present study (Tables 2 and 4), the differences in HUFA content among FFs did not significantly affect the composition of fatty acids in mid-sized eel cultures. In fact, previous studies have reported that the composition of fatty acids is also affected by lack of food or non-nutritional factors including water temperature (Watanabe et al., 1983; Satoh et al., 1984; Bell et al., 1986).

    Similar to VA, VE, and cholesterol, the levels of some fatty acids significantly varied across eels cultured at different farms. SFA ranged from 32.7 ± 1.6% (Farm C, P Co. FF) and 32.6 ± 1.2% (Farm D, S Co. FF) to 29.0 ± 1.4% (Farm A, K Co. FF) and 28.0 ± 0.6% (Farm B, K Co. FF). MUFA was highest at Farm B (63.2 ± 1.8%) and lowest at Farm C (52 ± 5.0%) and significantly differed across eels cultured at different farms. ω-6 HUFA and ω-3 HUFA also significantly varied among farms, with the highest values at Farm C (4.77 ± 4.3% and 10.1 ± 2.9%, respectively) and the lowest values at Farm B (1.5 ± 0.1% and 7.31 ± 0.6%, respectively). Of the ω-3 HUFAs, EPA ranged from highest to lowest at Farm A (2.11 ± 0.2%), Farm D (2.03 ± 0.1%), Farm B (1.71 ± 0.2%), and Farm C (1.55 ± 1.1%), whereas DHA exhibited values in the following order: Farm C (8.26 ± 1.7%), Farm D (6.43 ± 0.4%), Farm A (6.25 ± 0.3%), and Farm B (5.45 ± 0.4%). The composition of fatty acids in cultured eels did not significantly differ across farms, in contrast to previous reports by Choi et al. (1985) (SFA, 30.5%; MUFA, 53.6%; HUFA, 8.0%) and Cho et al. (2011) (SFA, 30.5 ± 1.3% to 33.0 ± 0.5%; MUFA, 59.9 ± 2.0 to 55.8 ± 0.5%; HUFA, 8.0 ± 0.5% to 9.2 ± 0.7%). The difference in the composition of fatty acids among FFs was not as high as expected, which may account for the small difference in quality between domestic and imported FFs. On the other hand, because fatty acid composition differs somewhat between eels cultured in a still-water system” anda water-recirculation system (Cho et al., 2011), our results also suggest that environmental differences experienced by cultured eels at different farms could more strongly affect thefatty acid composition than differences among eels fed differentFFs. In particular, Farm C exhibited higher values of ω-6 and -3 HUFA compared to the other eel farms, suggesting that the culture conditions at Farm C have certain advantages. An operator of Farm C mentioned that they use special methods based on their experiences, but these methods have not been empirically proven and thus require more detailed experimental study.

    In conclusion, eel-culture techniques still must be standardized and systematized to produce high-quality eels. In particular, while eel quality did not significantly differ between eels fed domestic or imported FFs and because domestic FFs cannot be considered superior to Japanese eel FFs, domestic FFs must be improved. In addition, because significant differences in eel quality were observed among eel farms, it is necessary to determine the specific environmental factors that affect eel quality. Further studies focused on identifying these factors and applying culture techniques for high-quality eel culture are needed.

참고문헌
  • 1. 1995 Official Methods of Analysis. google
  • 2. Arai S, Nose T, Hashimoto Y 1971 A purified test diet for the eel, Anguilla japonica. [Bull Freshw Fish Res Lab (Tokyo)] Vol.21 P.161-178 google
  • 3. Bae JY, Han KM, Park GJ, Bai SC 2004 Studies on requirements of optimum dietary essential fatty acids in juvenile eel, Anguilla japonica. [J Aquac] Vol.17 P.275-281 google
  • 4. Bae JY, Han K, Lee JH, Kim SE, Lee JY, Bai SC 2008 Effects of dietary quartz porphyry and feed stimulants, BAISM supplementation on growth performance and disease resistance of juvernile eel, Anguilla japonica. [J Aquac] Vol.21 P.26-33 google
  • 5. Bell M, Henderson RJ, Sargent JR 1986 The role of polyunsaturated fatty acids in fish. [Comp Biochem Physiol B] Vol.83 P.711-719 google
  • 6. Burgos C, Castillo M, Zafra MF, Garcia-Peregrin E 1990 Influence of fatty acid composition of diet on cholesterol content of eel liver and muscle. [Arch Int Physiol Biochim] Vol.98 P.1-6 google cross ref
  • 7. Cho HS, Choi JH, Koh HB, Seo JS, Ahn JC 2011 Evalution of major nutrients of domestic farmed eels Anguilla japonica. [Kor J Fish Aquat Sci] Vol.44 P.237-242 google
  • 8. Cho YJ, Jung HJ, Kim YC, Oh SM, Son MJ, Kim SM, Shim KB 2006 Optimal process of eel hot-water for proper edible volume. [J Fish Mar Sci Edu] Vol.18 P.374-378 google
  • 9. Choi JH, Rhim CH, Bae TJ, Byun DS, Yoon TH 1985 Studies on lipids in fresh-water fishes. 7. Comparison of lipid components among wild and cultured eel (Anguilla japonica), and conger eel (Astroconger myriaster). [Bull Korean Fish Soc] Vol.18 P.439-446 google
  • 10. Choi SH, Park KH, Yoon TJ, Kim JB, Jang YS, Choe DH 2008 Dietary Korean mistletoe enhances cellular non-specific immune responses and survival of Japanese eel (Anguilla japonica). [Fish Shellfish Immunol] Vol.24 P.67-73 google cross ref
  • 11. Degani G, Horowitz A, Levanon D 1985 Effect of protein level in purified diet and of density, ammonia and O2 level on growth of juvenile European eels (Anguilla anguilla L.). [Aquaculture] Vol.46 P.193-200 google cross ref
  • 12. Edisbury JR, Lovern JA, Morton RA 1937 Distribution of vitamin A in the tissues of the eels Anguilla vulgaris and A. aucklandi Rich. [Biochem J] Vol.31 P.416-423 google
  • 13. Folch J, Lees M, Sloane-Stanley GH 1957 A simple method for the isolation and purification of total lipides from animal tissues. [J Biol Chem] Vol.226 P.497-509 google
  • 14. Furuita H, Ishida T, Suzuki T, Unuma T, Kurokawa T, Sugita T, Yamamoto T 2009 Vitamin content and quality of eggs produced by broodstock injected with vitamins C and E during artificial maturation in Japanese eel Anguilla japonica. [Aquaculture] Vol.289 P.334-339 google cross ref
  • 15. Han KM, Bae JY, Eme OO, Go SH, Yoo JH, Bai SC 2005 Evaluation of the optimum dietary protein to energy ratio of juvenile Japanese eel, Anguilla japonica. [J Aquac] Vol.18 P.135-141 google
  • 16. Hwang JH, Lee SW, Rha SJ, Jeong DH, Han KH, Shin TS 2010 Nutritional characteristics of eels (Anguilla japonica) fed a diet of Yuza (Citrus junos Sieb ex Tanaka). [Korean J Fish Aquat Sci] Vol.43 P.573-580 google cross ref
  • 17. Jeong BY, Choi BD, Lee JS 1998 Proximate composition, cholesterol and α-tocopherol content in 72 species of Korean fish. [J Kor Fish Soc] Vol.31 P.160-167 google
  • 18. Kagawa H, Kasuga Y, Adachi J, Nishi A, Hashimoto H, Imaizumi H, Kaji S 2009 Effects of continuous administration of human chorionic gonadotropin, salmon pituitary extract, and gonadotropin-releasing hormone using osmotic pumps on induction of sexual maturation in male Japanese eel, Anguilla japonica. [Aquaculture] Vol.296 P.117-122 google cross ref
  • 19. Kim DJ, Kang EJ, Bae JY, Park MW, Kim EO 2007 Development of the eggs and pr-leptocephalus larvae by natural spawning of artificially-matured Japanese eel, Anguilla japonica. [J Aquac] Vol.20 P.160-167 google
  • 20. Kim JD, Woo SH, Kim YC, Lee JH, Cho YC, Choi SM, Park SI 2008 The effects of yeast β-glucan in the diet on immune response of Japanese eel, Anguilla japonica, by oral administration. [J Fish Pathol] Vol.21 P.219-228 google
  • 21. Liao IC 2002 Aquaculture development strategies in Asia for the 21st. In: Report of the APO Study Meeting on Sustainable Fishery Management, Sustainable Fishery Management in Asia. Oliver RAR, ed. P.85-102 google
  • 22. Morrison WR, Smith LM 1964 Preparation of fatty acid methyl esters and dimethylacetals from lipid with boron fluoride methanol. [J Lipid Res] Vol.5 P.600-608 google
  • 23. Nose T, Arai S 1973 Optimum level of protein in purified diet for eel, Anguilla japonica. [Bull Freshw Fish Res Lab Tokyo] Vol.22 P.145-155 google
  • 24. Ohta H, Tanaka H 1997 Relationship between serum levels of human chorionic gonadotropin (hCG) and 11-ketotestosterone after a single injection of hCG and induced maturity in the male Japanese eel, Anguilla japonica. [Aquaculture] Vol.153 P.123-134 google cross ref
  • 25. Ohta H, Kagawa H, Tanaka H, Okuzawa K, Iinuma N, Hirose K 1997 Artificial induction of maturation and fertilization in the Japanese eel, Anguilla japonica. [Fish Physiol Biochem] Vol.17 P.163-169 google cross ref
  • 26. Satoh S, Takeuchi T, Watanabe T 1984 Effect of starvation and environmental temperature on proximate and fatty acid composition of Tilapia nilotica. [Bull Jpn Soc Sci Fish] Vol.50 P.79-84 google cross ref
  • 27. Son MH, Kim KW, Kim KD, Kim SK 2011 State of aquaculture management for optimal rearing of eel Anguilla japonica. [Korean J Fish Aquat Sci] Vol.44 P.359-365 google cross ref
  • 28. Takeuchi T, Arai S, Watanabe S, Shimma Y 1980 Requirement of eel Anguilla japonica for essential fatty acids. [Bull Jpn Soc Sci Fish] Vol.46 P.345-353 google cross ref
  • 29. Watanabe T, Kitajama C, Fuhita S 1983 Nutritional values of live organisms used in Japan for mass propagation of fish: a review. [Aquaculture] Vol.34 P.115-143 google cross ref
OAK XML 통계
이미지 / 테이블
  • [ Table 1. ]  The comparison of proximate compositions between four different formula feeds for mature eel culture
    The comparison of proximate compositions between four different formula feeds for mature eel culture
  • [ Table 2. ]  The comparison of fatty acids compositions between four different formula feeds for mature eel culture
    The comparison of fatty acids compositions between four different formula feeds for mature eel culture
  • [ Table 3. ]  The comparison of proximate compositions between eels fed with four different formula feeds for mature eels and between eels cultured at 5 different eel farms where eels fed with one of the four different formula feeds
    The comparison of proximate compositions between eels fed with four different formula feeds for mature eels and between eels cultured at 5 different eel farms where eels fed with one of the four different formula feeds
  • [ Fig. 1. ]  The comparison of vitamin A contents between eels that cultured at several eel farms where different formula feeds were fed, and between eels that cultured at same eel farm where different formula feeds were fed. Letters outside brackets mean eel farms and letters inside brackets mean formula feed. Locations of each farm are as follows. A, Jeollanam-do, Yeongam-gun; B-D, Jeollabuk-do, Gochang-gun; E and F, Jeollanam-do, Yeonggwang-gun. K and P are goods produced domestically and T and C are formula feed imported from Japan and Taiwan company, respectively. All data are expressed as mean ± SE. Different letters indicates significant differences (P < 0.05) between the groups.
    The comparison of vitamin A contents between eels that cultured at several eel farms where different formula feeds were fed, and between eels that cultured at same eel farm where different formula feeds were fed. Letters outside brackets mean eel farms and letters inside brackets mean formula feed. Locations of each farm are as follows. A, Jeollanam-do, Yeongam-gun; B-D, Jeollabuk-do, Gochang-gun; E and F, Jeollanam-do, Yeonggwang-gun. K and P are goods produced domestically and T and C are formula feed imported from Japan and Taiwan company, respectively. All data are expressed as mean ± SE. Different letters indicates significant differences (P < 0.05) between the groups.
  • [ Fig. 2. ]  The comparison of vitamin E (tocopherol) contents between eels that cultured at several eel farms where different formula feeds were fed, and between eels that cultured at same eel farm where different formula feeds were fed. Letters outside brackets mean eel farms and letters inside brackets mean formula feed. Locations of each farm are as follows. A, Jeollanam-do, Yeongam-gun; B-D, Jeollabuk-do, Gochang-gun; E and F, Jeollanam-do, Yeonggwang-gun. K and P are goods produced domestically and T and C are formula feed imported from Japan and Taiwan company, respectively. All data are expressed as mean ± SE. Different letters indicates significant differences (P < 0.05) between the groups.
    The comparison of vitamin E (tocopherol) contents between eels that cultured at several eel farms where different formula feeds were fed, and between eels that cultured at same eel farm where different formula feeds were fed. Letters outside brackets mean eel farms and letters inside brackets mean formula feed. Locations of each farm are as follows. A, Jeollanam-do, Yeongam-gun; B-D, Jeollabuk-do, Gochang-gun; E and F, Jeollanam-do, Yeonggwang-gun. K and P are goods produced domestically and T and C are formula feed imported from Japan and Taiwan company, respectively. All data are expressed as mean ± SE. Different letters indicates significant differences (P < 0.05) between the groups.
  • [ Fig. 3. ]  The comparison cholestrol contents between eels that cultured at several eel farms where different formula feeds were fed, and between eels that cultured at same eel farm where different formula feeds were fed. Letters outside brackets mean eel farms and letters inside brackets mean formula feed. Locations of each farm are as follows. A, Jeollanam-do, Yeongam-gun; B-D, Jeollabuk-do, Gochang-gun; E and F, Jeollanam-do, Yeonggwang-gun. K and P are goods produced domestically and T and C are formula feed imported from Japan and Taiwan company, respectively. All data are expressed as mean ± SE. Different letters indicates significant differences (P < 0.05) between the groups.
    The comparison cholestrol contents between eels that cultured at several eel farms where different formula feeds were fed, and between eels that cultured at same eel farm where different formula feeds were fed. Letters outside brackets mean eel farms and letters inside brackets mean formula feed. Locations of each farm are as follows. A, Jeollanam-do, Yeongam-gun; B-D, Jeollabuk-do, Gochang-gun; E and F, Jeollanam-do, Yeonggwang-gun. K and P are goods produced domestically and T and C are formula feed imported from Japan and Taiwan company, respectively. All data are expressed as mean ± SE. Different letters indicates significant differences (P < 0.05) between the groups.
  • [ Table 4. ]  The fatty acids compositions in total lipids of eels fed with four different formula feeds for mature eels and between eels cultured at the five different eel farms where eels fed with one of the four different formula feeds
    The fatty acids compositions in total lipids of eels fed with four different formula feeds for mature eels and between eels cultured at the five different eel farms where eels fed with one of the four different formula feeds
(우)06579 서울시 서초구 반포대로 201(반포동)
Tel. 02-537-6389 | Fax. 02-590-0571 | 문의 : oak2014@korea.kr
Copyright(c) National Library of Korea. All rights reserved.