Age and growth of Hemibarbus labeo caught from Goe-san Lake in South Korea from March to November, 2011, were studied. A total of 201 specimens was collected, ranging from 110 to 580 mm in total length (TL). Males and females made up 47.9% and 52.1% of the sample, respectively. Marginal increment analyses showed that vertebral increments, each composed of one opaque and one hyaline zone, were deposited annually. Opaque edges were prevalent from June to July. The relationship between TL and vertebral radius was linear, with equations of R = 0.008TL - 0.208 (male) and R = 0.009TL - 0.272 (female). Regression equations between TL and total weight (TW) were TW = 9×10⁻⁶ TL2.987 (male), TW = 8×10⁻⁶ TL3.014 (female), and TW = 9×10⁻⁶ TL2.988 (combined sexes), according to the von Bertalanffy growth equation. Back-calculated TL was expressed using the von Bertalanffy equation as follows: Lt = 438.25(1 - e-0.175(t+0.164)) for males, Lt = 483.36(1 - e-0.147(t+0.115)) for females, and Lt = 464.86(1 - e-0.162(t+0.176)) for the sexes combined. The growth performances were 4.526, 4.536, and 4.544, respectively.
The barbel steed (
Studies of
et al. (1999). Xu et al. (2007) studied the effects of food and temperature on the growth of
In this study, vertebrae were used to determine the age of
>
Sampling and data collection
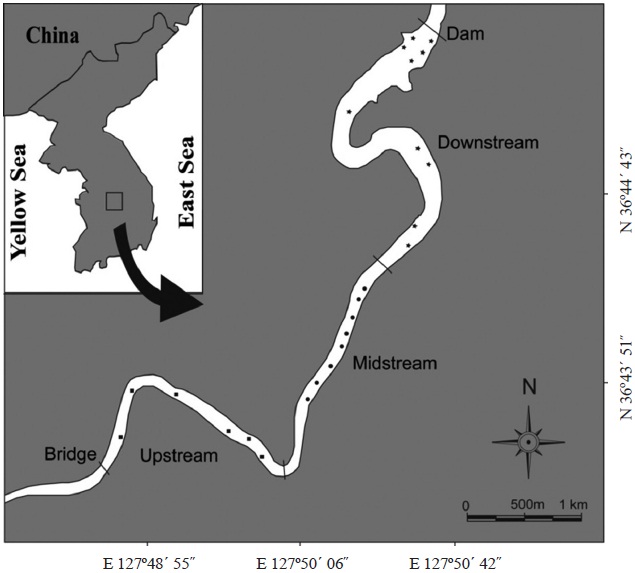
m; mesh size, 5.0 cm and 7.5 cm) in Goe-san Lake. In the field, the samples were kept in insulated cans with ice bags for transportation to the laboratory. In the laboratory, the specimens were measured (total length [TL]) and weighed (total weight [TW]). We macroscopically examined the gonads of both sexes of
The relationship between TL and TW was determined by fitting the data to a potential relationship for males and females using the equation:
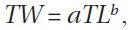
where
>
Vertebrae selection and preservation
The first to third vertebrae were removed and immersed in 8-10% potassium hydroxide for 24 h to remove the muscle and connective tissue. Then they were washed with running water, the remaining tissue was brushed out, and the vertebrae were fixed by immersion in 70% alcohol until further observation (Joung et al., 2005).
>
Determination of age and aging precision
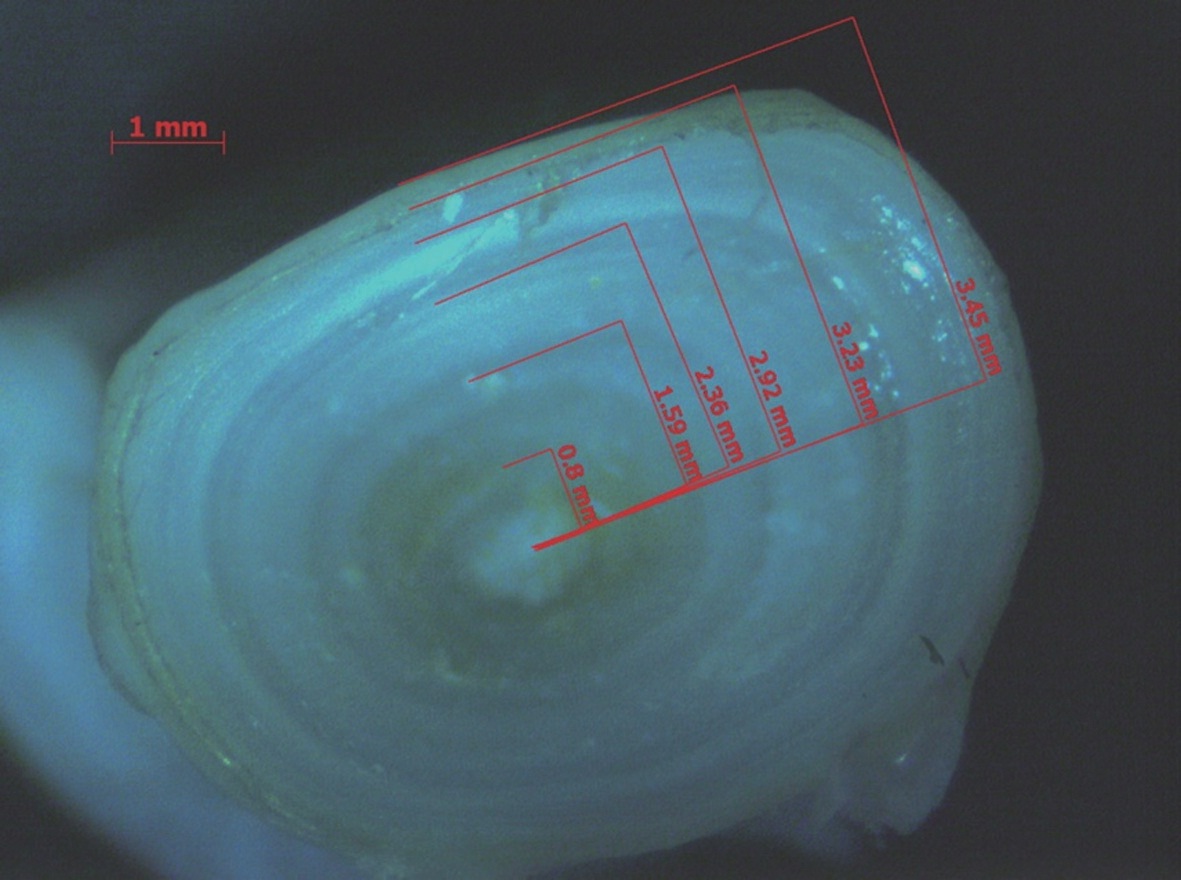
Ages were determined by counting the opaque zones in the vertebrae with an image processing system consisting of a computer, a video camera microscope (Zeiss DV8; Carl Zeiss, Jena, Germany) and the Optical Pattern Recognition System software package of Image-Pro Plus version 4.1 (Fig. 2).
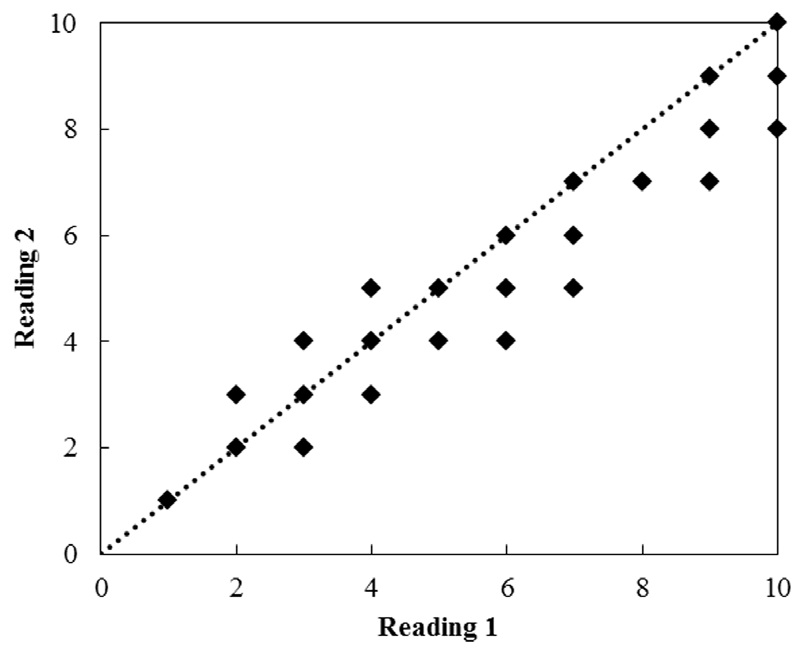
Vertebrae were read twice at an interval of 20 days. They were read randomly to avoid bias in assigning ages. The average percentage error (APE) and coefficient of variation (CV) were used to compare age readings (Beamish and Fournier, 1981):
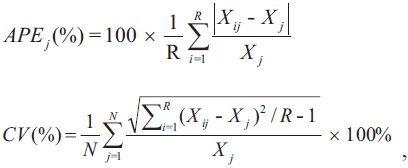
where R is the number of times each fish was aged,
To validate the rings as indicators of fish age, rings were counted and radii were measured. The number of rings must show a directly proportional relation to vertebra size and fish length to be considered a growth indicator. This relationship was assessed by linear regression using the Fraser-Lee equation (Francis, 1990):
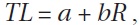
where
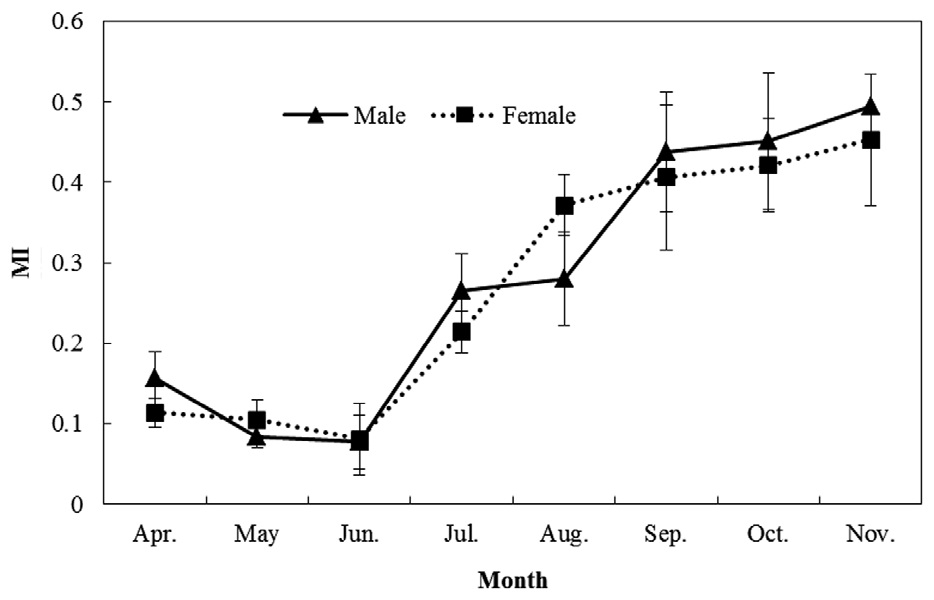
Marginal increment (MI) analysis was used to validate the periodicity of growth (Lai et al., 1996):
where
Measurements were used for back-calculating size from growth rings. Length at previous age was estimated based on the linear regression between TL and vertebral radius using the Fraser-Lee method (Natanson et al., 1995),
where [
The growth curve was modeled using the von Bertalanffy growth equation:
where
Growth performance (
Length-weight relationships were tested for differences between sexes using analysis of covariance (ANCOVA). We used Kolmogorov-Smirnov tests (α = 0.05) to determine whether significant differences existed between males and females. Differences in MI during the months were evaluated by one-way analysis of variance (ANOVA). When the results of an ANOVA were significant, differences in the means of the variables were tested using the posterior Turkey-honestly significant difference method. A parametric paired
These statistical analyses were performed using the SPSS version 17.0 (SPSS Inc., Chicago, IL, USA). Significant differences were determined at the 0.05 probability level (
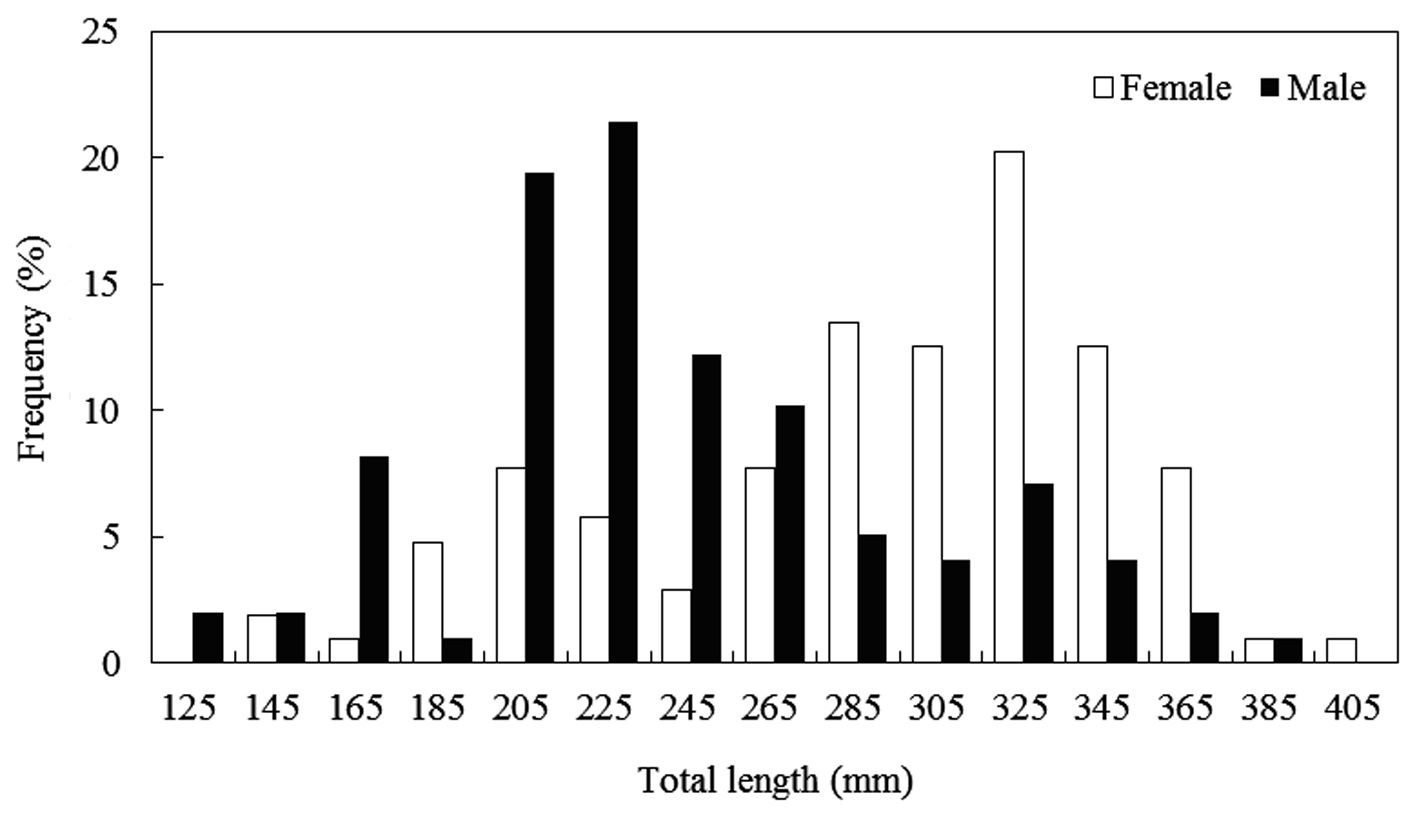
The caught

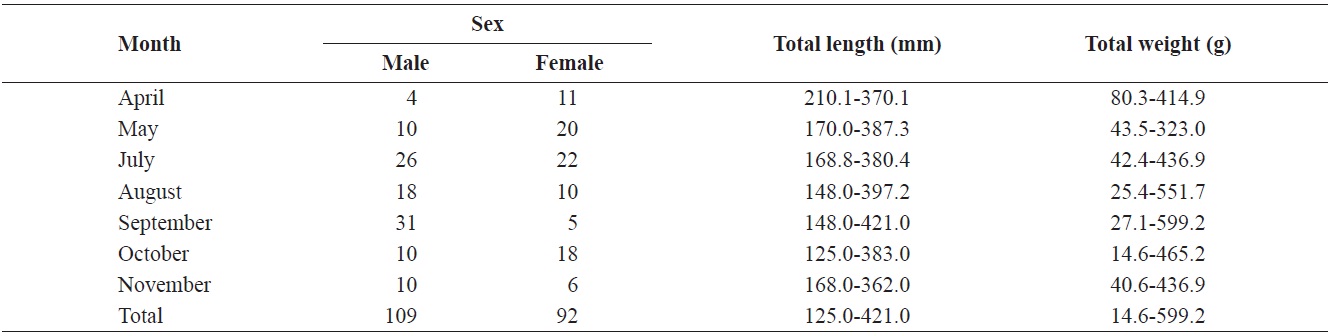
Composition of total length (mm) and total weight (g) of Hemibarbus labeo from April to November
between the two populations from upstream-midstream and downstream (dmax = 0.2035,
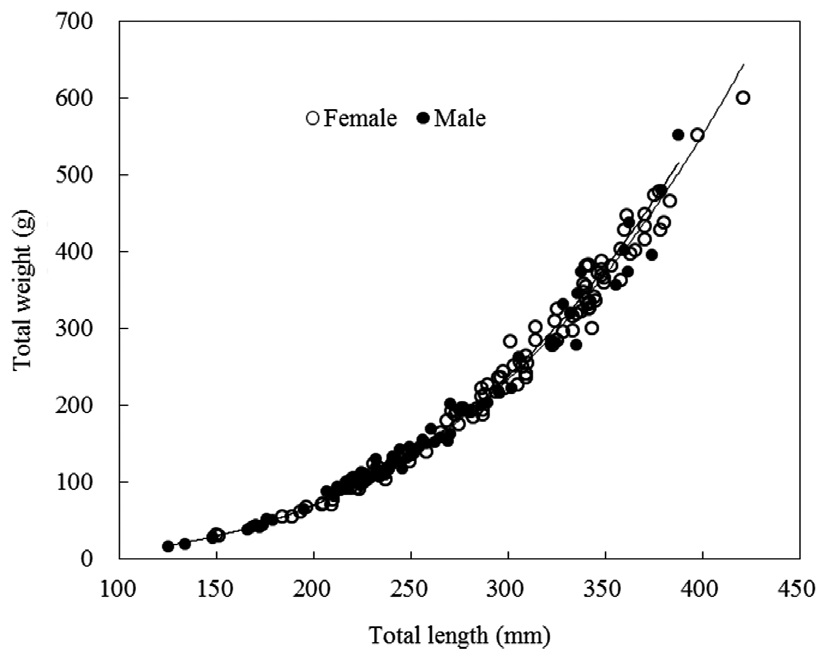
TW-TL relationships were separately evaluated for all individuals and grouped by sexes (females and males). The slopes
of the TW-TL regressions did not differ significantly between sexes (ANCOVA test for equal slopes:
MI analysis (Fig. 5) showed a trend of increasing MI width from spring to autumn. Significant differences among months were found (one-way ANOVA for males:
>
Ageing structure and ageing precision
Age estimates ranged from 2 to 10 years for females and from 1 to 8 years for males, based on the examination of 201 vertebral centers. Each vertebra was read twice (Fig. 6). The APE estimated from the two readings ranged from 0.02 to 0.39 (mean, 0.18), and the CV ranged from 0.04 to 0.78 (mean, 0.23). The paired
>
Relationship between TL and vertebral radius
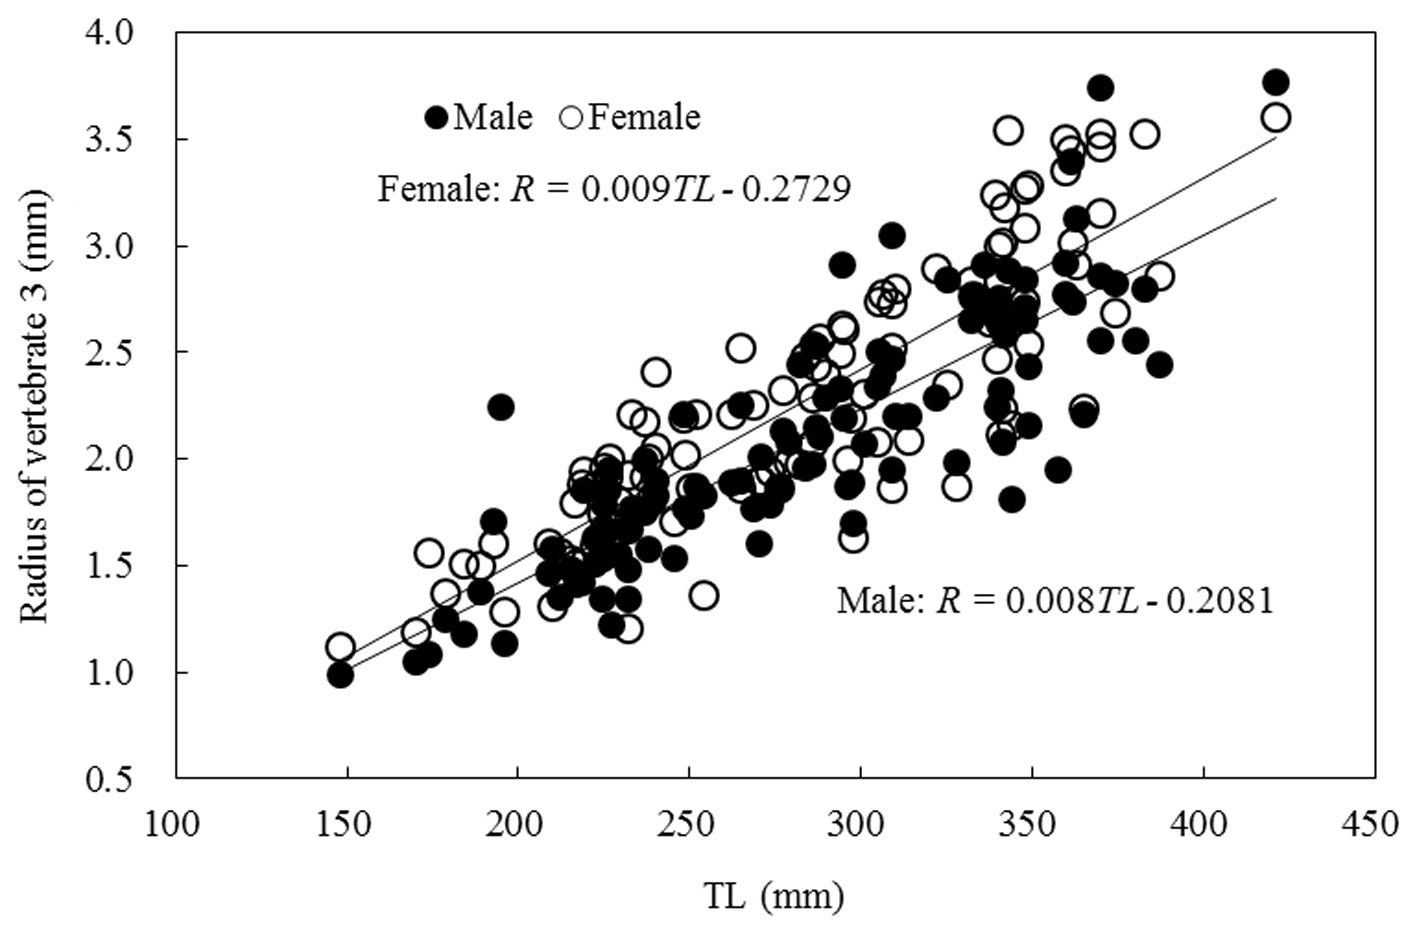
The relationship between the TL and vertebral radius was
linear, as shown in Fig. 7, and was expressed as follows:
Male: R = 0.008TL - 0.208 (r2 = 0.823)
Female: R = 0.009TL - 0.272 (r2 = 0.835).
>
Back-calculated length at the time of annulus formation
Back-calculated TLs were obtained from the corrected ring radius using the Fraser-Lee method, which gives the TL at the time of ring formation for males, females, and combined sexes. There was no indication of Rose Lee’s phenomenon, in which computed sizes at a given age tend to be smaller when derived from measurements of older fish (Francis, 1990).
>
Growth equation and growth performance
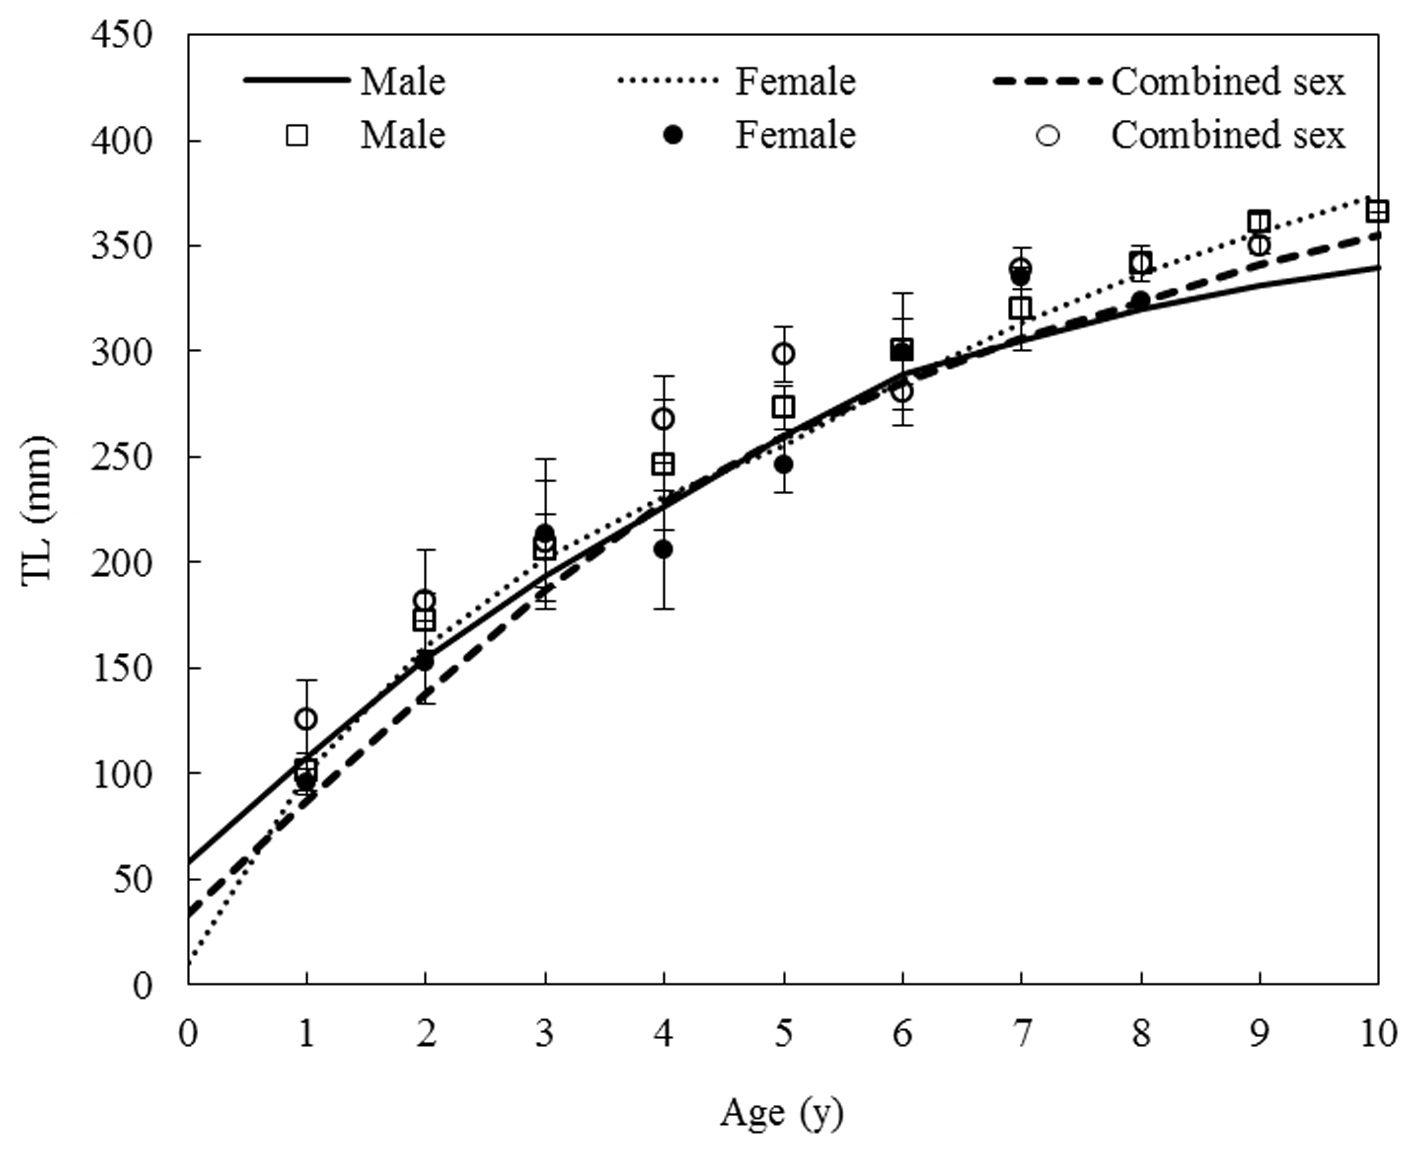
Von Bertalanffy growth equations were determined from the back-calculated TLs of males, females, and combined sexes. The equations were Lt = 438.25(1 - e-0.175(t+0.164)), for males, Lt = 483.36(1 - e-0.147(t+0.115)) for females, and Lt = 464.86(1 - e-0.162(t+0.176)) for the sexes combined (Fig. 8). The growth performances were 4.526, 4.536, and 4.544, respectively. There was no significant difference in the von Bertalanffy growth curves (
This study reports on the age and growth of
Vertebral rings occur systematically as length increases. Their formation is probably more directly related to factors other than size (Pratt and Casey, 1983). All of the factors influencing the formation of the opaque zone are not clear, but several hypotheses explaining its deposition have been reported. Food shortages and food deprivation caused by migration and spawning (Yosef and Casselman, 1995) may affect zone formation. In this study, the water flow rate of a dam directly affected an increase in food availability in March and April,
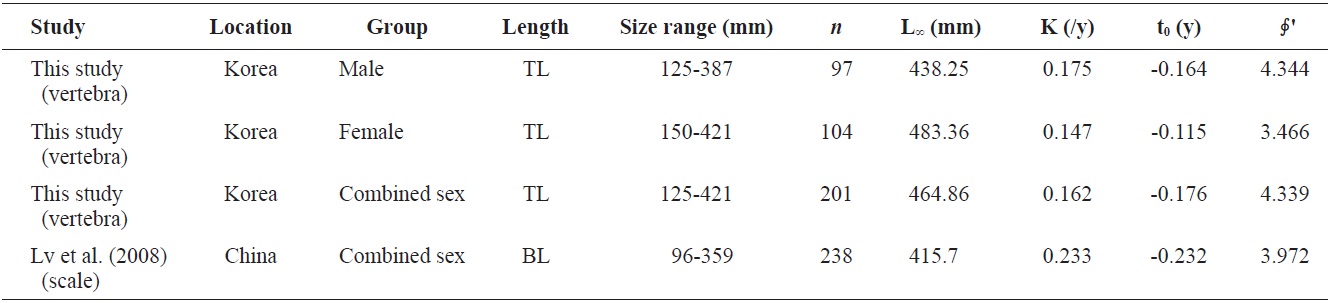
Growth parameters of Hemibarbus labeo (male, female, and combined sexes) from this study and other studies
corresponding to the time of opaque band formation, suggesting that the fast growth of
In this study,
The growth performance of fish reflects prevailing abiotic conditions such as temperature regime, as well as the ability of a species to meet its nutritional requirements (Beamesderfer and North, 1995). This value was also used to compare the growth parameters obtained in the present work to those reported by others. A comparison of the parameters of von Bertalanffy growth equations from the literature (Table 2) showed that male