Bottom trawl surveys have been conducted in the Korean waters from the Yellow Sea to the East Sea each spring and fall since 2008, using a bottom trawl designed by the National Fisheries Research and Development Institute (NFRDI; see Appendix 1 for net diagram and other specifications). The main objective of these surveys was to provide indices of relative abundance of various commercially important species for use in stock assessments. Of these species the snow crab
In other areas where snow crab fisheries occur, such as the Eastern Bering Sea, trawl survey estimates of relative abundance are used to tune or calibrate fishery management models to fit catch data (Turnock, 2010). Part of the model fitting process involves the estimation of survey catchability or the proportionality constant between a survey index of relative abundance and the true population abundance. However, when a relative abundance time series is short, as it is for the Korean bottom trawl survey, it typically lacks sufficient information to adequately constrain model estimates of catchability (Somerton et al., 1999). In such situations, the variance of model outputs can be substantially reduced if the values of the catchability parameters in the model are set at or constrained by estimates obtained from experimental data. One approach to doing this is to conduct an experiment designed to provide data on trawl efficiency or the proportion of crabs in the trawl path which is retained by the net.
The efficiency of a bottom trawl is the result of both the design and performance of the trawl as well as the behavior of the target species (Dickson, 1993), but for snow crab it is believed that efficiency is primarily determined by escapement under the trawl footrope (Fujita et al., 2006). Previous experimental approaches to estimating trawl efficiency for crabs have used either an auxiliary sampling bag attached beneath the trawl (underbag) to capture the crabs escaping under the trawl footrope (Somerton and Otto, 1999; Weinberg et al., 2004; Dawe et al., 2010) or video techniques to estimate the absolute density of crabs in the trawl path (Watanabe, 2002; Watanabe and Kitagawa, 2004). In this paper we describe an experiment to estimate the efficiency of the NFRDI survey trawl for snow crab using the underbag approach.
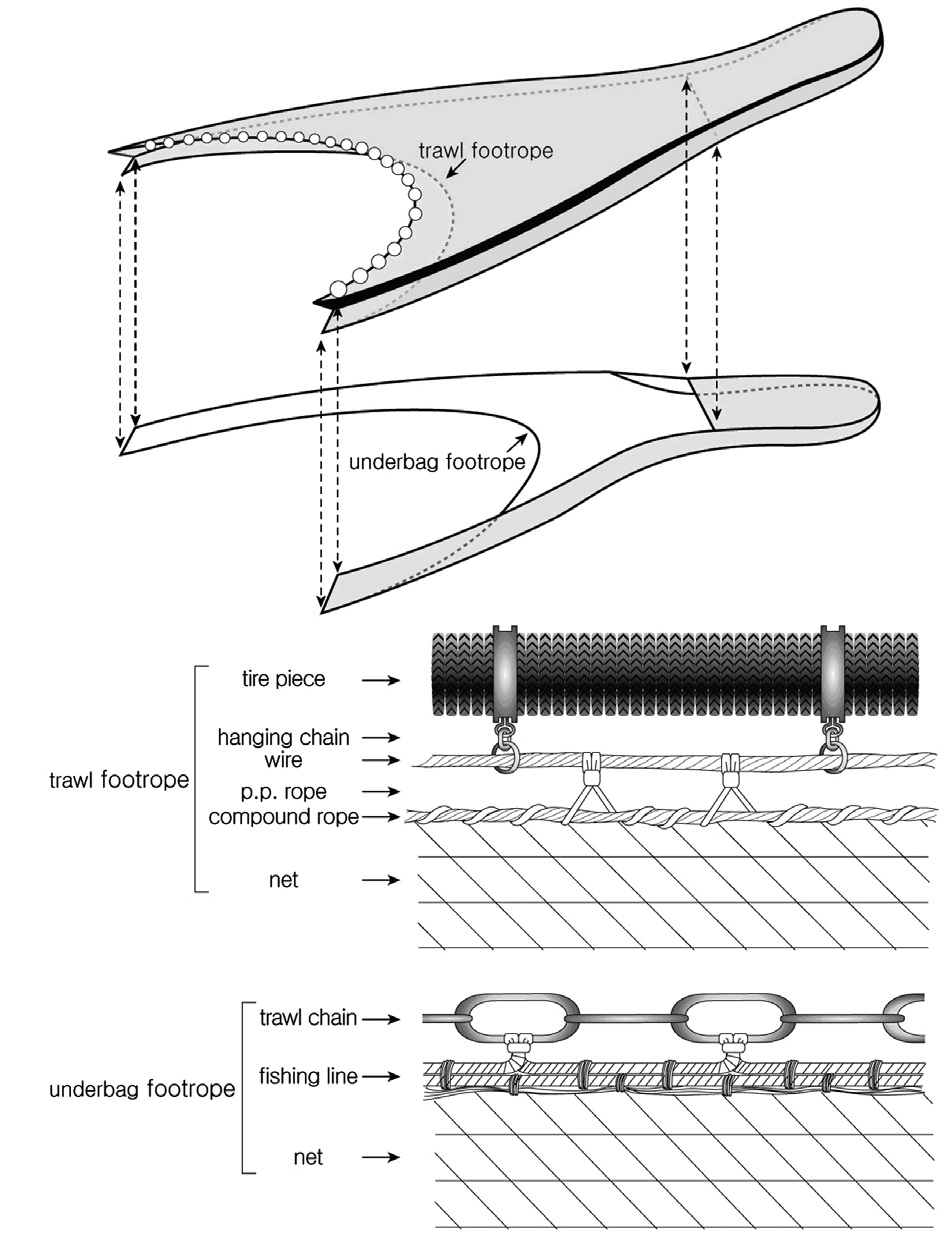
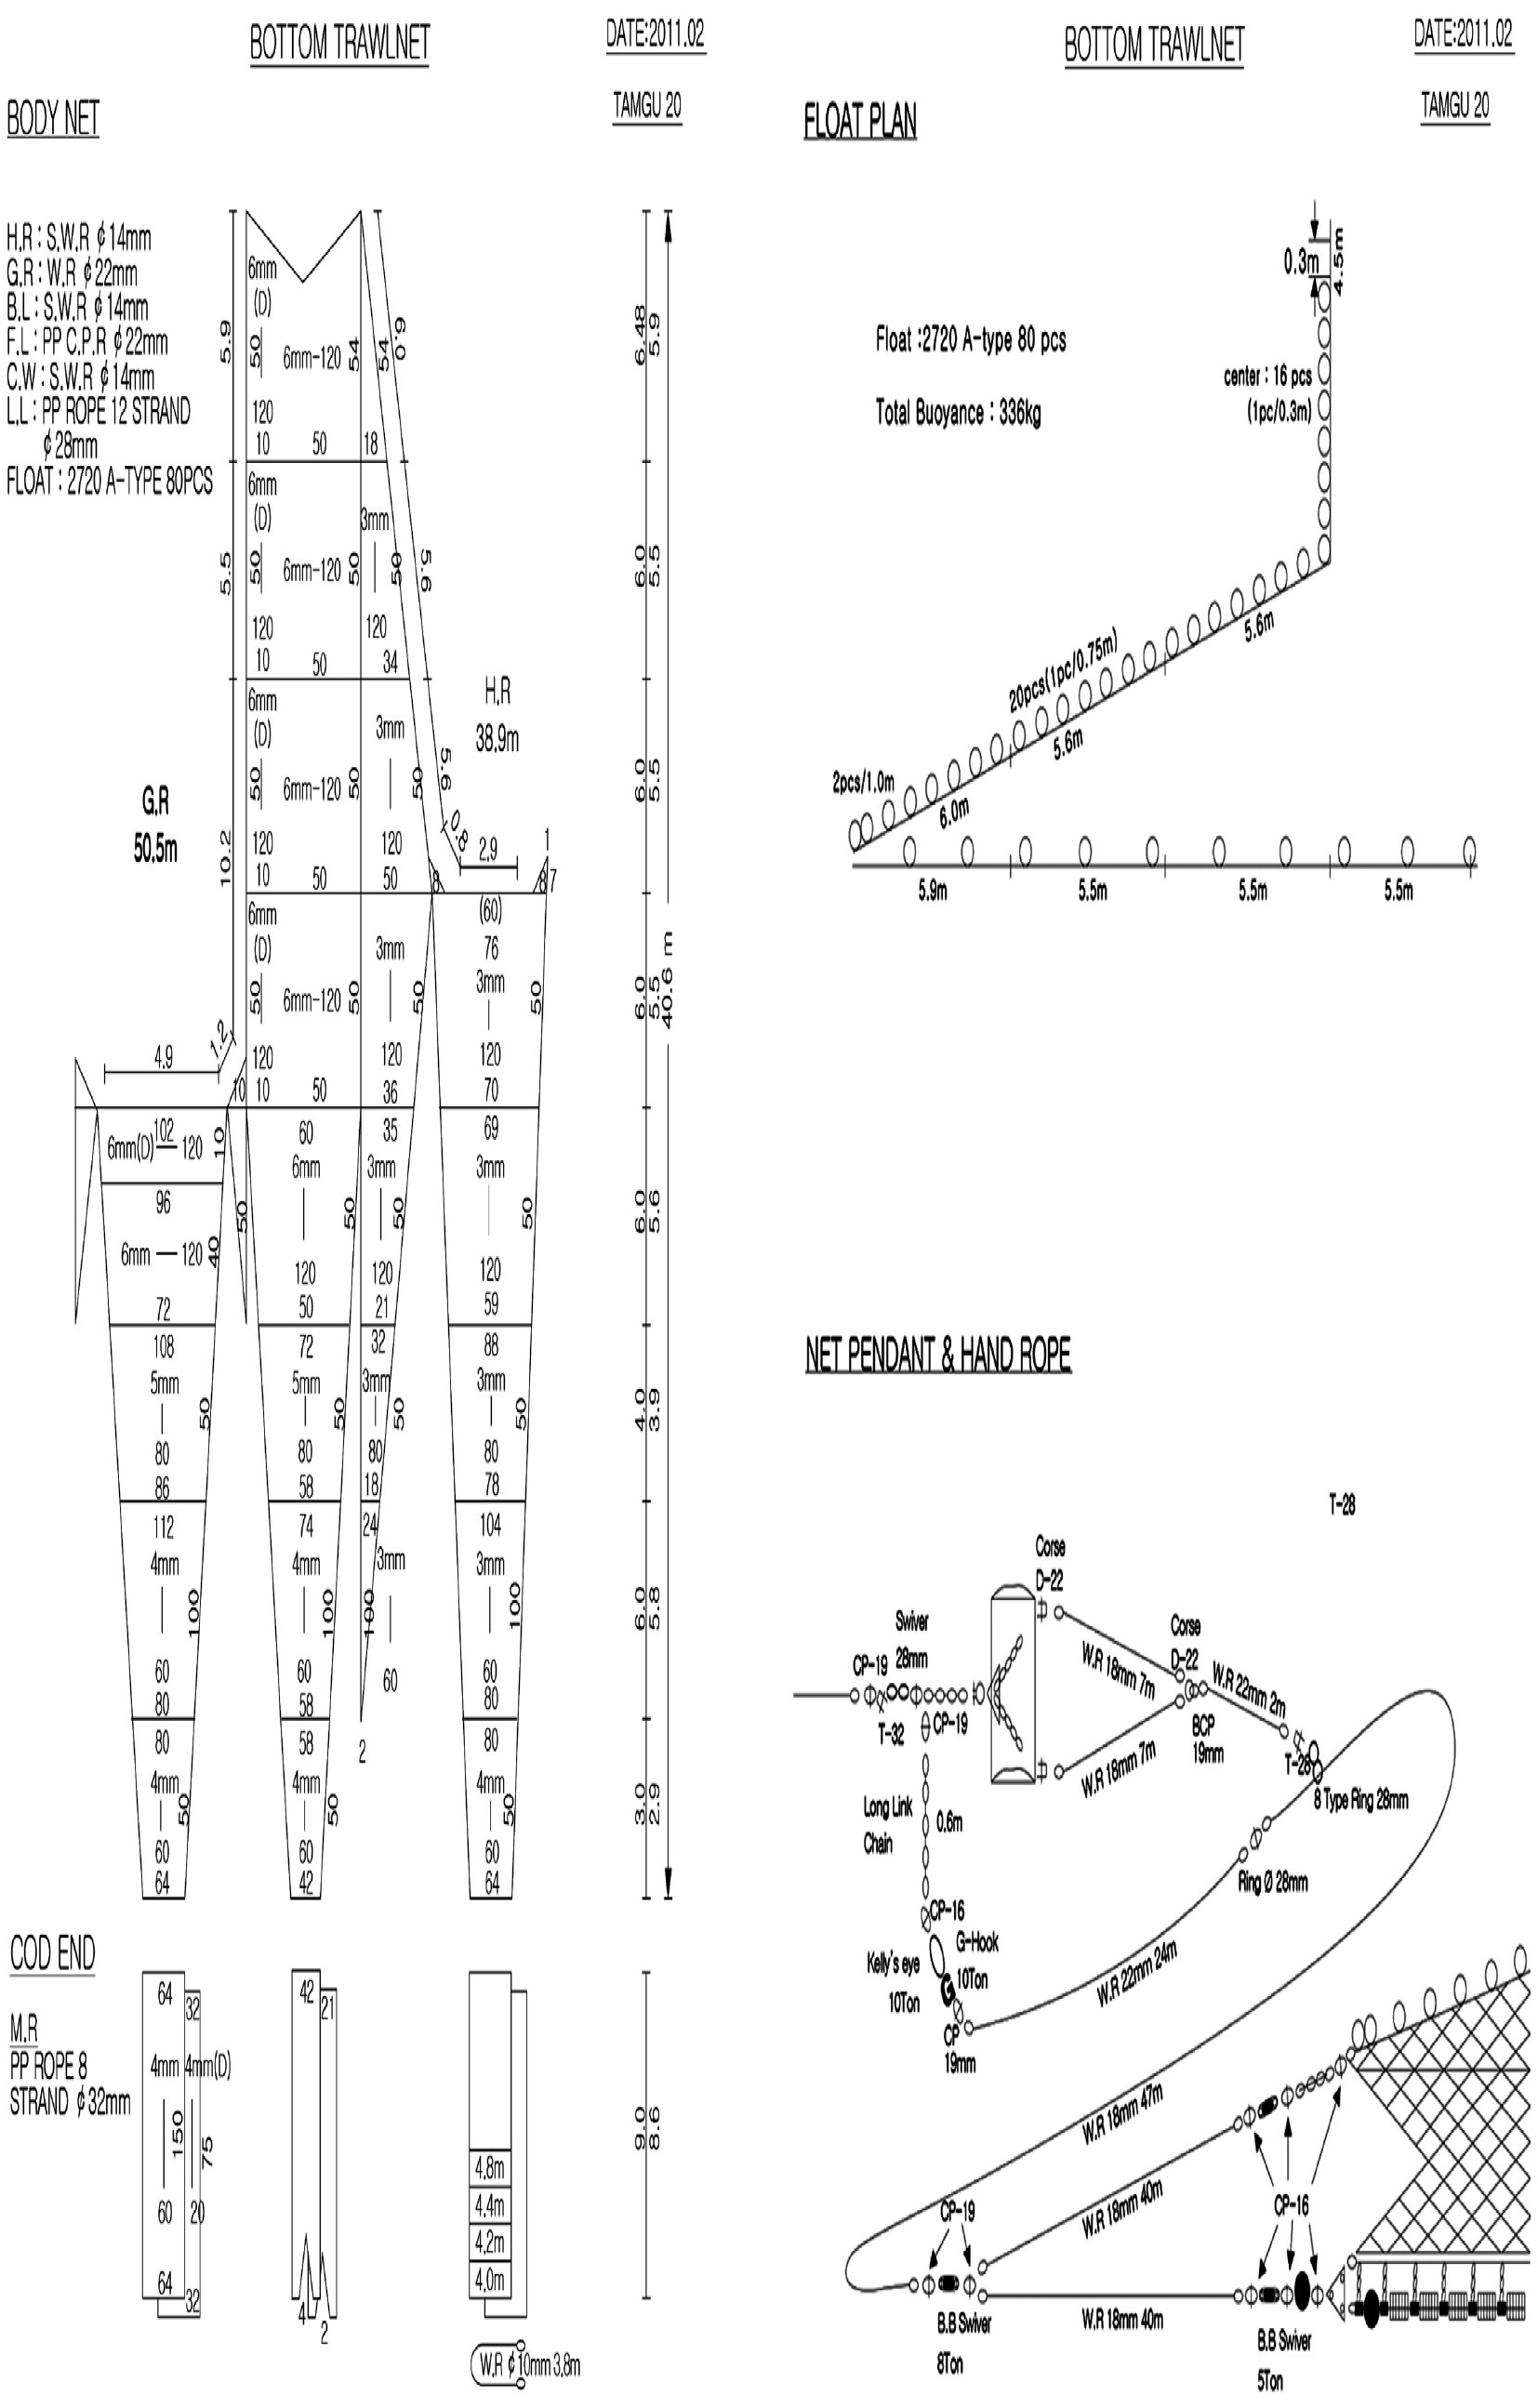
The NFRDI survey trawl has a 6-seam net constructed of 120 mm (stretched) polyethylene mesh in the main body of the net, 80 mm mesh in the intermediate part of the net, and 60 mm mesh in the cod end with a 20 mm cod end liner (see Appendix 1 for a net plan). The 50.5 m footrope is completely covered with 150 mm diameter rubber disks (Fig. 1). The trawl is spread using Jet2 type, 5.14 m2 quadrangle doors, weighting 1,990 kg each (see Appendix 1 for a door plan). Door spread, averaged by tow, ranges from 73 to 86 m over the survey area, wing spread ranges from 18 to 21 m and vertical net opening ranges from 3 to 4 m.
The underbag is a 2-seam net fitted with small side panels, designed to help maintain steady footrope contact with the bottom during periods of intermittent contact by the trawl footrope (Fig. 1). The side panels and first bottom panel of the underbag are constructed of 120 mm polyethylene mesh and the last panel is constructed of 60 mm mesh constructed with a double layer of 60 mm mesh in the cod end with a 20 mm cod end liner. The 50.5 m long headrope is constructed of 19 mm diameter double braid polyester rope; the 53.7 m long footrope (6% longer than the trawl footrope) is constructed of 19 mm long link chain connected to the net mesh with 14 mm compound wire. A delta plate located just aft of each survey trawl wing extension is used to connect the front ends of the underbag headrope to the fishing line of the trawl footrope. The underbag was attached beneath the trawl as shown in Fig. 1.
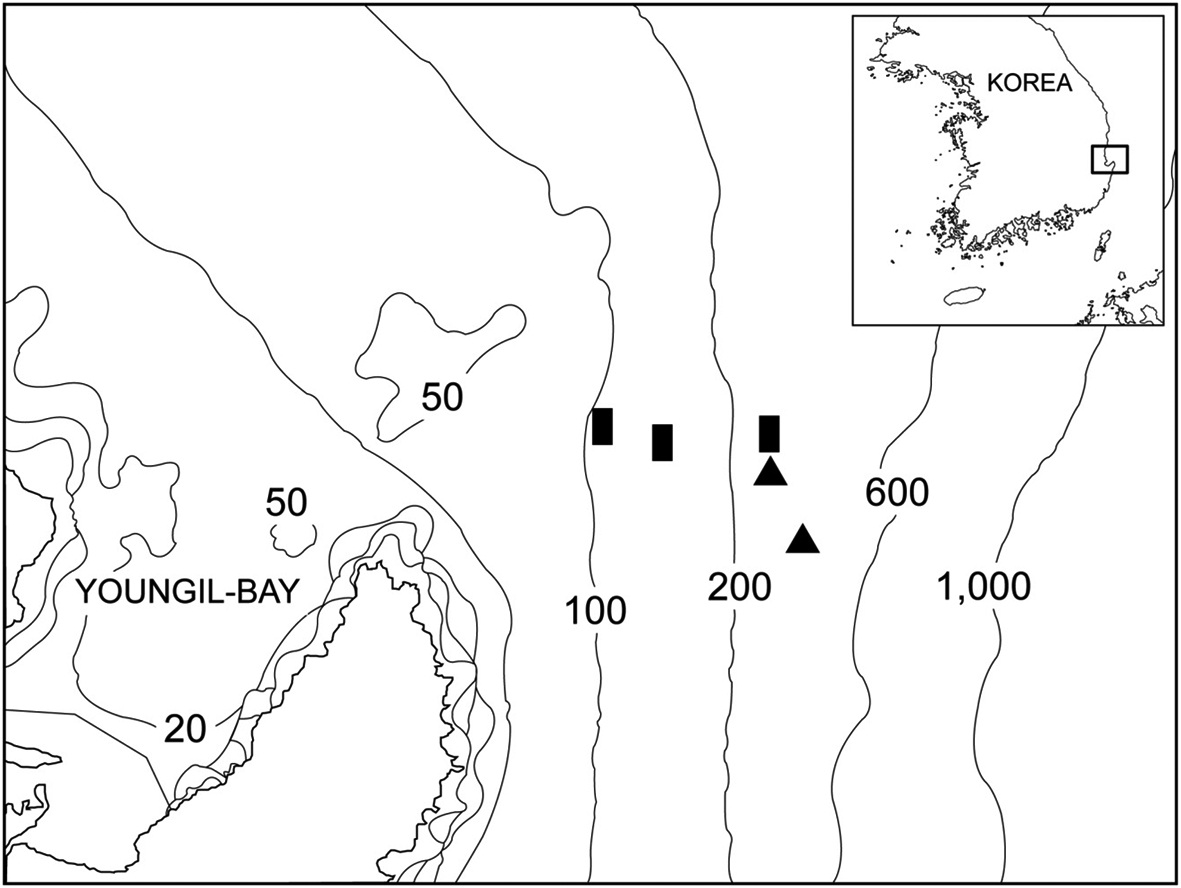
Experimental trawling was conducted during March 14-18, 2011 and again during March 12-16, 2012, in the southern East Sea (Fig. 2), aboard the research vessel
and left the bottom, however the values of tilt angle measured when the ropes were on the bottom differed between footropes because of the differences in their design.
Catches from the trawl and underbag were sampled identically. All snow crab were removed from each catch, sorted by sex, subsampled by weight if the catch was excessively large, then measured for carapace width in mm using digital calipers.
Assuming that all crabs in the path of the trawl are caught and that the entries of crabs into the trawl net or the underbag are independent random events, then the total catch in the trawl net can be modeled as a binomial process (Munro and Somerton, 2001). This was done by fitting a logistic function to the binomial outcome of each crab (
>
Evaluating the performance of the underbag
For the above approach to produce unbiased estimates of trawl efficiency two aspects of the performance of the underbag must be true: it must capture all crabs escaping under the trawl footrope, and must not physically distort or otherwise alter the normal fishing performance of the trawl. The first aspect was examined by measuring the bottom contact at the center of the underbag footrope using the small custom-built underwater tilt meter mentioned above. The underbag footrope contact sensor measured tilt angle in degrees from vertical (90 degrees indicated that the unit was exactly horizontal) every second, which provides a measure of both the strength and consistency of the bottom contact of the underbag footrope. The other aspect was evaluated by statistically testing, using a two sample
during normal bottom trawl survey tows over the same depth ranges using a two sample
>
Determining the relative area swept by the trawl and the underbag footropes
The above analysis is based on the assumption that the areas swept by the trawl footrope and the underbag footrope were identical. Because the underbag was designed to span the full width of the trawl, potential differences in swept area would be the result of differences in tow length. The tow length could differ if the underbag footrope hung beneath the trawl footrope sufficiently far so that it contacted the bottom for a longer period of time (Weinberg et al., 2002). To examine whether this was occurring, a contact sensor was placed at the center of the underbag footrope to determine if the contact time of the underbag footrope was the same as that of the trawl footrope. Due to differences in the design of the trawl and underbag footropes and differences in the size and weight of the two bottom contact sensors, the angles associated with the ropes being fully on the bottom and off the bottom differed between sensors. Therefore, to improve the comparison between units, the angles measured by both units were therefore scaled by their maximum angle (
>
Determining the effect of the underbag on trawl geometry
To determine if the drag from the attached underbag altered the normal fishing performance of the trawl, we used a two-sample Student’s
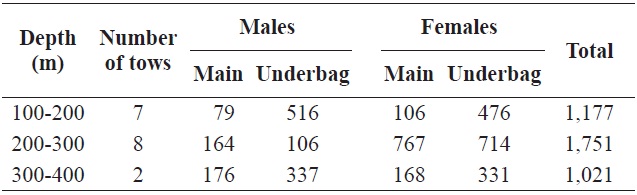
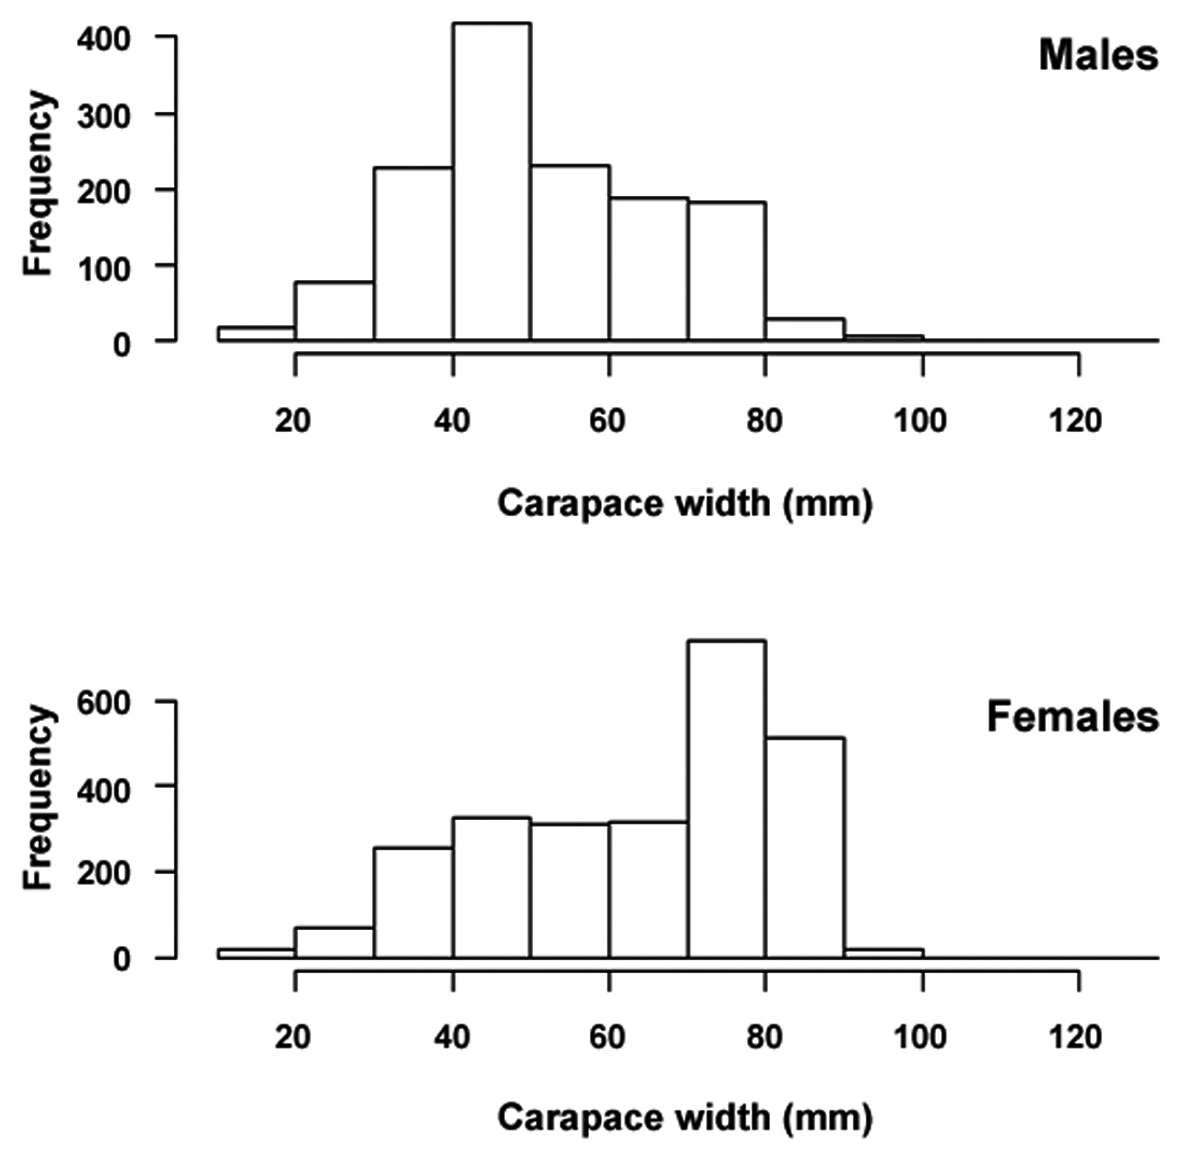
Seventeen stations were successfully sampled covering a depth range of 110 m to 383 m (Fig. 2). The 3,949 crabs measured (2,562 female; 1,378 male) (Table 1, Fig. 4) included nearly the entire carapace width range of females but excluded the largest mature males (Kon and Sinoda, 1992) because the intensity of the male-only fishery has reduced the abundance of males above the 50 mm minimum width limit (Fig. 4).
>
Area swept by the footropes of the trawl net and underbag
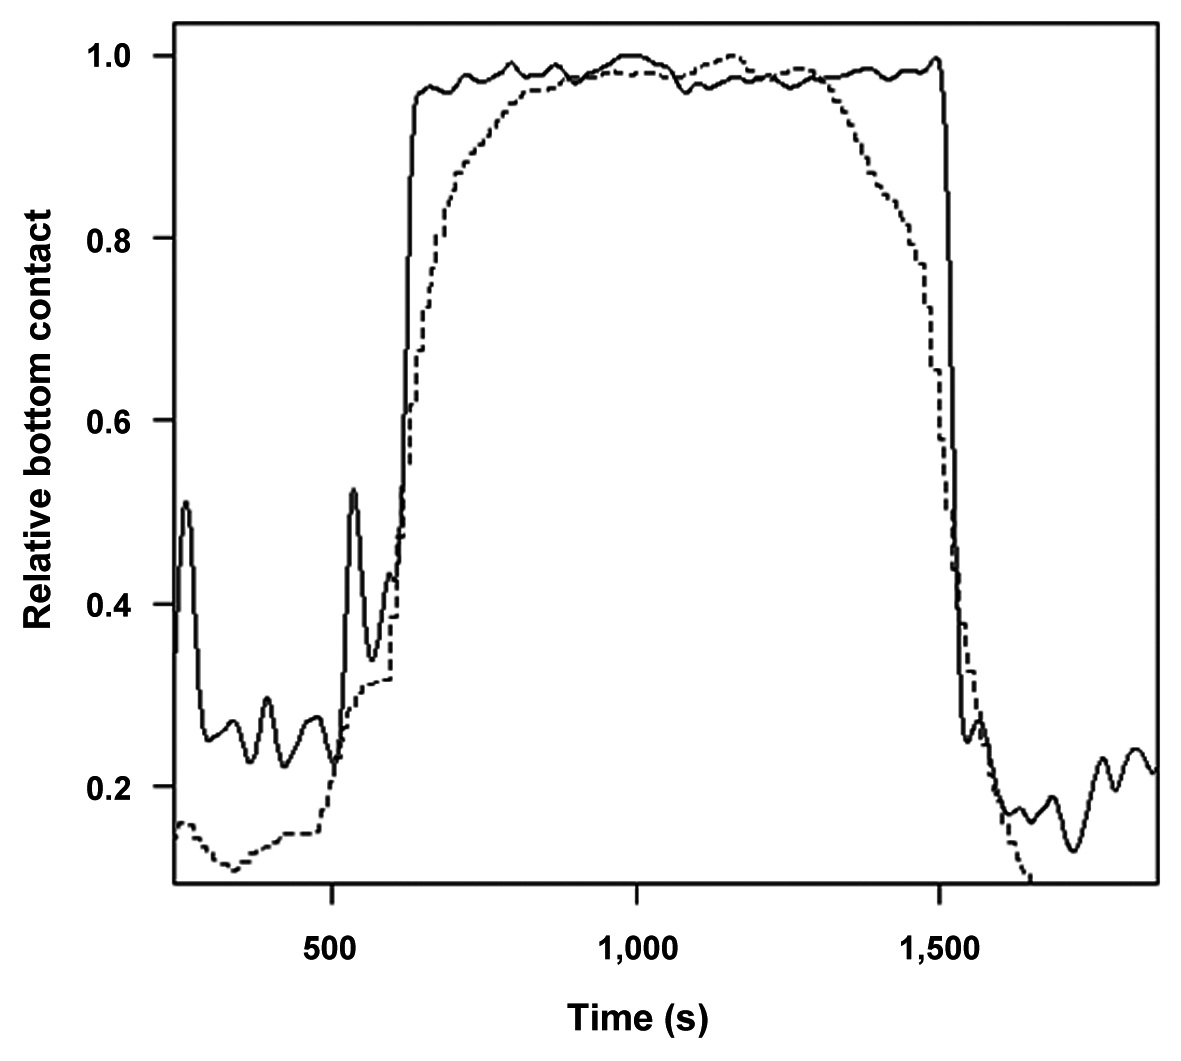
The bottom contact sensor data from the trawl and underbag footropes showed rapid and distinct changes in relative tilt angle indicating when each footrope was on the bottom (Fig. 3).
>
Effect of the underbag on trawl geometry
During the annual surveys in the 100-200 m depth range the door spread averaged 87.8 m (coefficient of variation [CV], 4.3%), while during our underbag experiment in the same depth interval, it averaged 78.7 m (CV, 7.6%). This represents a significant (two sample
Mean trawl efficiency did not differ between sexes (

Number of tows and number of crabs captured by depth interval in the trawl efficiency experiment
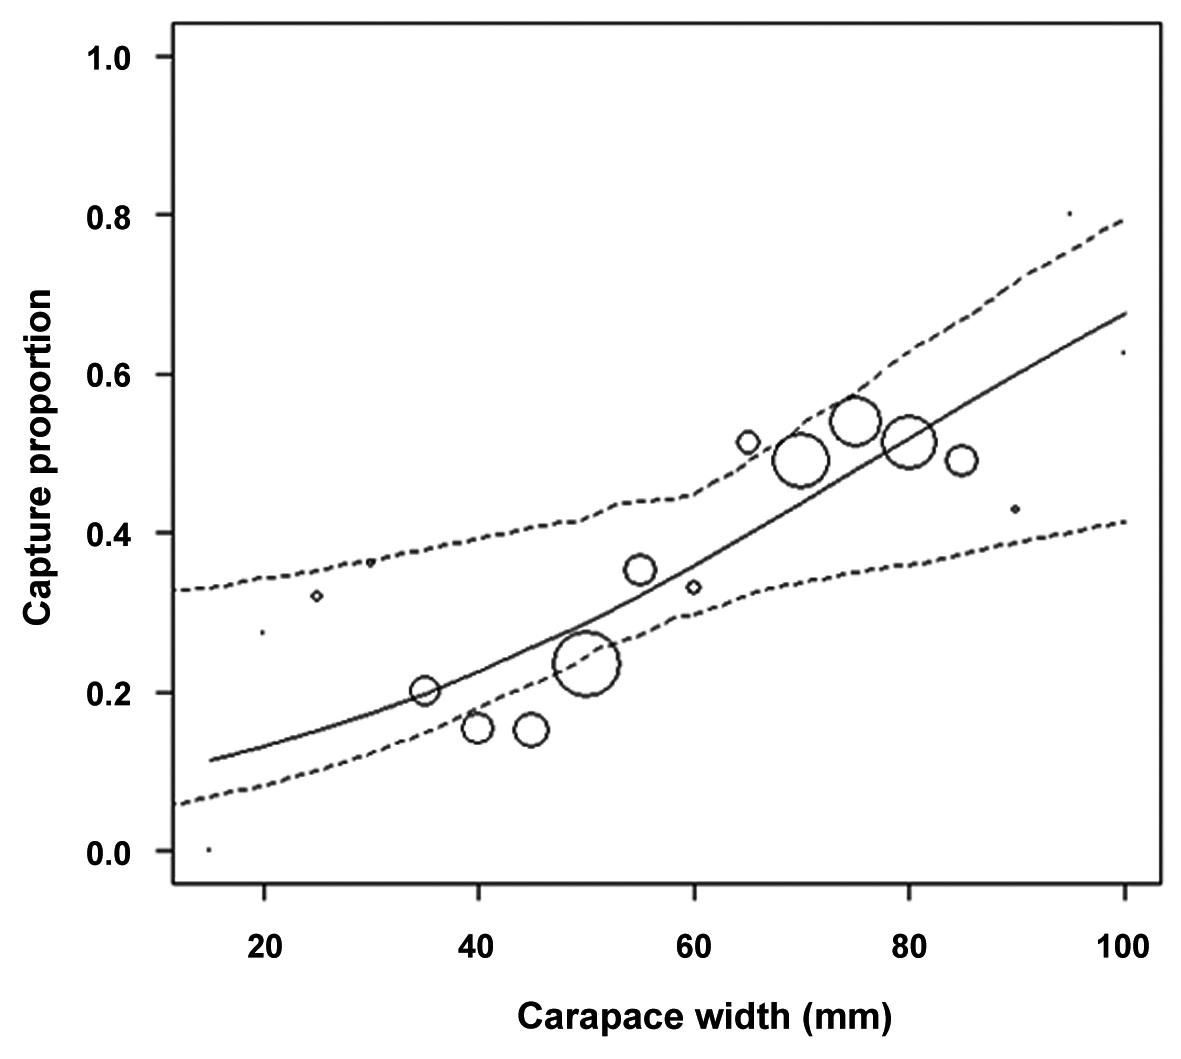
with carapace width. Combined over both sexes, efficiency increased from about 0.1 at 20 mm to about 0.7 at 100 mm (Fig. 5), with a width at 50% capture (equivalent to the selection parameter L50 [Wilemanetal.,1996]) of 78 mm. The logistic equation predicting the mean efficiency is:
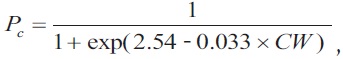
where
To provide unbiased estimates of the efficiency of the NFRDI survey trawl for snow crab, the experimental approach we used required that the underbag successfully captured all crabs escaping under the footrope of the trawl net. To do this, the footrope of the underbag needed to be sufficiently heavy to penetrate the bottom substrate because snow crabs sometimes partially bury themselves. Such a heavy footrope, however, could lead to two sources of bias in the estimates of efficiency. First, it could increase the drag on the bottom sufficiently to distort the trawl and alter its normal fishing properties. One indication of this effect would be a decrease in door or wing spread when the underbag is attached (Somerton and Otto, 1999). In our case we found a decrease in door spread of about 10% when the underbag was attached to the NFRDI trawl. We do not know if this affected the trawl efficiency, however previous studies (Von Szalay and Somerton, 2005) have shown that reductions in wing spread can increase footrope contact, potentially increasing trawl efficiency for epibenthic animals such as snow crab. Second, a heavy underbag footrope could hang below the trawl footrope so far that it touches the bottom before, and leaves the bottom after, the trawl footrope, which would result in the underbag having a greater sweep distance than that of the trawl footrope. Similar to the studies of Weinberg et al. (2002) and Dawe et al. (2010), this was examined by attaching bottom contact sensors to the centers of both the trawl and underbag footropes to simultaneously measure the times of bottom contact. Although there is some uncertainty in interpreting exactly when each footrope started and finished catching snow crab, the change in tilt angle was sufficiently rapid (Fig. 3), that it appeared that the two footropes contacted the bottom nearly synchronously. Thus unlike in the study of Weinberg et al. (2002), the underbag design used in our study did not result in a difference in tow length between the trawl and underbag footrope.
Unlike previous studies of snow crab trawl efficiency (Somerton and Otto, 1999; Dawe et al., 2010), we found no difference in trawl efficiency between sexes. One possible explanation for this is that our samples included few large males (Fig. 4) which have a maximum width of about 100 mm. This maximum includes the maximum width of adult females but is considerably less than the maximum width of adult males of 120 mm (Kon and Sinoda, 1992). Thus, we estimated the efficiency of the NFRDI survey trawl for snow crab in the areas sampled by our experiment. However, to be useful in fisheries management models, an efficiency estimate must represent the average conditions over the survey area, that is, it must be an estimate of survey efficiency or catchability rather than simply a measure of trawl efficiency in the sampled area. The difference between the two arises when efficiency is spatially variable due to depth (Von Szalay and Somerton, 2005) or bottom type (Dawe et al., 2010). In such cases, an unbiased estimation of survey catchability requires a random selection of sampling sites over the entire survey area, to capture the range of environmental conditions that could influence trawl efficiency. The results of our experiment clearly do not meet this criterion.
Besides providing estimates of catchability for management models, trawl efficiency experiments can be used in the calculation of absolute abundance in a survey area, but this requires the additional effort of obtaining trawl swept area estimates of abundance. This, in turn, requires estimation of the effective width of the trawl path and the effective tow length. Based on the video observations of Fujita et al. (2006), snow crabs are not herded by the trawl bridles, therefore the effective width of the trawl path (Dickson, 1993), is equal to the horizontal distance between the wing tips of the trawl net. The tow length, however, is often longer than the distance covered between the winch break set and haul back, and typically varies with depth (Von Szalay, 2004), because a considerable amount of towing cable must be retrieved before the trawl starts to leave the bottom. This effect is important for the NFRDI trawl and the trawling protocols used because the footrope can leave the bottom as much as 6 min after haulback is started.