We investigated compensatory growth of Nile Tilapia Oreochromis niloticus in structural size and live weight in response to different deprivation periods and refeeding. Four treatments were assigned randomly to fish in 12 glass tanks, with each treatment performed in triplicate. The control group was fed to satiation three times a day throughout the experiment. The other three treatment groups were starved for 1 week (S1), 2 weeks (S2), or 4 weeks (S4) and then fed until the end of the experiment. After the experiment, no significant differences were observed among S1, S2, and the control group in average weight or length, whereas the weight and length of S4 were significantly reduced. Relative condition factors of the three starved groups decreased significantly until the end of the restricted period but recovered rapidly after refeeding. The specific growth rate in weight (SGRW) of the three restricted groups recovered quickly upon refeeding and were significantly higher than the control group, but these differences disappeared gradually until the end of the experiment. No significant difference in specific growth rate in length (SGRL) was noted between the control group and the three restricted groups after refeeding. All three groups showed hyperphagia for a short period upon refeeding, and no statistical differences were observed in feeding efficiency among the four groups.
The successful feeding of intensively cultured fish requires detailed knowledge of nutritional requirements and optimal feeding practices, which can improve their growth rates and feeding efficiencies. In the Nile tilapia
Compensatory growth may be used as a management tool to improve growth rates (Hayward et al., 1997) and FE and to reduce feeding costs. In various fish species, deprivation or limited-feeding strategies have been used to induce compensatory growth. Some factors underlying the rapid growth during compensatory growth phases include hyperphagia and increased FE in fish after feed limitation (Russell and Wootton, 1992; Boersma and Wit, 1997). Previous studies have generally focused on compensatory growth in weight, but not in length. However, Bav?evi? et al. (2010) reported that compensatory growth in gilthead sea bream
In the present study, we explored the roles of previous feeding history on the capacity of tilapia to show compensatory growth responses in both weight and length, and we determined whether feeding history influenced characteristics of the compensatory response in relation to the effects of deprivation protocols on body condition. We also evaluated the effects of feed intake and efficiency on the compensatory response.
Fish were acclimated to the recirculating system for 2 weeks prior to the start of the experiment. Water temperature was maintained at 25 ± 0.5℃ using a heater linked to a thermostat. The photoperiod was 12L:12D and continuous aeration was provided. Dissolved oxygen was above 5 mg/L. Water flow to each experiment tank was 5 L/min through a recirculating system equipped with a sand filter, and evaporating water was replenished continually.
Initially, fish were deprived of food for 24 h, weighed individually, and divided equally into 12 glass tanks (30 × 30 × 30 cm), resulting in similar population structures. Four feeding regimes were applied in triplicate. Three restricted feeding groups were subjected to the following regimes: starved for 1 week and refed for 12 weeks (S1), starved for 2 weeks and refed for 11 weeks (S2), and starved for 4 weeks and refed for 9 weeks (S4). The control group (C) was fed to satiation three times a day on a commercial pellet feed (0.5 mm, 38% crude protein, 6% crude fat) during the experiment. The restricted groups were fed the same regime as the control group during the refeeding period. Weight and length were measured individually on the 7th, 14th, 28th, 42nd, 63rd, and 91st day after day 1 of feed deprivation. Uneaten feed was recorded, and feed amount was calculated at each measuring time. Dead fish were recorded on a daily basis.
Following Ricker (1979), we estimated the von Bertalanffy growth rate (rB) starting with the alternative Ford Walford plot regression equation (Cadima, 2003), Lt+Δt - Lt = (L∞ - Lt) × (1 - eB -r Δt), where Lt and Lt+Δt are lengths at the beginning and end of each experimental period of duration Δt, respectively, and L∞ = 59.8 cm (Kraljevi? and Dul?i?, 1997). Rearranging the above equation, we have rB = [ln(L∞ - Lt) - ln(L∞ - Lt+Δt)]/ Δt. The relative condition factor (RCF) (Le Cren 1951) was used to evaluate fish condition. First, the weight and length relationship of the control group throughout the experimental period was calculated as W = 0.0099 × L3.2691,
FE = (Wt - W0)/I,
FI = 100 × feed × [(Wt + W0)/2]-1 day-1,
SGR = 100 × (lnWt - lnW0) × (Tt - T0)-1,
where W0 and Wt are fish initial and final weights (g), t is the feeding period (days), and I is total feed consumption (g) in t days.
Weight, length, and RCF differences during each measuring interval were analyzed by one-way analysis of variance (ANOVA). Differences in the specific growth rate, specific growth rate in weight/specific growth rate in length (SGRW/ SGRL), feed intake, and FE were evaluated by analysis of covariance (ANCOVA) using initial size (initial mass was used for the growth in mass, feed intake, and FE; initial length was used for the growth in length) as a covariate when necessary. Tukey’s test was used for multiple comparisons. Differences were regarded as significant when
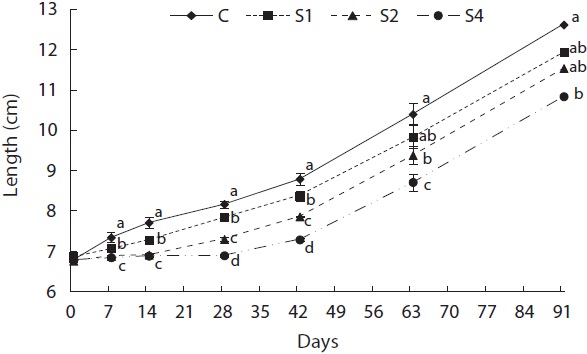
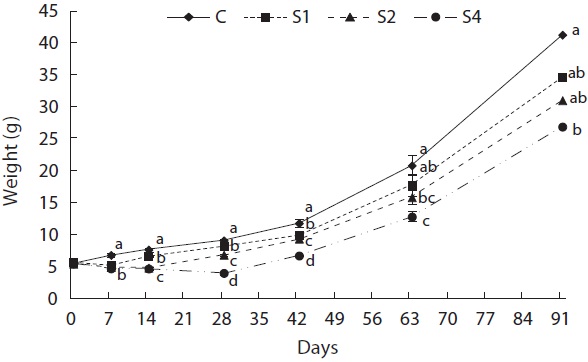
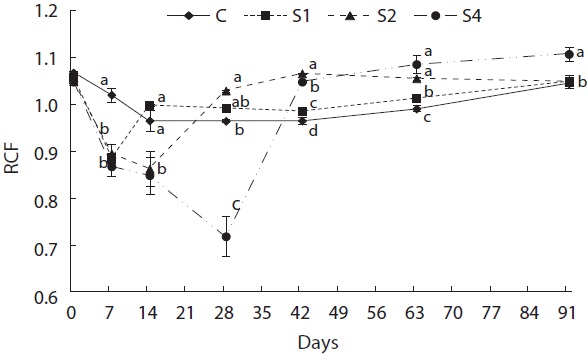
Feed restriction had a significant effect on weight trajectory (Fig. 1). Divergence between the control and restricted groups was significant after 1 week. After 8 weeks, S1 reached the growth level of the control group. After the experiment, no statistical difference was detected among S1, S2, and the control group, although the average weight of the control group was higher than that of S1 and S2. The average weight of S4 was significantly lower than that of the control group. The length growth trajectory showed similar trends to that of weight (Fig. 2). No group reached the length of the control group, although no statistical difference existed among S1, S2, and the control group. Fish condition decreased until the end of the restriction period (Fig. 3). After feeding was resumed, body condition recovered rapidly, and the more starved the fish were, the more rapidly body condition recovered.
Fish showed negative weight growth in the feed-restricted
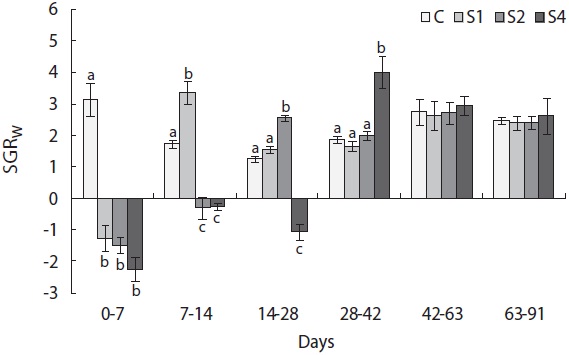
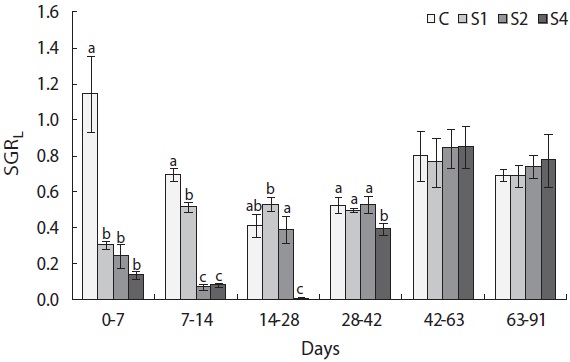
groups, and mass growth decreased significantly during the first week (Fig. 4). Upon refeeding, the growth rate increased immediately and was significantly higher than that of the control group, which was indicative of a compensatory response in weight. However, after a short period, the growth rate decreased to the control group level. During the last 6 weeks, no difference was detected between the control and restricted groups. Length growth decreased gradually in the starved groups and was negligible after 4 weeks of starvation in S4 (Fig. 5). After refeeding, the length growth rate increased but did not exceed that of the control group. Moreover, SGRL of the most starved group, S4, was significantly lower than that of the control group during the first interval after refeeding and then increased significantly in the following period and was slightly higher although not statistically different from
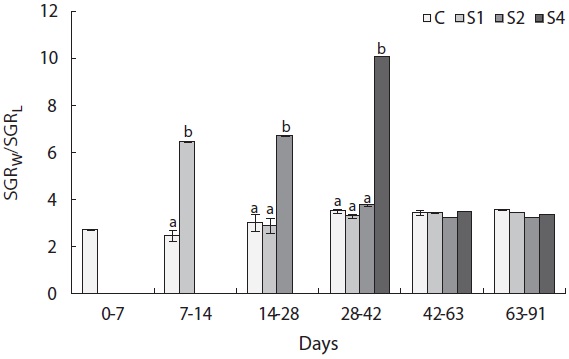
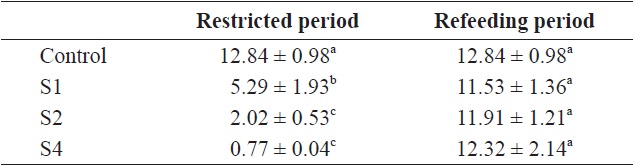
the other groups. The von Bertalanffy growth rate showed no significant differences between the control group and restricted groups (Table 1), and the more starved fish had a higher growth rate during the refeeding period, although it was always lower than that of the control group. SGRW/SGRL was especially high when feed was supplied, and the more starved fish had higher ratio values (Fig. 6) which suggested that fish restored their lost weight, followed by their structure size, after refeeding.
Hyperphagia was responsible for the compensatory growth.

von Bertalanffy growth rate (rB) of fish in the control and restricted (restricted and refeeding period) groups (whole experiment period)
[Table 2.] Relationships among feed intake, feed efficiency, and specific growth rate
Relationships among feed intake, feed efficiency, and specific growth rate
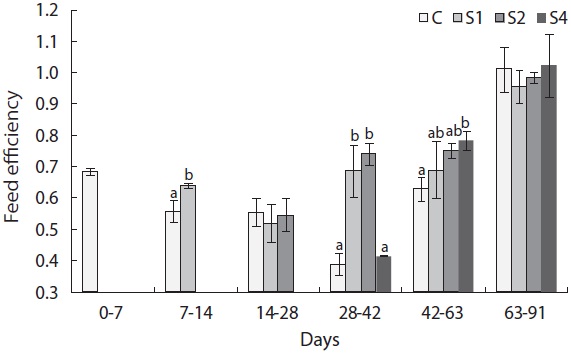
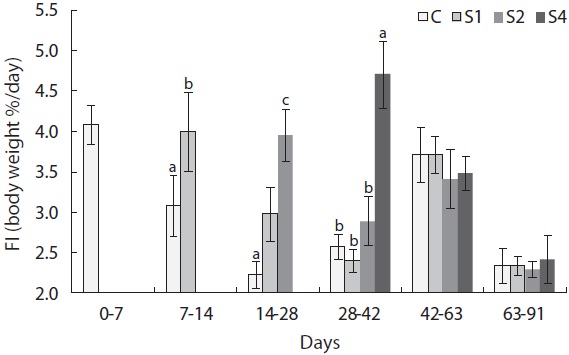
In this experiment, feed intake increased immediately upon refeeding and was significantly higher in restricted groups than in the control group (Fig. 7). However, feed intake quickly returned to normal levels. Feed efficiency also improved in this experiment (Fig. 8). Feed efficiency in S1 increased quickly during the first week after refeeding but did not increase until the second period in S2 and S4.
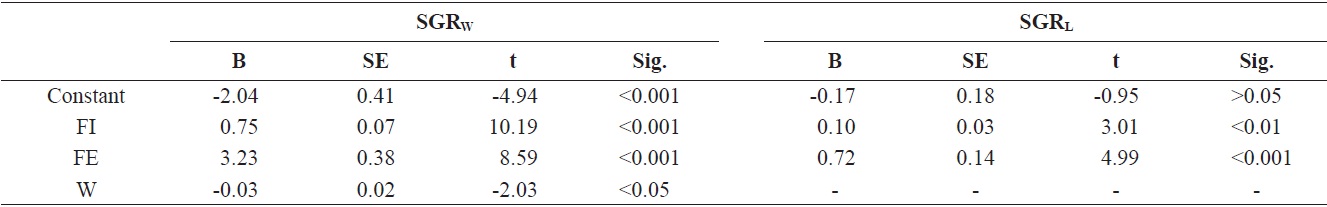
After entered the refeeding period, the relationships among feed intake, feed efficiency, and SGR were determined based on multiple regression analysis (Table 2). The SGRW of the three restricted groups was positively correlated with feed intake (FI) and FE and negatively correlated with initial weight at the start of the refeeding period (SGRW = 0.75FI + 3.23FE - 0.03W - 2.04,
Compensatory growth is significantly associated with feed-deprivation period. Barramundi
At the end of restricted period, the respective lengths of groups S1, S2, and S4 were 96%, 90%, and 77% that of the control group, and the RCFs were 0.89, 0.86, and 0.72 that of the control group, respectively. The compensatory response showed different trends for weight than for length in our study. No difference in the von Bertalanffy growth rate (rB) was observed between the control and restricted groups. This result was consistent with the results reported by Bav?evi? et al. (2010), who observed compensatory growth in weight, but not length, in gilthead sea bream (
Hyperphagia and growth efficiency play major roles in compensatory growth during the refeeding period. Hyperphagia occurs in several fish species during compensatory growth (Russell and Wootton, 1992; Wang et al., 2000), whereas improved feeding efficiency has not been widely observed (Russell and Wootton, 1992; Qian et al., 2000, Wang et al., 2000). In this study, hyperphagia was observed in all starved fish after refeeding (Fig. 6). Some models of compensatory growth in fish have suggested that the associated hyperphagia would abate as the body composition of the deprived fish returned to control levels. Broekhuizen et al. (1994) hypothesized that hyperphagia restored the ratio of reserve to structural material. The lipostatic model for fish (Jobling and Johansen, 1999; Johansen et al., 2002) proposed that lipid levels play a regulatory role in feed intake. Supporting experimental evidence has been obtained from salmonids displaying compensatory growth (Johansen et al., 2001) and those fed high- and low-fat diets (Johansen et al., 2002). Patterns in compensatory responses in SGRW and feed intake were similar to those in our study.
Previous studies have demonstrated increased growth efficiency during compensatory growth responses in
In our study, multiple regression analysis indicated that feeding efficiency played an important role in the specific growth rates of weight and length. This was in agreement with the hypothesis that growth and increases in energy reserves depend on the assimilation (not ingestion) of feed (Gurney et al., 2003). Assimilation efficiency diminishes as ingestion increases, which reduces the yield per ingested feed. The optimal feeding strategy requires a balance of maximizing ingestion and growth rate while maintaining the most efficient possible feed assimilation.
The mechanism of compensatory growth in different fish species may be more complicated than can be explained by the lipostatic model, but compensatory growth in Nile tilapia depended on the length of feed deprivation. Periodic short-term starvation in tilapia farming may not reduce fish weight gain. To date, a body-condition indicator to determine when feed should be reapplied to feed-deprived fish to elicit a compensatory growth response has not been determined. Hayward et al. (1997) determined when fish should be feed-deprived based on the cessation of the hyperphagic period, but the most desirable length of feed deprivation was determined empirically. In channel catfish, hepatosomatic index is used as the most responsive index of feed deprivation and realimentation (Gaylord and Gatlin, 2001; Cho, 2012). Gurney et al. (2003) suggested that when the maintenance ratio inhibits structural growth without reducing total carbon mass (the ingestion rate exactly matches the current basal metabolic cost), then reintroduction of abundant feed would not induce a compensatory response. However, when the ratio exceeds the basal metabolic cost of the animal’s current structure, a strong compensatory response would be expected.