As industry technology advances, a natural consequence is an increased demand for power. That in turn places greater demands on electric power infrastructure systems. This calls for an urgent policy for power outage accidents. The checking pre-diagnosis in the existing policy for power outage accidents is mainly centered on the aftermath of interruption of the operation of power equipment, but in recent years, after the diagnosis in live state has been actively studied domestically and internationally, many research and related products have been introduced as technology used in various fields. Researchers have applied ultrasonic measurement techniques and gas analysis techniques to withstand voltage, measured as acid, a method for measuring the electromagnetic wave by ultra-high frequency (UHF) sensors embedded in the insulation to ultra high voltage transfers in the fields. Gas insulated switchgear (GIS) having a visual effect is commercially available online, and portable systems using the UHF sensors are installed and operated in power company, railroad and large plants [1,2]. However, the live diagnosis depending on the classic method, such as existing infrared cameras and leakage current measurement method in the case of ultra high voltage switchgear, is not effective for the prevention of power outage accidents, because the switchgear internal structure is complex, and it is difficult to determine the occurrence of partial discharge [3]. As a live-diagnosis technique of GIS, UHF technology was applied to the switchboard, and the possibility of application studied [4,5]. The technology by using UHF sensors is simply measured, and the interpretation of diagnostic results is an easy technique, as waveform analysis is standardized by the result of numerous studies. In this paper, the measured result was characterized, and offered to ultra high voltage switchgear under commercial operation. The use of UHF partial discharge measurement technique has started to be actively applied domestically and internationally, and it has been confirmed that the reliability of UHF diagnosis techniques in utilizing ultra high voltage switchboard diagnosis is sufficient. The result is hereby introduced.
2.1 Live-existing partial discharge diagnostic techniques
There are many types of partial discharge live diagnostic techniques: methods for measuring the middle joint material, for measuring the capacitance using the sensor of a capacitive coupler type, measuring the leakage currents flowing in the ground wire, using infrared cameras, and using an UHF sensor, etc. [6,7].
As a diagnosis using an ultrasonic sensor is the diagnostic method of a sensor attached to joints in the middle of the cable, it actually is a diagnostic technique that is rarely used by itself in application in the field, because of the vibration of the cable itself, the risk of measurement when the sensors is attached directly to the middle joint, the difficulty of access to the site, and the difficulty of distinguishing between signal and noise. It is difficult to analyze the signal in a measurement method using capacitive sensors with capacitive couplers, and the technique is affected by surrounding noise.
The diagnostic technique using a HFCT(high frequency current transformer) is a technique to measure leakage current through the ground wire, when partial discharge occurs. As it is a method of measurement using a HFCT with 20 MHz ~ 30 MHz measurement bandwidth, it is easy for signal processing hardware, because its frequency band is lower than UHF (500 MHz - 1,500 MHz). However, this is an excellent method to use in the laboratory, except for its difficulty in distinguishing and analyzing between the circulating current and the leakage current caused by partial discharge, because the circulating current flows to the ground wire. To overcome such problems, some partial discharge diagnostic equipment companies have studied the distinction betwen the intrinsic partial discharge signal and the noise through FFT analysis, as 3 HFCT are connected to each signal ground wire on cable R, S, T phases of the cable at one time.
A widely used diagnostic technique using infrared cameras has been applied in the field for a long time. The diagnosis of part of the whole shoot is easy in the equipment of complex structures, such as ultra high voltage, but the diagnosis is difficult for the shadow zone that can’t be shot, of the rear part of the equipment. This technique is widely used as an auxiliary means of partial discharge localization tracking for locations where partial discharge is known to have occurred, through a method such as UHF diagnostic technique.
2.2 UHF partial discharge diagnostic techniques
UHF technology, a technique involving the surface of the metal making up the power plant, the internal and surface of the insulation, and measuring the partial discharge occurring on the metal and the joint parts of the insulator, is a technique that can easily measure and analyze in the field of a substation. Various power equipment, including ultra high voltage and breakdown accident, suffer production defects, construction defects and environmental cause while driving. More than half of the power equipment failure are accidents due to the breakdown, which is always accompanied by partial discharge phenomena. It is accompanied by various phenomena, such as partial discharge, discharge current, acoustic signal, light, and electromagnetic radiation. As UHF technology is a method to detect the radiating electromagnetic wave when partial discharge occurs in the power equipment, a method to detect partial discharge is embedding UHF band antenna sensors inside power equipment. The electromagnetic waves generated by partial discharge have features to be distributed to broadband frequency more than GHz. These electromagnetic waves cause electrical resonance in GIS or ultra high voltage switchgear, and partial discharge can be found on the inside switchboard, as they are detected by UHF sensor.
2.3 The principles of detection and electromagnetic emissions by partial discharge
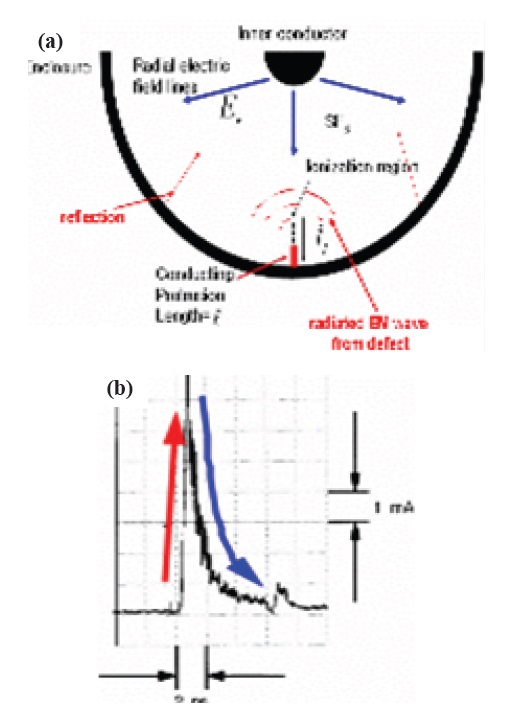
Figure 1 shows a schematic of the occurrence of a partial discharge in GIS. Figure 1(a) shows partial discharge due to the fixed protrusion at the bottom of the internal of GIS, and generates a typical pulse wave, as shown in Fig. 1(b). If partial discharge occurs at the inside of GIS, transient current with a very fast rising time of tens of nano seconds flows, as shown in Fig. 1(b).
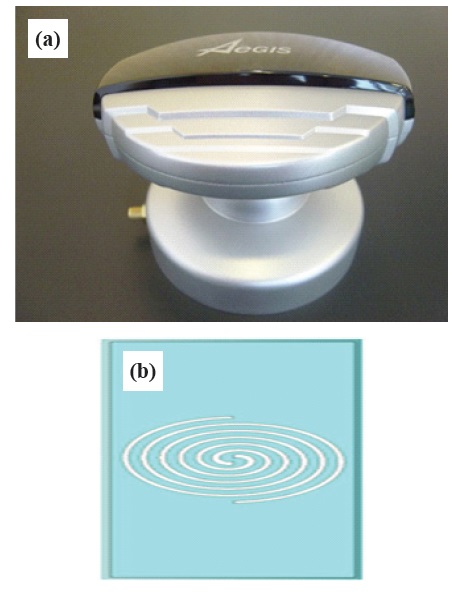
Figures 2(a) and (b) are UHF sensors with 500~1,500 MHz frequency band, which are self-developed and applied to the field, and designed in a spiral [8]. These involved the self-developed UHF signal analysis equipment. They are able to amplify the ultra-wideband electromagnetic wave signal, and after filtering, to facilitate analysis, having the ability to change to the lowfrequency band.
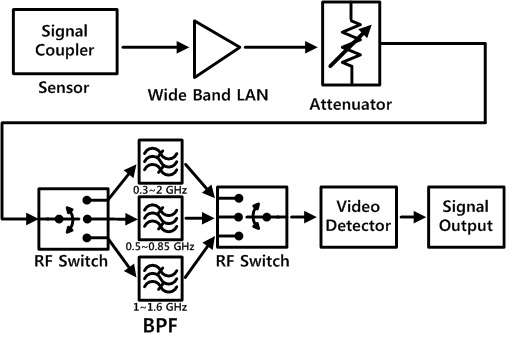
Figure 3 shows the internal block diagram of the analysis device, after weak signal input through the UHF sensor passed the LNA (low noise amplifier), which is designed by considering the stable gain, nonlinear characteristics and noise indices, designed to minimize unnecessary interference of the electromagnetic wave, by choosing the frequency band through the wide BPF (band pass filter). This signal is passed through the video detector, its frequency is 20 MHz ~30 MHz band, the scale has been reduced, and the processing hardware changed to be easy, then the signal input to the central processing unit of DSP through the A/D converter and to be treated.
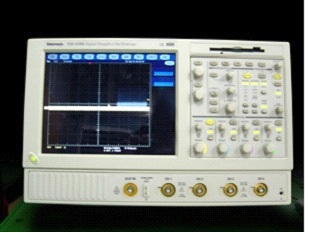
Figure 4 is a Tectronix TDS 5000 commercial oscilloscope for pattern analysis. The partial discharge signals are measured once by using the envelope mode capability, and measurement and storage during the 1,000 cycles are repeated. The analysis method used phase resolved partial discharge (PRPD).
The following shows the data obtained from partial discharge diagnosis of the live wires of ultra high voltage by using UHF sensors. The UHF partial discharge measurement techniques were used for an ultra high voltage switchboard in approximately 200 large factories, in Gumi, Taiwan, and China. As a result, partial discharge signals were found at 15 places. Among them, after a power failure, it is found that the partial discharge signal was destroyed at discharge occurring in 8 places where abnormal places can be checked for by improvement work, such as a tightening check on the cable connection and the cable-head reinforcement.
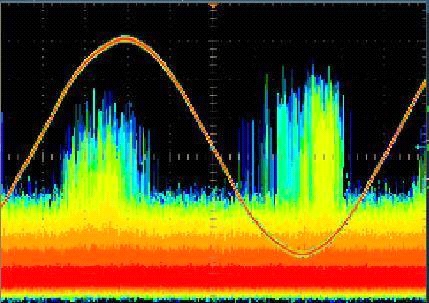
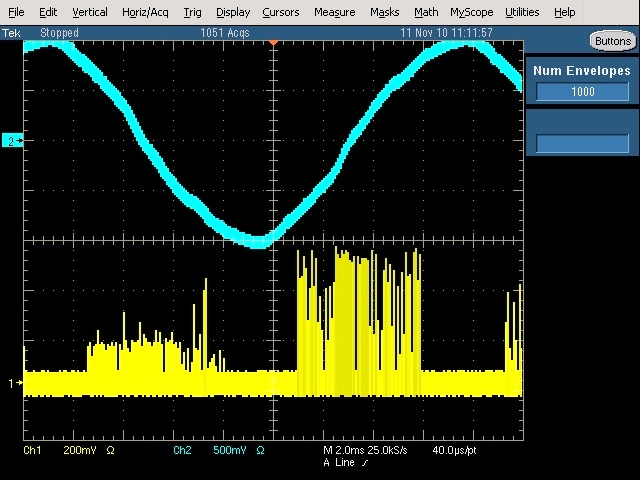
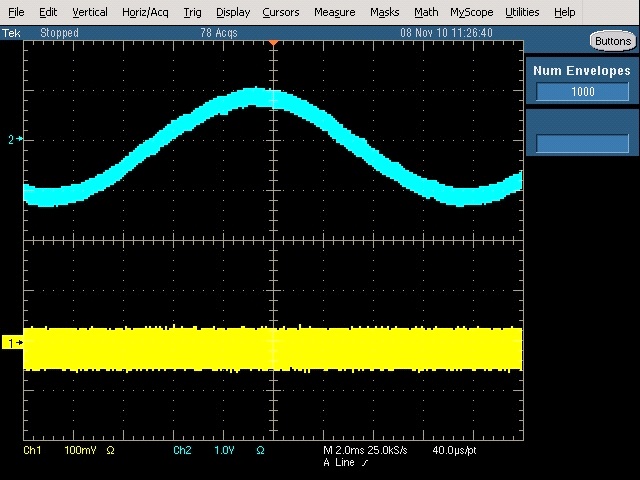
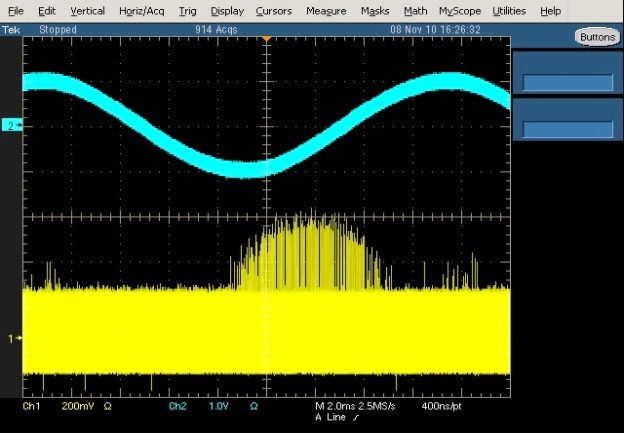
Figures 5, 6, 7 show the partial discharge signal obtained by the simulated results. 170 kV GIS mock-up was produced by the partial discharge of UHF, when partial discharge occurs. Figure 5 shows the floating discharge, Fig. 6 shows the corona discharge, and Fig. 7 shows the insulation voids discharge. In this paper, this signal is the standard signal, which is compared with the simulation signal and the measured signal in the field, and used to determine the discharge occurrence and type of discharge [9,10]. The magnitude of the GIS voltage is different from the magnitude of voltage of ultra high voltage switchgear, but a partial discharge signal occurs, regardless of the magnitude of the voltage. Comparison and analysis of the electromagnetic wave radiation were possible, because the GIS is filled with SF6, and the ultra high voltage switchgear air insulated are the same pattern in progress [11,12].
Figure 5 shows the partial discharge occurred by loosened metal bolts in the cable head of power equipment inside, and the part connected to the bus bar. When the signal pattern shown in Fig. 5 occurs [13,14], the metal and its connecting part should have been intensively checked. The measurement signals were successively measured and stored by PRPD method during the 1,000 cycles. The unit of the vertical axis is 100 mV/div, the unit of the horizontal axis is 2 ms/div, and the synchronous signal of 60 Hz and the measured signals are shown by nesting.
Figure 6 shows the discharge pattern due to the applied voltage part or the extrinsic material of the metal surface or the protrusion. The abrasion state of the bus bar surface and the incoming voltage part should have been intensively checked. The measurement signals were successively measured, and stored by PRPD method during the 1,000 cycles. The unit of the vertical axis is 100 mV /div, the unit of the horizontal axis is 2 ms /div, and the synchronous signal of 60 Hz and the measured signals
are shown by nesting.
Figure 7 shows the discharge signals when the internal insulators in CT, PT and the supporting insulator have failure. This signal occurred on a crack in the internal void, surface damage, or contamination, during the insulator manufacturing and assembly process [13,14]. The signals were successively measured and stored by PRPD method during the 1,000 cycles. The CH3 at the top of the figure is the synchronous signals with applied voltage of 60 Hz. CH1 (medium) and CH2 (bottom) are signals measured by 2 UHF sensors. The unit of the vertical axis is 200 mV /div, and the unit of the horizontal axis is 2 ms /div.
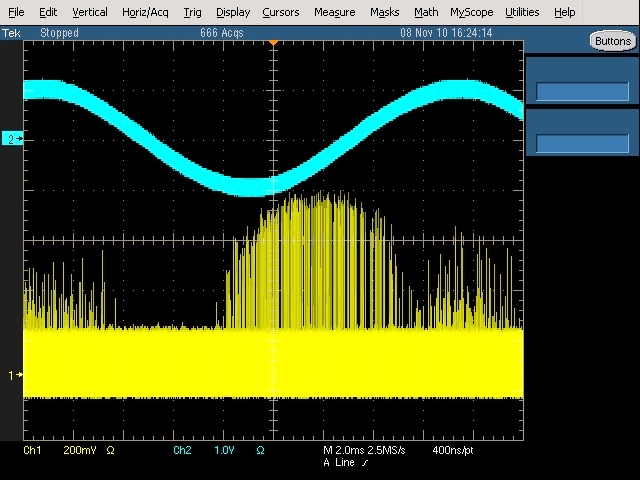
Figure 8 shows the partial discharge signals measured at the switchgear of a large factory in Gumi, which seems similar to Fig. 5. The amplitude of the discharge signal is approximately 500 mV, and occurred continuously. The sine wave in Fig. 8 is measured on 60 Hz phase for PRPD analysis. This signal is the standard signal, and measured signals by accumulation during the 1,000 cycles. The unit of the vertical axis is 200 mV /div, the unit of the horizontal axis is 2 ms /div, and the synchronous signal of 60 Hz and the measured signals are shown by nesting.
Here, the loosened bolt in the connection of the cable was found after power outage, so it was treated. It is confirmed that
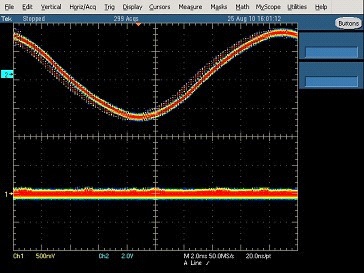
Fig. 9 shows the cause of the partial discharge is eliminated by re-measurement.
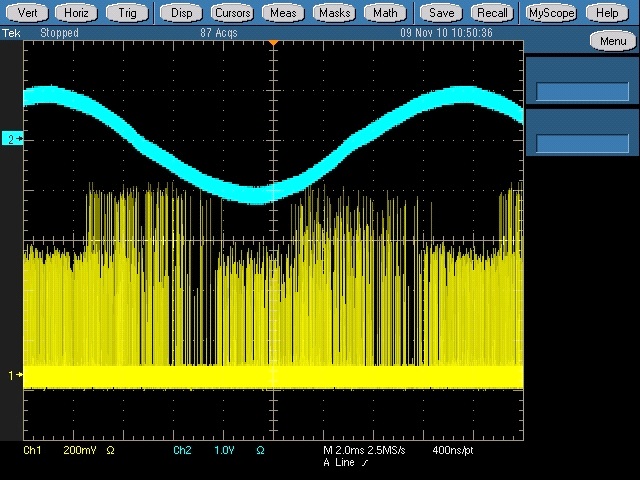
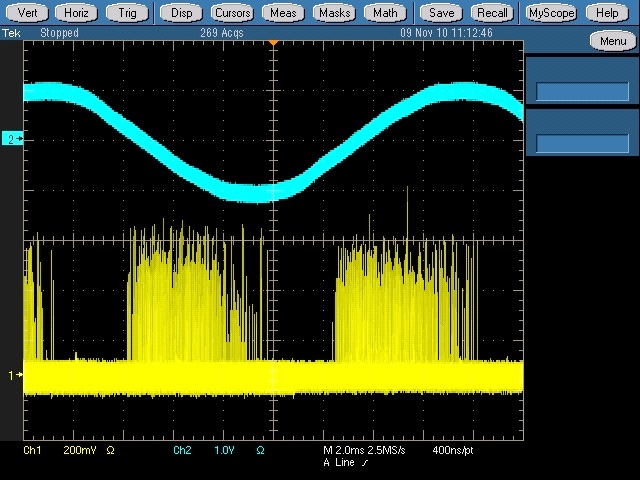
Figure 10 shows the measured data at the factory in Gumi, which is similar to Fig. 6. The partial discharge signal caused the small amount of the signals of 600 mV. The unit of the vertical axis is 200 mV /div, the unit of the horizontal axis is 2 ms/div, and the synchronous signal of 60 Hz and the measured signals are shown by nesting.
Figure 11 shows that the metal connection part was checked, and the insulation was reinforced after power outage. It is confirmed that the discharge signal is destroyed, after re-measurement. The unit of the vertical axis is 200 mV /div, the unit of the horizontal axis is 2 ms /div, and the synchronous signal of 60 Hz and the measured signals are shown by nesting.
Figure 12 shows the measured data at a large factory in Guangzhou,
China. This is similar to Fig. 7, which shows the pattern of the partial discharge signal when there is any problem in the insulator. It confirmed that CT, PT and the supporting insulators were replaced, and the partial discharge is destroyed after re-measurement. The unit of the vertical axis is 200 mV /div, the unit of the horizontal axis is 2 ms /div, and the synchronous signal of 60 Hz and the measured signals are shown by nesting.
The UHF sensor was used in the partial discharge diagnosis of the live wires of ultra high voltage panels. Simulating the actual discharge in GIS, based on the measured partial discharge signal, the discharge was measured at 200 locations in ultra high voltage switchboards. It is confirmed that the discharge signals of 15 locations in ultra high voltage switchboards are similar to the pattern of the measured partial discharge signals in GIS. Among them, after the power outage, the insulation was reinforced for 8 locations where the work is possible. After the voltage is applied again, it is confirmed through the measurement that the cause of partial discharge is destroyed. The types of the partial discharge signal of UHF, when partial discharge occurs in GIS, are floating discharge, corona discharge and the insulation voids discharge. The magnitude of GIS voltage is different from the magnitude of voltage of ultra high voltage switchgear, but a partial discharge signal occurs, regardless of the magnitude of the voltage. The GIS filled with SF6 and the ultra high voltage switchgear air - insulated were taken as the same electromagnetic wave pattern in progress. The loosened bolt in the connection of the cable was tightened, the metal connection parts were checked, and the insulation was reinforced. CT, PT and supporting insulators were replaced. So they were treated. It is confirmed, after remeasurement, that the discharge signals are destroyed.
In this paper, we performed a test, in order to apply the partial discharge of a high-voltage distribution panel using an UHF sensor into live wire diagnostic technology. We identified signal patterns similar to partial discharge signals in GIS, and verified that it is possible to apply the signal interpretation methods for partial discharge in GIS. In the GIS, the fault location can be tracked by the UHF technique. However, we failed to assume the fault position, as the distribution system has a narrow structure, compared to GIS. In the case of GIS, a certain part of the components could be replaced through location tracking. Meanwhile, the high voltage distribution panel has small facilities, in comparison with GIS, so we had difficulty in tracking the discharge location via the UHF method. Nevertheless, we were able to classify the types of discharge faults, like floating discharge, corona discharge, void discharge, etc. With the data acquired by partial discharge measurement for a variety of places and data analysis, we will utilize the acquired data as fundamental information for the study on the management of a high-voltage distribution system that is effective in live wires, as well as risk assessment methods.