Because of the importance of small target detection in infrared images, many studies have been carried out in this area. Some of the techniques used to estimate a background and obtain the target location include a linear diffusion filter, anisotropic diffusion filter [1], maximum likelihood filter [2], mean shift filter [3], and two-dimensional LMS (TDLMS) filter [4]. It is very difficult to detect a small target in infrared still images with a complex background because of the irregular noises and low SNR [5]. Any effort to detect a small target in infrared still images with a marine background inevitably faces some limitations since clouds or waves are included and appear with a strong noise. Research has been conducted on tracing a target in serial images with the target location obtained in still images in order to resolve such noises [6-9]. This research employed conventional tracing techniques to take advantage of noise irregularity in serial images including a Kalman filter [10], extended Kalman filter [11], and particle filter [12]. These algorithms demonstrate excellent performance in real-time tracing but have some limitations with the application to image processing due to the weak associations among targets in serial images with noises and background interference. Some methods can be used to resolve those problems such as the Probabilistic Multiple Hypothetic Tracking (PMHT) [13] algorithm and the mean shift algorithm [14]. The PMHT algorithm tracks a target by associating small targets in serial images based on the EM algorithm [15] and has a disadvantage of requiring preliminary information on the number of targets. Research has been carried out to help to overcome the disadvantage [16]. The mean shift algorithm is a powerful method used to find extreme values in the dense distribution of data sets, demonstrating great performance in moving nonlinear targets and powerful associations among targets in serial images. However, it also has some disadvantages including requiring early information on targets and research in the case of target appearance and disappearance. This study proposes an algorithm to track multiple small moving targets even in the case of target disappearance and appearance in serial infrared images in an environment with many noises by using a Kalman filter and mean shift algorithm.
2. PROPOSED MULTIPLE TARGET DETECTING AND TARCKING TECHNIQUE
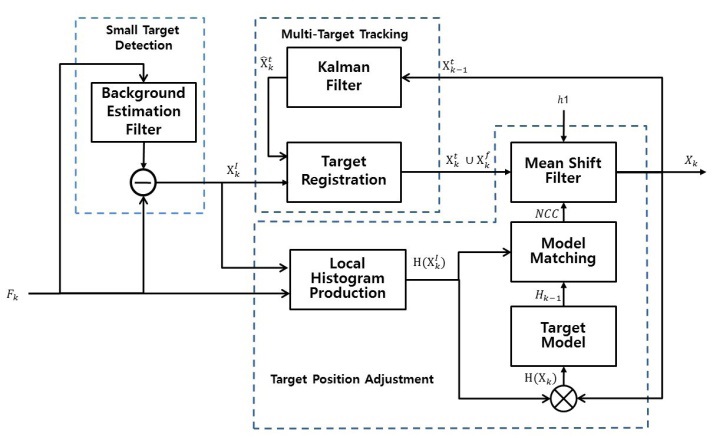
Target detection in still images has a limitation of increasing errors detected when the image has many clutters. Such a limitation is resolved by using the non-uniformity of noise information, which includes location, shape, and brightness, in serial images as important information for target detection. Figure 1 shows the system flow chart of the proposed multiple target tracking technique.
2.1 Background estimation filters
The study first estimated image backgrounds in order to detect small targets in still infrared images in a much cluttered environment by introducing and utilizing the existing filters. The study applied and compared several filters including a linear diffusion filter, anisotropic diffusion filter, maximum likelihood filter, mean shift filter, and 2D LMS filter to background estimation, assessing their performance. The filter with the highest performance was used to detect candidate targets in a frame for multiple target tracking.
2.1.1 Linear diffusion filter
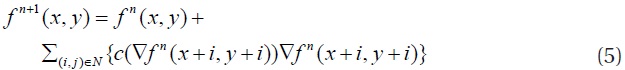
A linear diffusion filter determines a pixel value by combining surrounding pixel values linearly. When filtered and processed in such a way, images become blurry as if a low pass filter had been used. The diffusion equation of a linear diffusion filter is shown in equation (1):
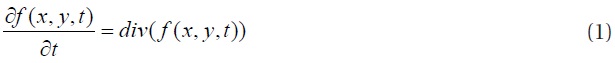

where N is the neighbor of (x,y),
2.1.2 Anisotropic diffusion filter
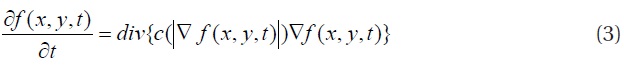
An anisotropic diffusion filter varies the filtering degrees of targets and backgrounds as a nonlinear filter to avoid the local, blurry problems of a linear diffusion filter. An anisotropic diffusion equation is expressed in equation (3):
where

This is a decreasing function with
Here,
2.1.3 Maximum likelihood filter
A maximum likelihood filter estimates a parameter with some samples and uses it for image segmentation. The pixels of segmented images are used to determine the mean value of each area. A likelihood function to estimate a parameter is shown in equation (6):
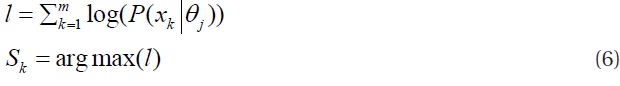
Equation (6) is used to estimate a parameter, which is, in turn, used to segment areas according to the classes of which the likelihood functions are a maximum. The means of segmented areas are obtained as in equation (7):
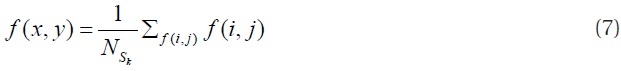
where
2.1.4 Mean shift filter
A mean shift filter calculates a mean shift vector to obtain the mean locations of pixels that have a similar brightness distribution A mean shift filter evens out the brightness values while conserving the image boundaries. The mean shift vectors of pixel values are calculated as shown in equation (8):
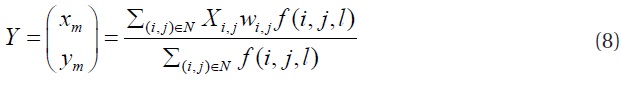
where
2.1.5 2D LMS filter
A 2D LMS(TDLMS) filter is an extended version used to process first-dimensional LMS in a two-dimensional image. Such an s filter predicts the pixels of the resulting images based on the window weights. Errors are calculated by comparing the predicted pixels with the desired results as in equation (9):

where
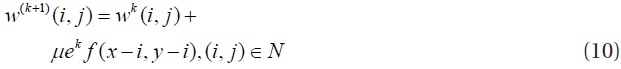
where

where
Difference images, which highlight the background images estimated with a background estimation filter from the original images, have a relatively very bright value, which becomes a candidate target area. Background estimation results are compared and analyzed by obtaining the means of the target areas of difference images and those of the remaining areas and comparing their performance. The filter with the highest performance is used to detect a target candidate for multiple target tracking.
2.3 Multiple target tracking technique
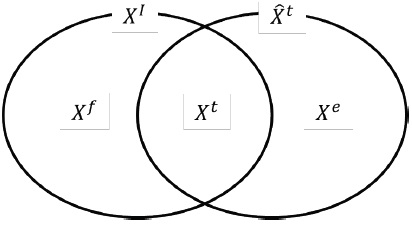
Multiple target tracking consists of a Kalman filter section (target position prediction) and candidate target classification section (target selection) in a system flow chart. The system removes error detection from the detection results of candidate targets in still images and associates targets in serial images. Target association refers to making a judgment to see whether a random target
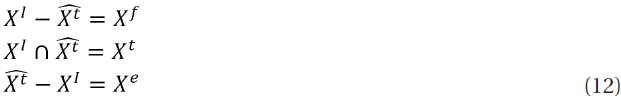
At the stage of detecting the locations of candidate targets in still images, targets are separated from backgrounds with the critical values of the original images and the difference images from the images obtained through a background estimation filter to acquire target locations. At the stage of classifying target candidates according to noises or targets, we calculate the candidate target location

predicted in Frame

of targets that have been tracked. When the location information of targets detected in still images matches the predicted location information of targets that have been tracked, they are classified as "candidate targets that have been tracked (
When candidate targets are classified as "candidate targets that have been tracked
2.4 Accuracy enhancement technique of target tracking
The accuracy of target tracking can be enhanced by local histogram production, target model update, NCC model matching, and mean shift adjustment in a system flow chart. The system fine-tunes the locations of targets detected in still images and the locations of targets predicted with a Kalman filter, thus improving the stability of a target tracking system.
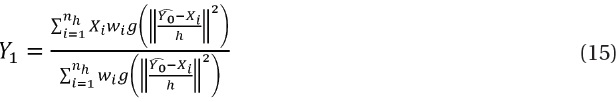
The stage of the fine-tuning target locations uses input images(
where,

where
where
Mean value of difference between the original and the filtered images in the background area and the target area.
into the location of the result (
An experiment was conducted to compare the performance of background estimation filters needed in the entire system.
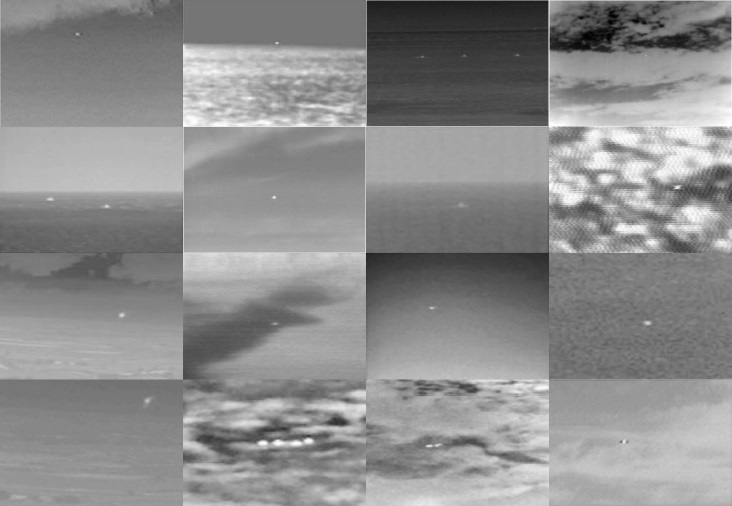
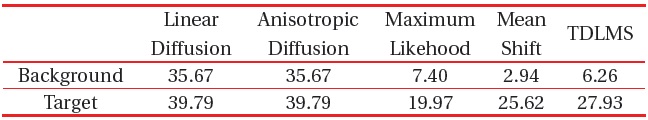
The performance of background estimation filters is determined by comparing the difference operation means of the target areas and those of the remaining areas in the difference operation results of the background and original images calculated with each background estimation filter. Figure 3 shows images included in the target and background.
When the difference means of the target areas are high in the result images of the difference operation and have a greater difference from those of the background areas, the performance of the background estimation filter is considered to be excellent. Since the remaining areas other than the target areas can be seen as noises in the difference operation results, the ratio between target and background in Table 1 can be the signal-to-noise ratio (SNR). The experiment results reveal that the mean shift filter (MSF) had the highest SNR and was thus considered to be superior. It was used as a target candidate detection filter in a frame in the object tracking process.
The tracking performance of the proposed tracking system was examined by implementing and comparing the first order Kalman filter and the mean shift algorithm only. Thirty marine infrared serial images were used in the comparison, with four small targets that had a still image for one second. The proposed system was capable of processing when a new target was produced and lost, but the other systems in the comparison equation were not capable of such processing and accordingly used serial images with no target disappearance and production. The proposed system used a mean shift filter that demonstrated relatively good performance in the experiment for background estimation.
Judging the error detection of candidate targets or the assessment
of target reliability (C1, C2) was straightforward as follows: those candidate targets that were classified as "candidate targets that have been tracked (
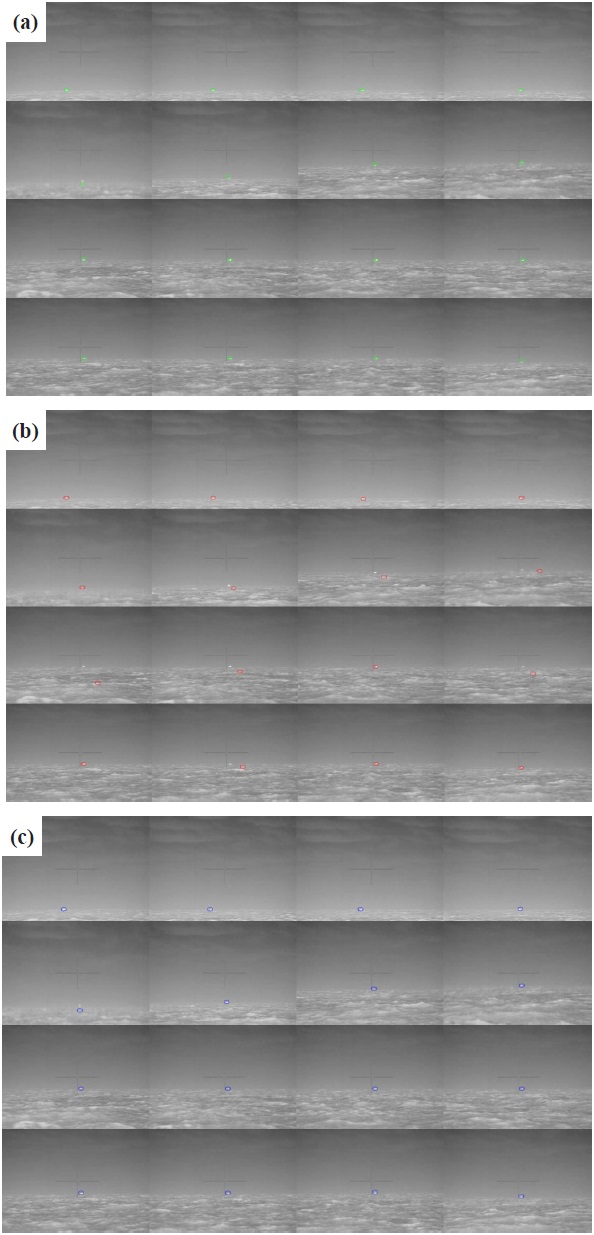
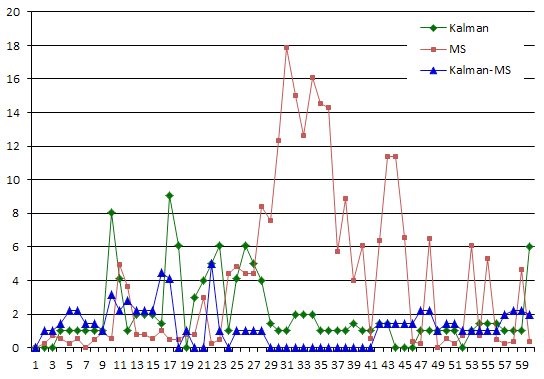
Figure 4 shows part of the result image of introducing an experiment image into each tracking system. Figure 5 presents the mean location errors of four targets tracked with each tracking system. The first order Kalman filter had no diffusion in tracking locations and accordingly demonstrated relatively high stability, but its tracking location errors were high. The mean shift algorithm showed overall high tracking location errors as the target tracking location diffused and converged to a point in the sky starting with the 19th image. The proposed system recorded the lowest tracking location error except for the 18th image and showed relatively high stability with no tracking location diffusion.
The paper proposed a system to track the locations of multiple small targets in serial infrared images by using a background estimation filter, Kalman filter, and mean shift algorithm. The study compared and assessed various background estimation filters for performance and used a Kalman filter and candidate target classification to allow for target tracking and ensure no location tracking diffusion even in the case of target disappearance and production. In addition, the final target detection locations were revised with the mean shift algorithm having comparatively low tracking location errors and allow for continuous tracking with standard model updating. The experiment used each background estimation filter with actual marine infrared still images, obtained SNR in the original and difference images, and found that the mean shift filter recorded the highest SNR and relatively good performance. In the experiment with actual marine infrared serial images, the proposed system was compared with the Kalman filter and mean shift algorithm. As a result, the proposed system recorded the lowest tracking location errors relatively and ensured stable tracking with no tracking location diffusion.