The dielectric anisotropy and dispersion of the real and imaginary part of the permittivity of commercially important nematic mixture E-24 and its polymer composite were investigated in the frequency range from 1 kHz to 10 MHz, and temperature range 14℃ to 55℃. The percentage optical transmittance and density have also been measured for both the systems. The results have been explained by assuming molecular rotation about the long molecular axis, under a hindering nematic potential. The dielectric anisotropy Δε is positive, and the mean dielectric permittivity falls with rising temperature. Δε is also used to determine the order parameter with varying temperature.
Liquid crystals are one class of compounds that have potential applications in many devices. The development and application of polymer-dispersed liquid crystals has become an area of great interest in liquid crystal research. A number of composites have been developed [1-5], to produce novel liquid crystal phase behavior and properties. Dielectric properties of polymer- liquid crystal composites are of immense practical importance, as they have a strong bearing on electro-optic performance characteristics. The invention of polymer not only increases the inherent mechanical strength of the material [6], but also changes the phase behavior, along with its electro-optic properties. Conversely, the directional ordering present in the liquid crystals may influence the polymerization behavior, and thereby change the polymer morphology. It has been shown [7,8] that the composites can be regarded as a heterogeneous system, comprised of small liquid crystal droplets embedded in an isotropic matrix. Dielectric properties of such a composite are entirely different from those of the initial materials, such as pure polymer and pure liquid crystal [9]. A dispersion in dielectric permittivity at a lower frequency range (~ 1 kHz) for such a heterogeneous system is due to space charge built up at the liquid crystal-polymer interface [9]. At higher frequencies, beyond the space charge relaxation frequencies, the contribution towards the permittivity is minimum.
Temperature plays a dominant role in the electro-optic performance of liquid crystal polymer composites [10]. Few studies have been carried out on how the dielectric properties of the composites are modified with increase in temperature.
Many investigators used the optical transmittance method to measure the transition temperature, since the optical transmittance is probably one of the most accurate and precise methods to obtain the information about the transition temperature [11,12]. Our group has also reported the effect of polymer on the dielectric and optical properties of smectic A liquid crystals [13]. Studies on pure and dye doped nematic liquid crystal E-24, have already been published [14,15].
In the present paper, we report the dielectric parameters, anisotropy, optical transmittance and density of the polymer-liquid crystal composite. The optical transmittance measurement has also been carried out for liquid crystal-polymer composite, and for pure liquid crystal.
The sample used for the present investigation was the nematic mixture E-24, supplied by BDH England (BDH Catalogue, 1978, BDH chemicals, pp. 19-28). The transition scheme of the sample is as follows:
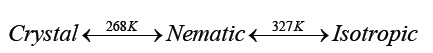
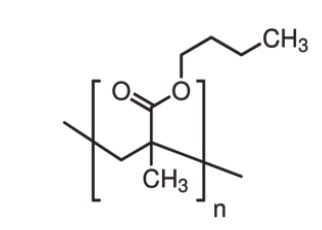
E-24 was selected, due to its nematic range at room temperature. The polymer used in the present study is Poly Butyl Methacrylate (PBMA). The molecular weight of the polymer is 337,000. Its structure is given in Fig. 1. The method of preparation of doped sample has also been published in our earlier papers [13,16].
Values of the capacitance and dissipation factor of the sample holder with, and without sample, were determined by impedance/ gain phase analyzer of Hewlett-Packard (HP 4194A). The real part of the permittivity of the sample is obtained from the change in the capacitance value of the sample holder, due to the presence of sample, using the following equation:
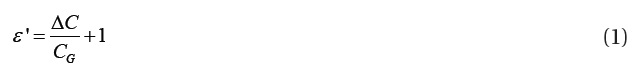
where, ΔC, the change in the capacitance of sample holder due to the presence of sample, is

where, CP is the capacitance with sample, and C0 is the capacitance without sample. CG is the geometrical capacitance of the sample holder.
The loss tangent and dissipation factor (D) of the sample were derived from the dissipation factor and capacitance, measured for the sample holder with, and without sample, and is given by:
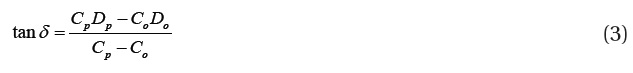
where, DP is the dissipation with sample, and Do is the dissipation without sample.
The loss factor is given by the following equation

Capacitance values were read up to three significant figures, and the values of the dissipation factor were recorded up to four significant figures in the present study.
The temperature of the sample was maintained by placing
the sample cell on a specially designed double walled brass chamber, in which heated oil was circulating, with the help of a Julabo F-25 refrigerated circulator. It has the facility of setting the temperature of the sensor used, and so the temperature of the sample, i.e. the sensor temperature, has been measured directly from the display of the monitor (Operating Manual, JULABO). The temperature was measured by placing a thermocouple in close vicinity to the sample, with an accuracy of 0.1℃.
2.2 Optical transmittance measurement
Sample was filled into the standard sample holder procured from Linkam Scientific Company having 5μ spacing, by heating it 10℃ above the clearing point, and then introducing the sample at one end of the sample holder. Then, the sample holder was placed on the polarizing microscope in crossed position, fitted with a hot stage arrangement connected to the Julabo F-25. The light intensity, coming through another eyepiece, was measured by the light dependent resistance (LDR). The resistance value of the LDR corresponding to varying light intensity, due to temperature variation of the sample, is proportional to the inverse of optical transmittance, and it has been directly read by a precise digital multimeter, and plotted in arbitrary unit with the temperature.
The density of the nematic liquid crystal mixture E-24 and its polymer composite, at varying temperatures, has been measured using a dilatometer. A travelling microscope of least count 0.001 cm was used to read the change in meniscus during thermal expansion [17]. The weight of the sample was taken by electronic balance (Sartorius, BP121), having a least count of 0.0001 gm. The temperature of the sample was again regulated using a double walled glass jacket, fitted with the Julabo F-25.
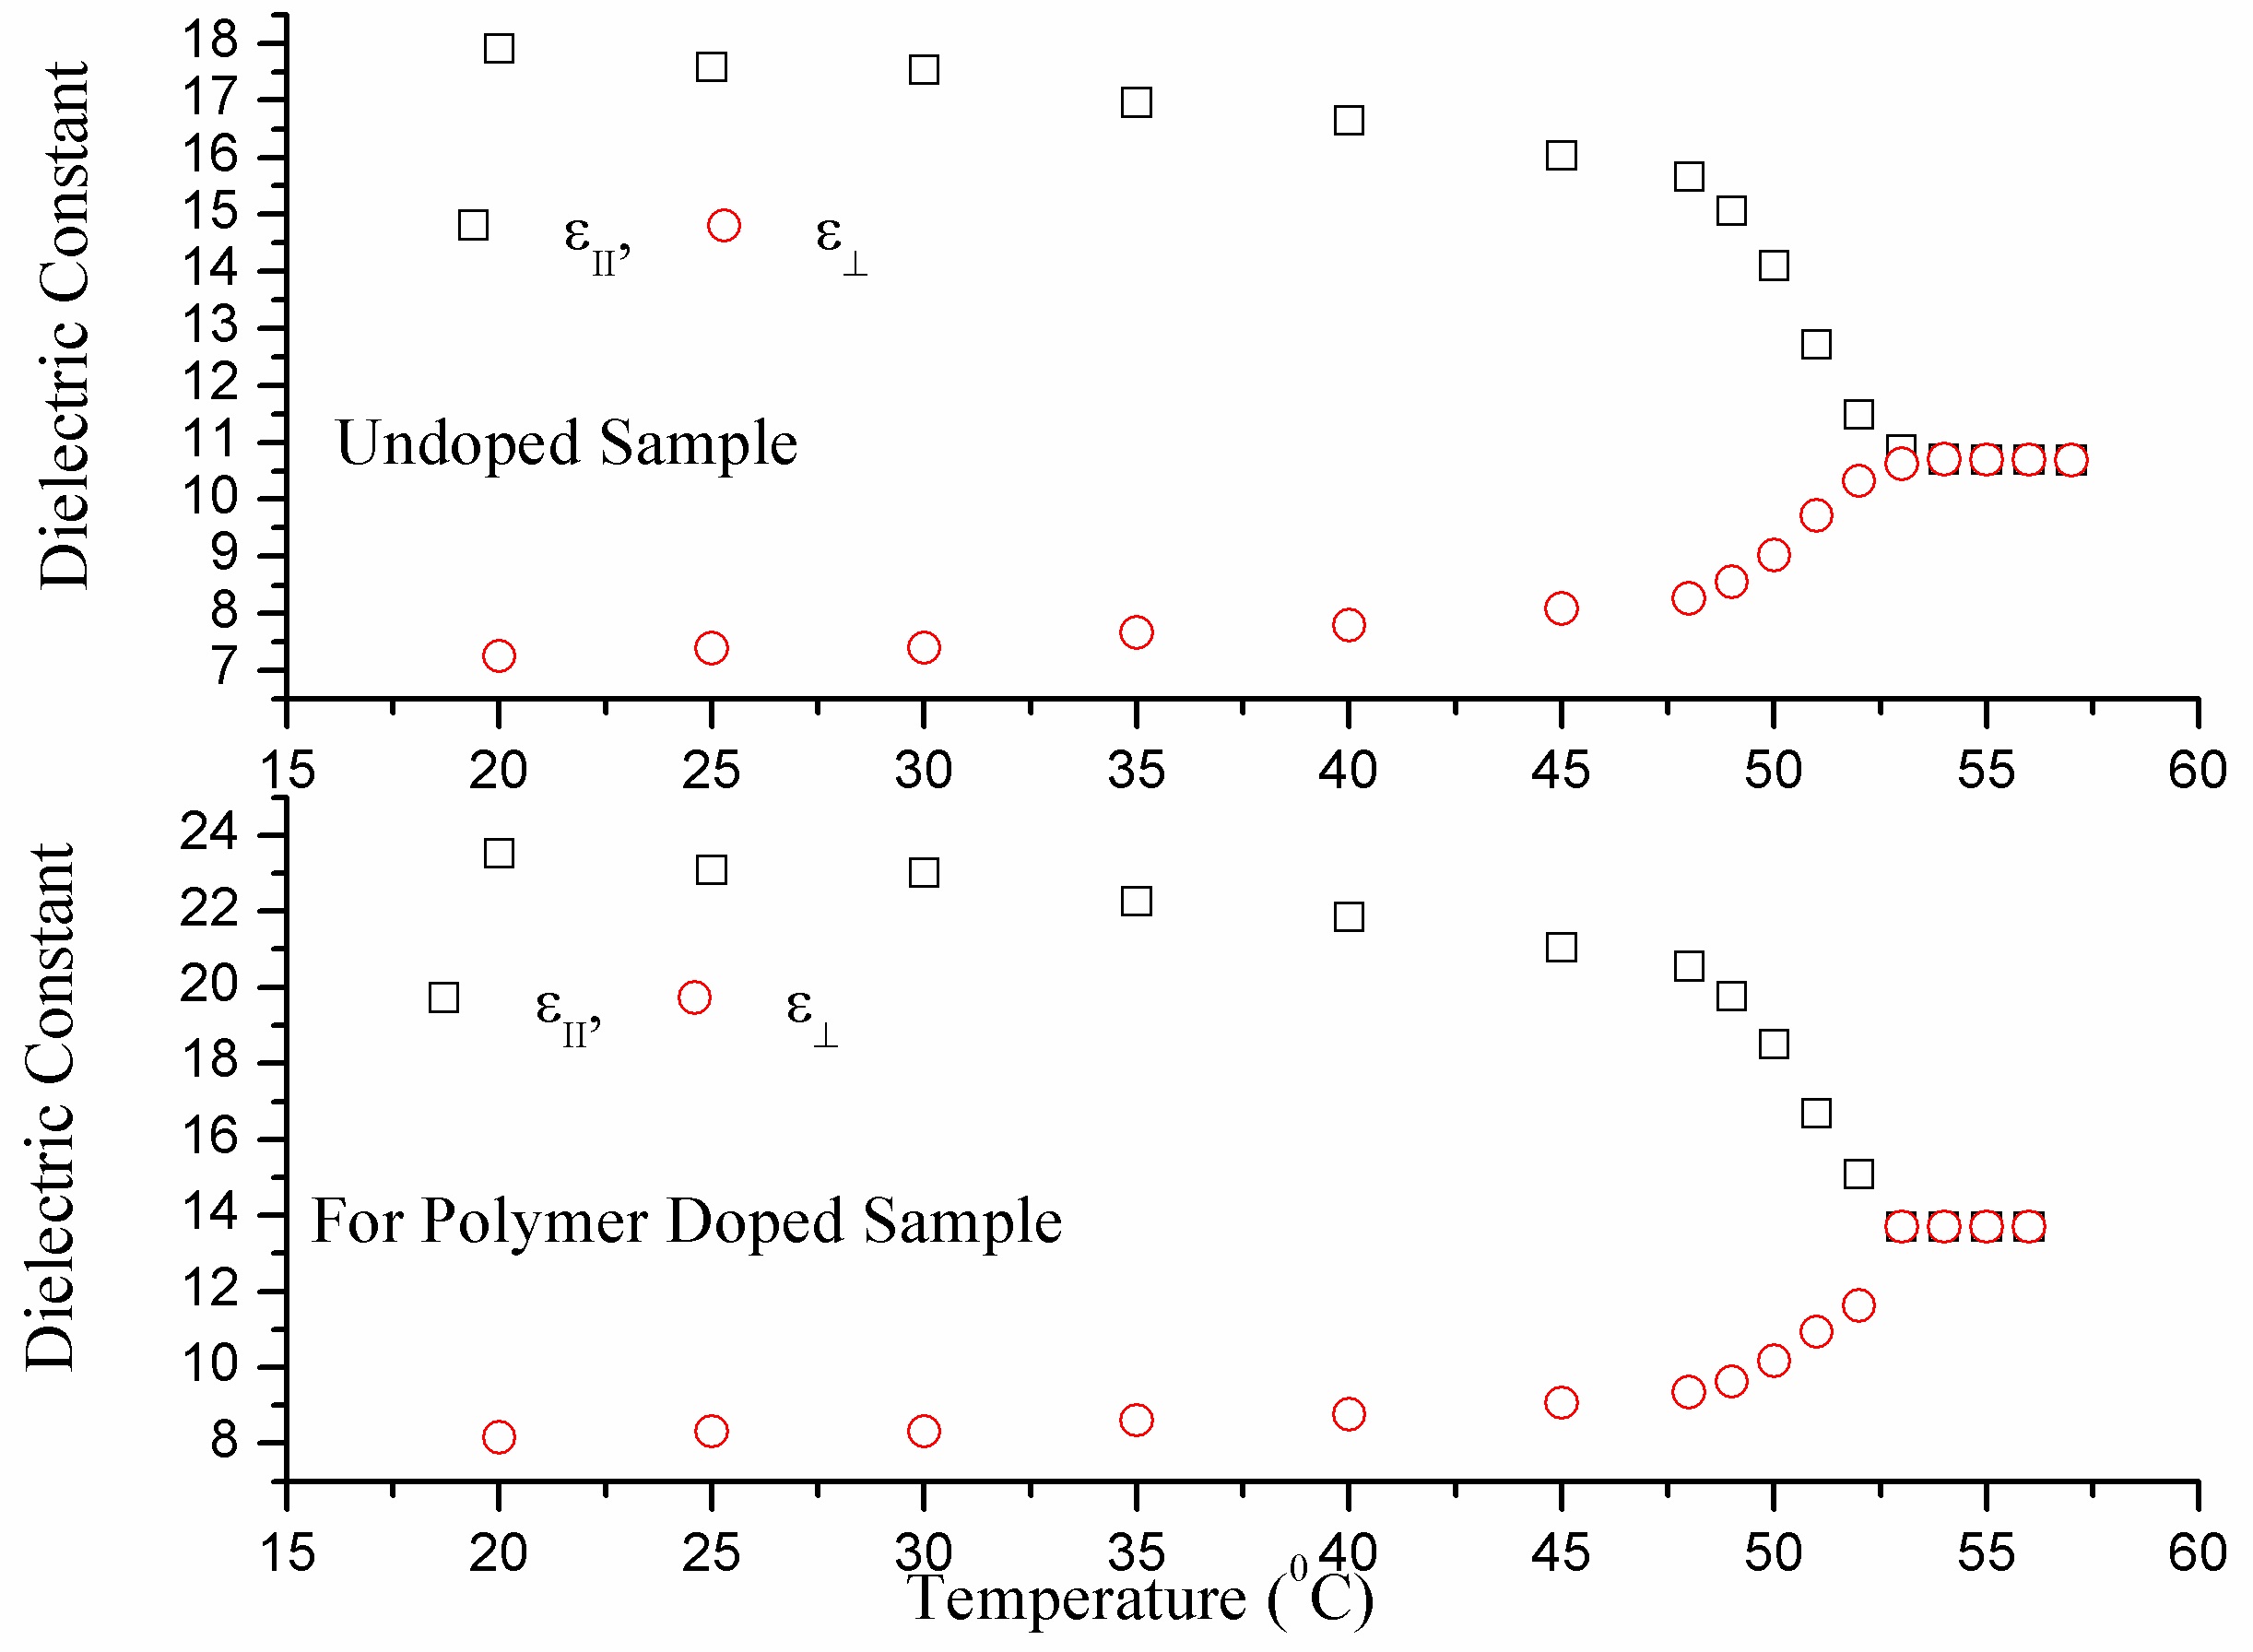
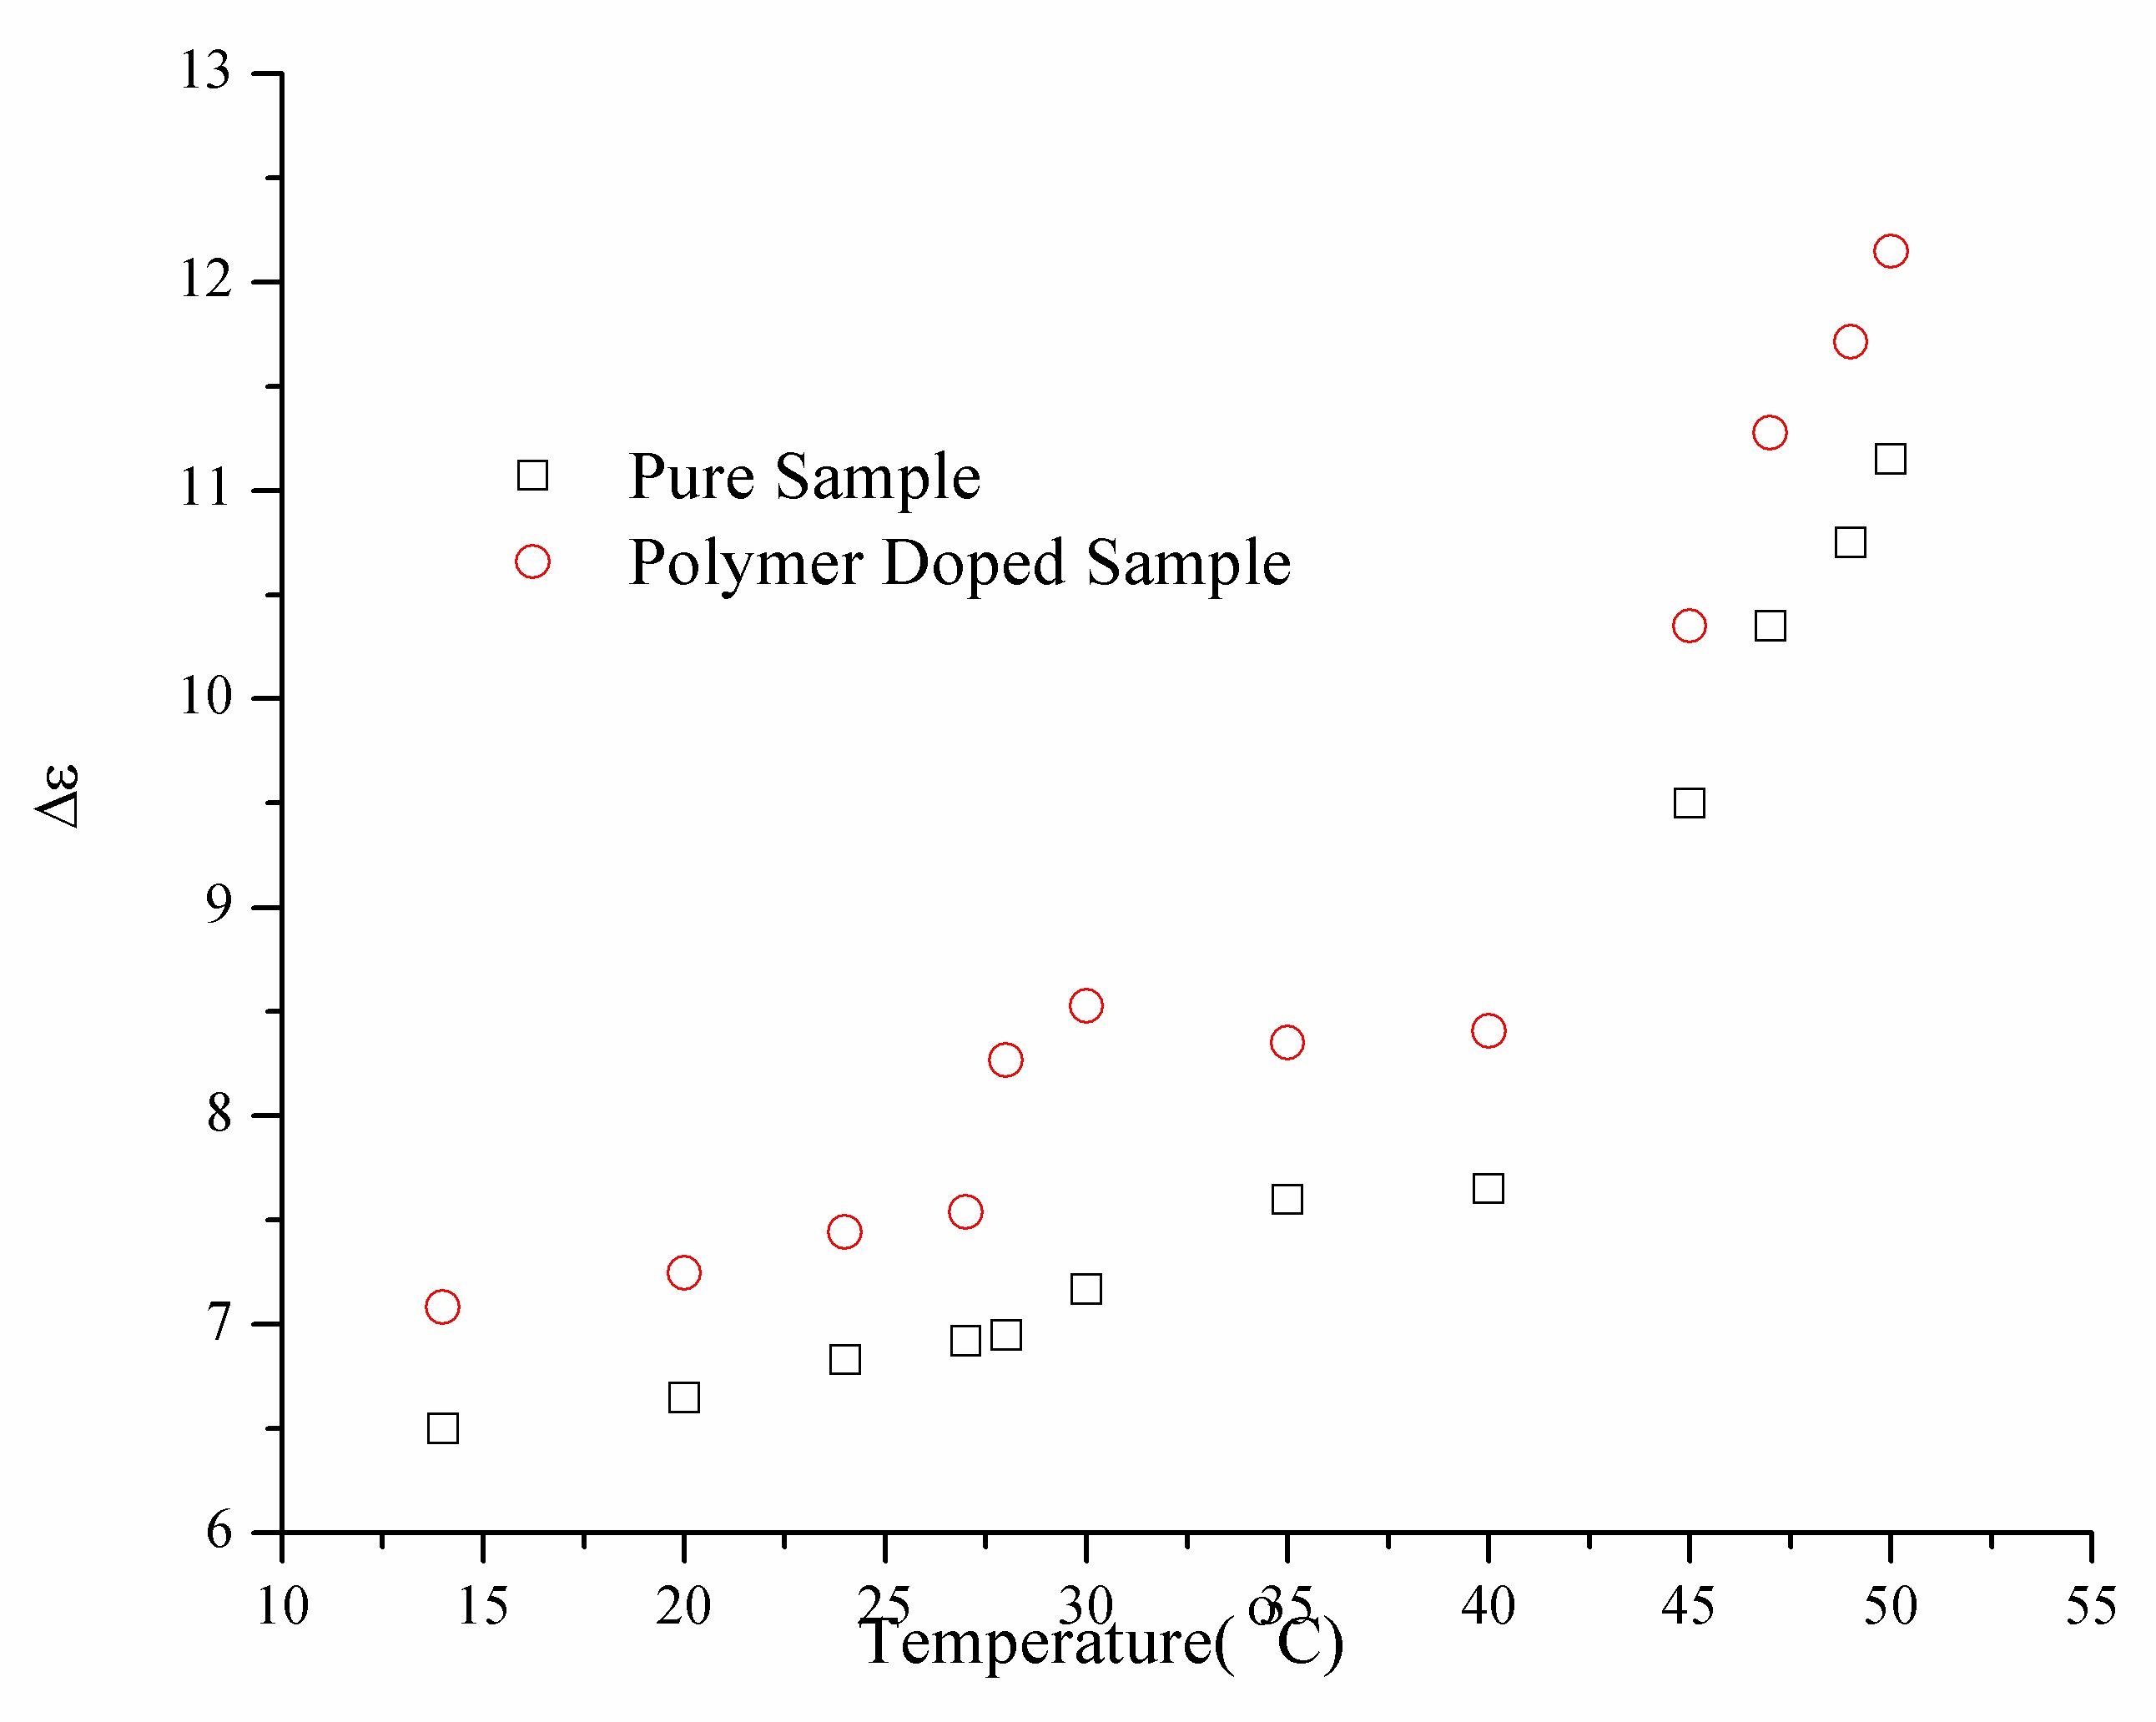
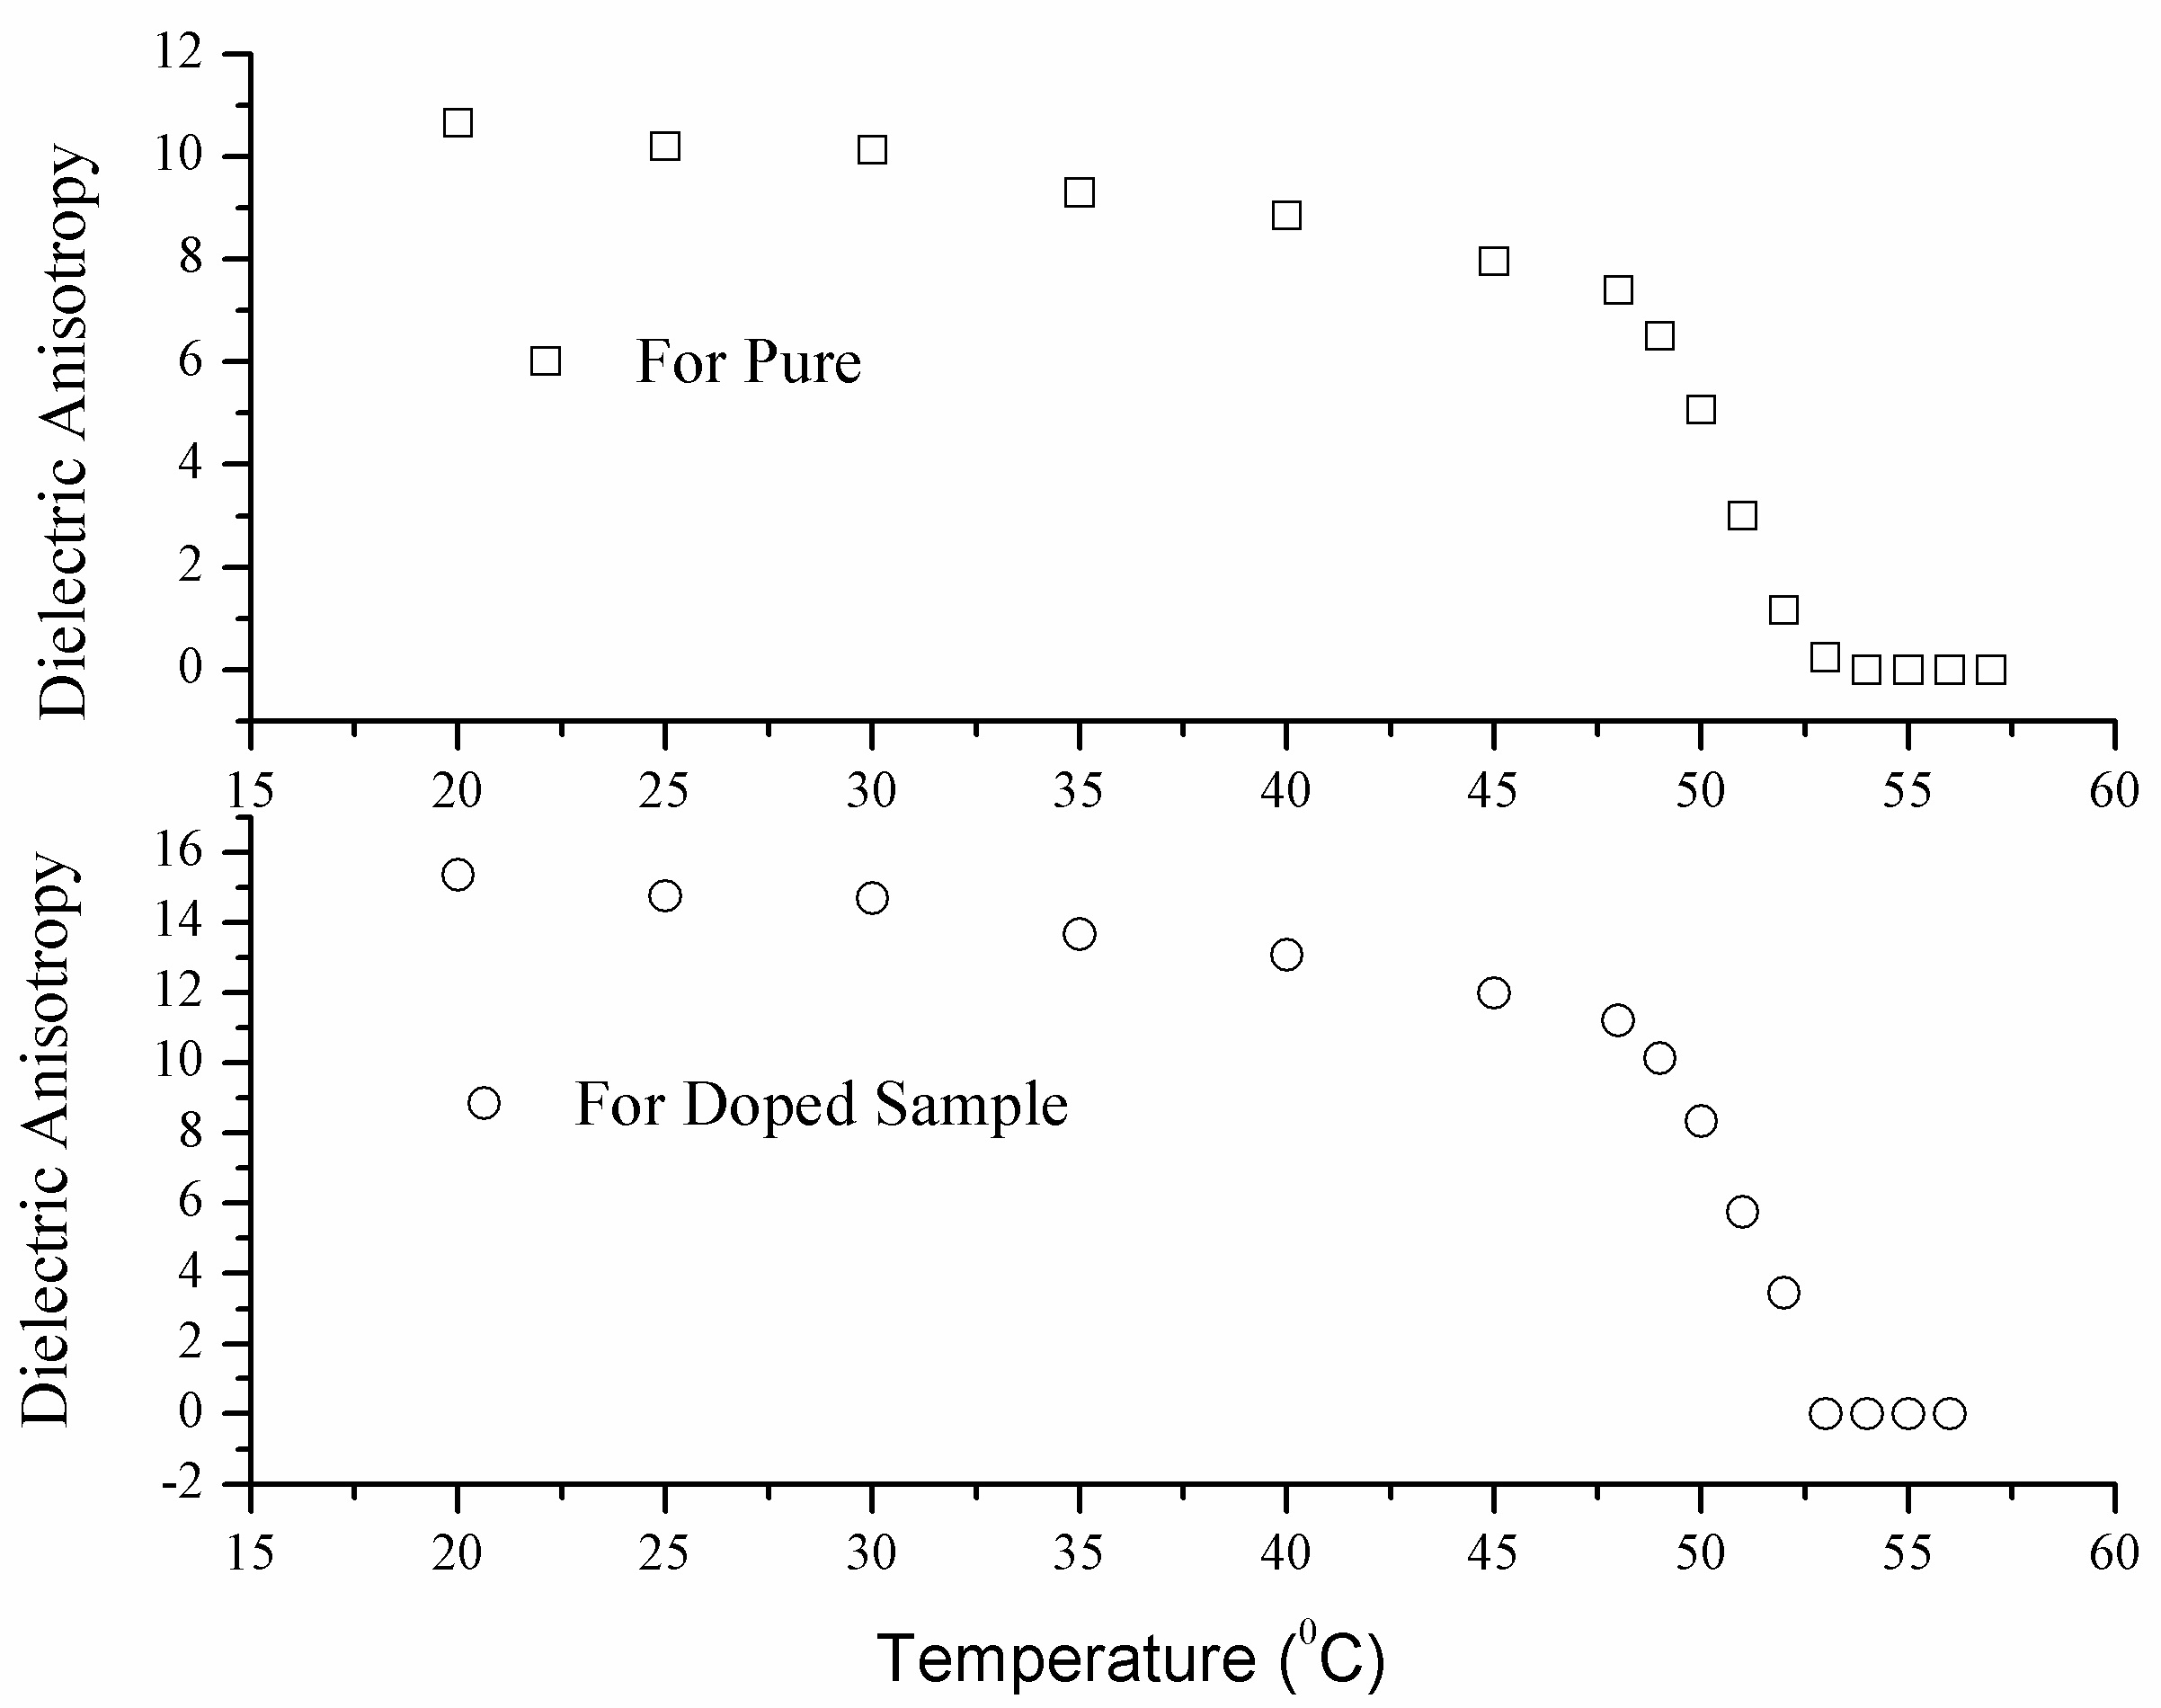
The dielectric parameters have been measured for nematic mixture E-24 and its polymer composite, in the relaxation frequency range of 1 kHz to 10 MHz, for the temperature range of 14℃ to 55℃. The variation of ε⊥, ε∥ and Δε, dielectric anisotropy with the temperature, are shown in Figs. 2(a), 2(b) and 2(c), respectively.
The dielectric permittivity shows the usual trend for the pure sample, as well as for the polymer composite. The nature of variation for the perpendicular and parallel component is the same, but the value of permittivity also increases for both the components (ε⊥, ε∥). This increase in the parallel component is higher for the polymer doped system, and it, in turn, increases the dielectric anisotropy of the composite system (as shown in Fig. 2(c)).
Figure 2(b) describes the variation of dielectric strength of pure, as well as polymer composite system with temperature in
the nematic phase, for the longitudinal component of the dielectric permittivity. This type of behaviour is exhibited from the rotation of the molecule along the long molecular axis, which is supported by A. Hourri
The nematic mixture E-24 has positive anisotropy, and the behaviour of the dielectric anisotropy with the change in temperature can be explained on the basis of the Maier and Meier theory [19] (Fig. 2(c)), which yielded:
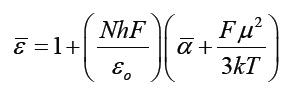
and,
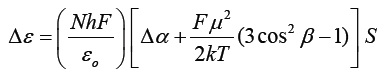
where, the symbols have their usual meaning. Since for nematic liquid crystals, Δα is always positive, the nature of dielectric anisotropy is governed by the magnitude and direction of dipole moment μ with the long molecular axis. If 3cos2β = 1, the dipole contributes equally to ε⊥ and ε∥, and Δα is dependent on the positive anisotropy of polarizability (α) [20].
The temperature dependence of the order parameter S is among the most important factors, near the nematic-isotropic phase transition temperature. It is clear from the graph that increases with decrease in temperature, and at lower temperatures, the counteracting S-T dependence of the orientational polarization predominates, and we get an almost constant dielectric anisotropy Δε [21]. Similar behaviour of dielectric anisotropy has also been observed in other nematic mixtures [21,22].
The anisotropy of any physical quantity is a measure of its orientational order [23]. For the uniaxial liquid crystal, it is defined as Q = δA/ΔA. Here, dielectric anisotropy has been used for determination of the order parameter.
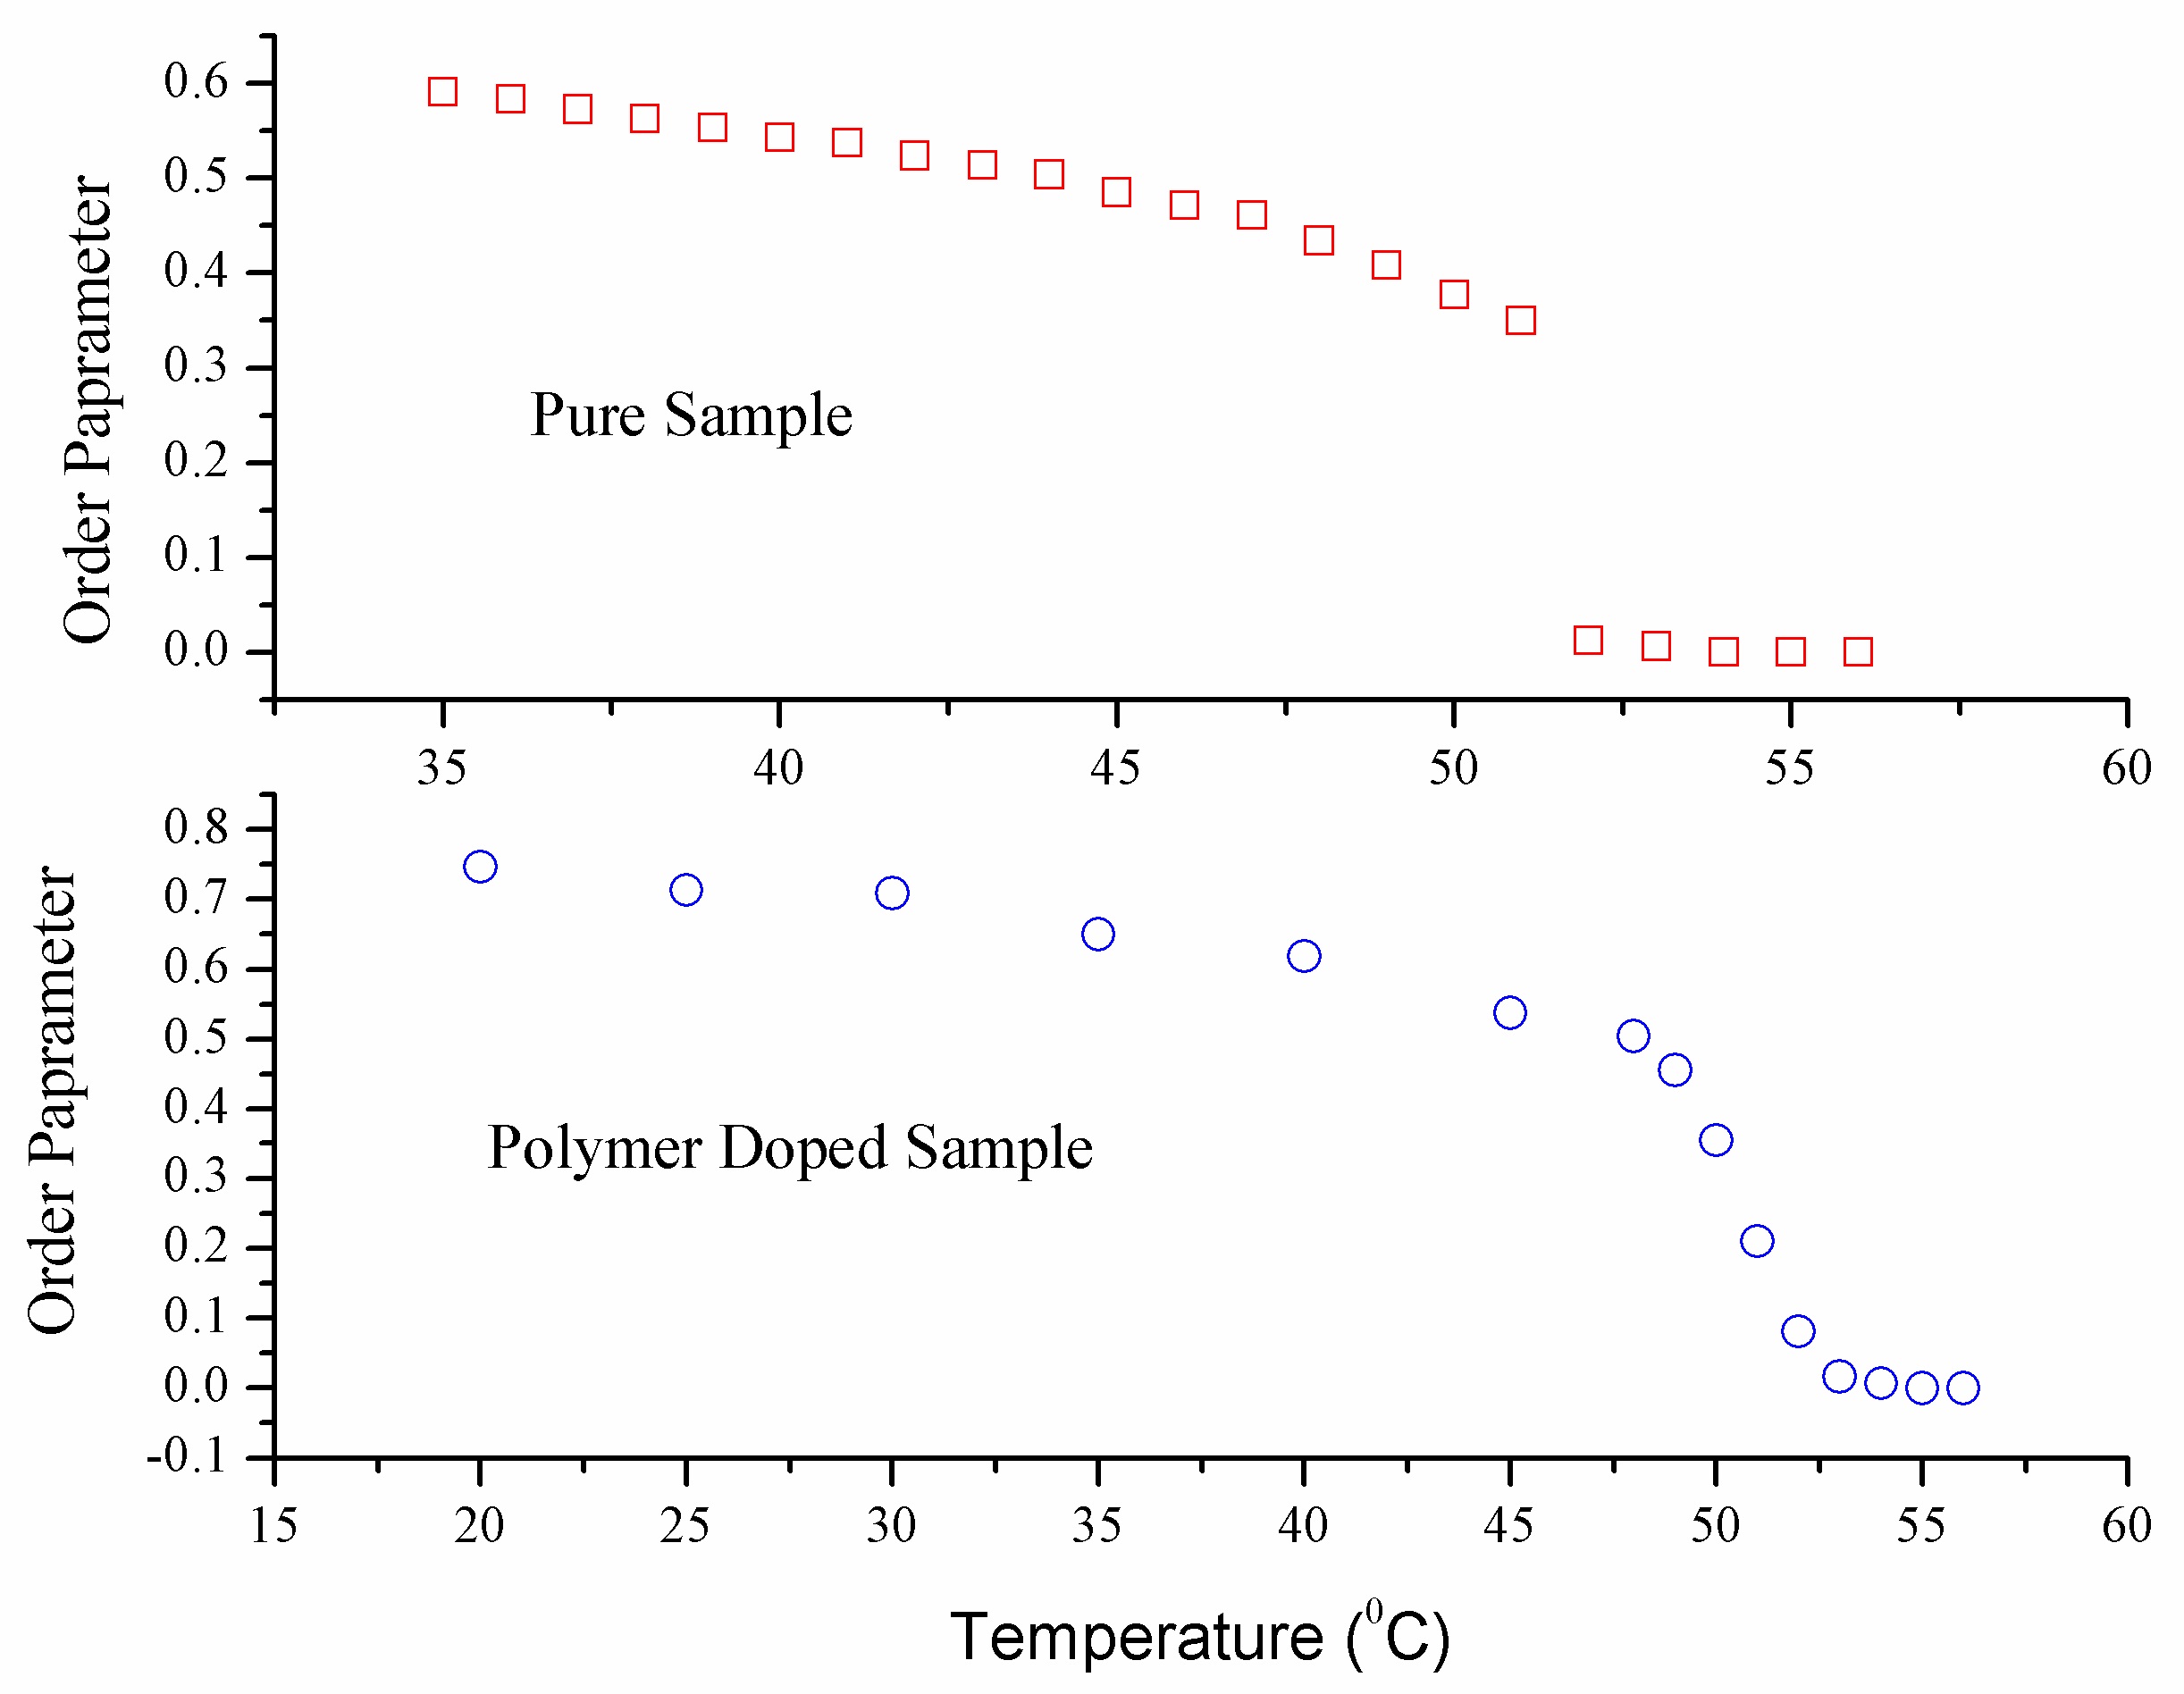
The temperature dependence of the order parameter is shown in Fig. 3. The order parameter varies almost in the same manner as the dielectric anisotropy with the variation of temperature. The resemblance is very well expected, as discussed above. The order parameter of the composite system is quite high for the lower temperatures, as compared to the pure nematic liquid crystal. Thus, it can be said that the addition of polymer improves the order parameter of the liquid crystal a lot, and makes it more suitable for its application in the devices.
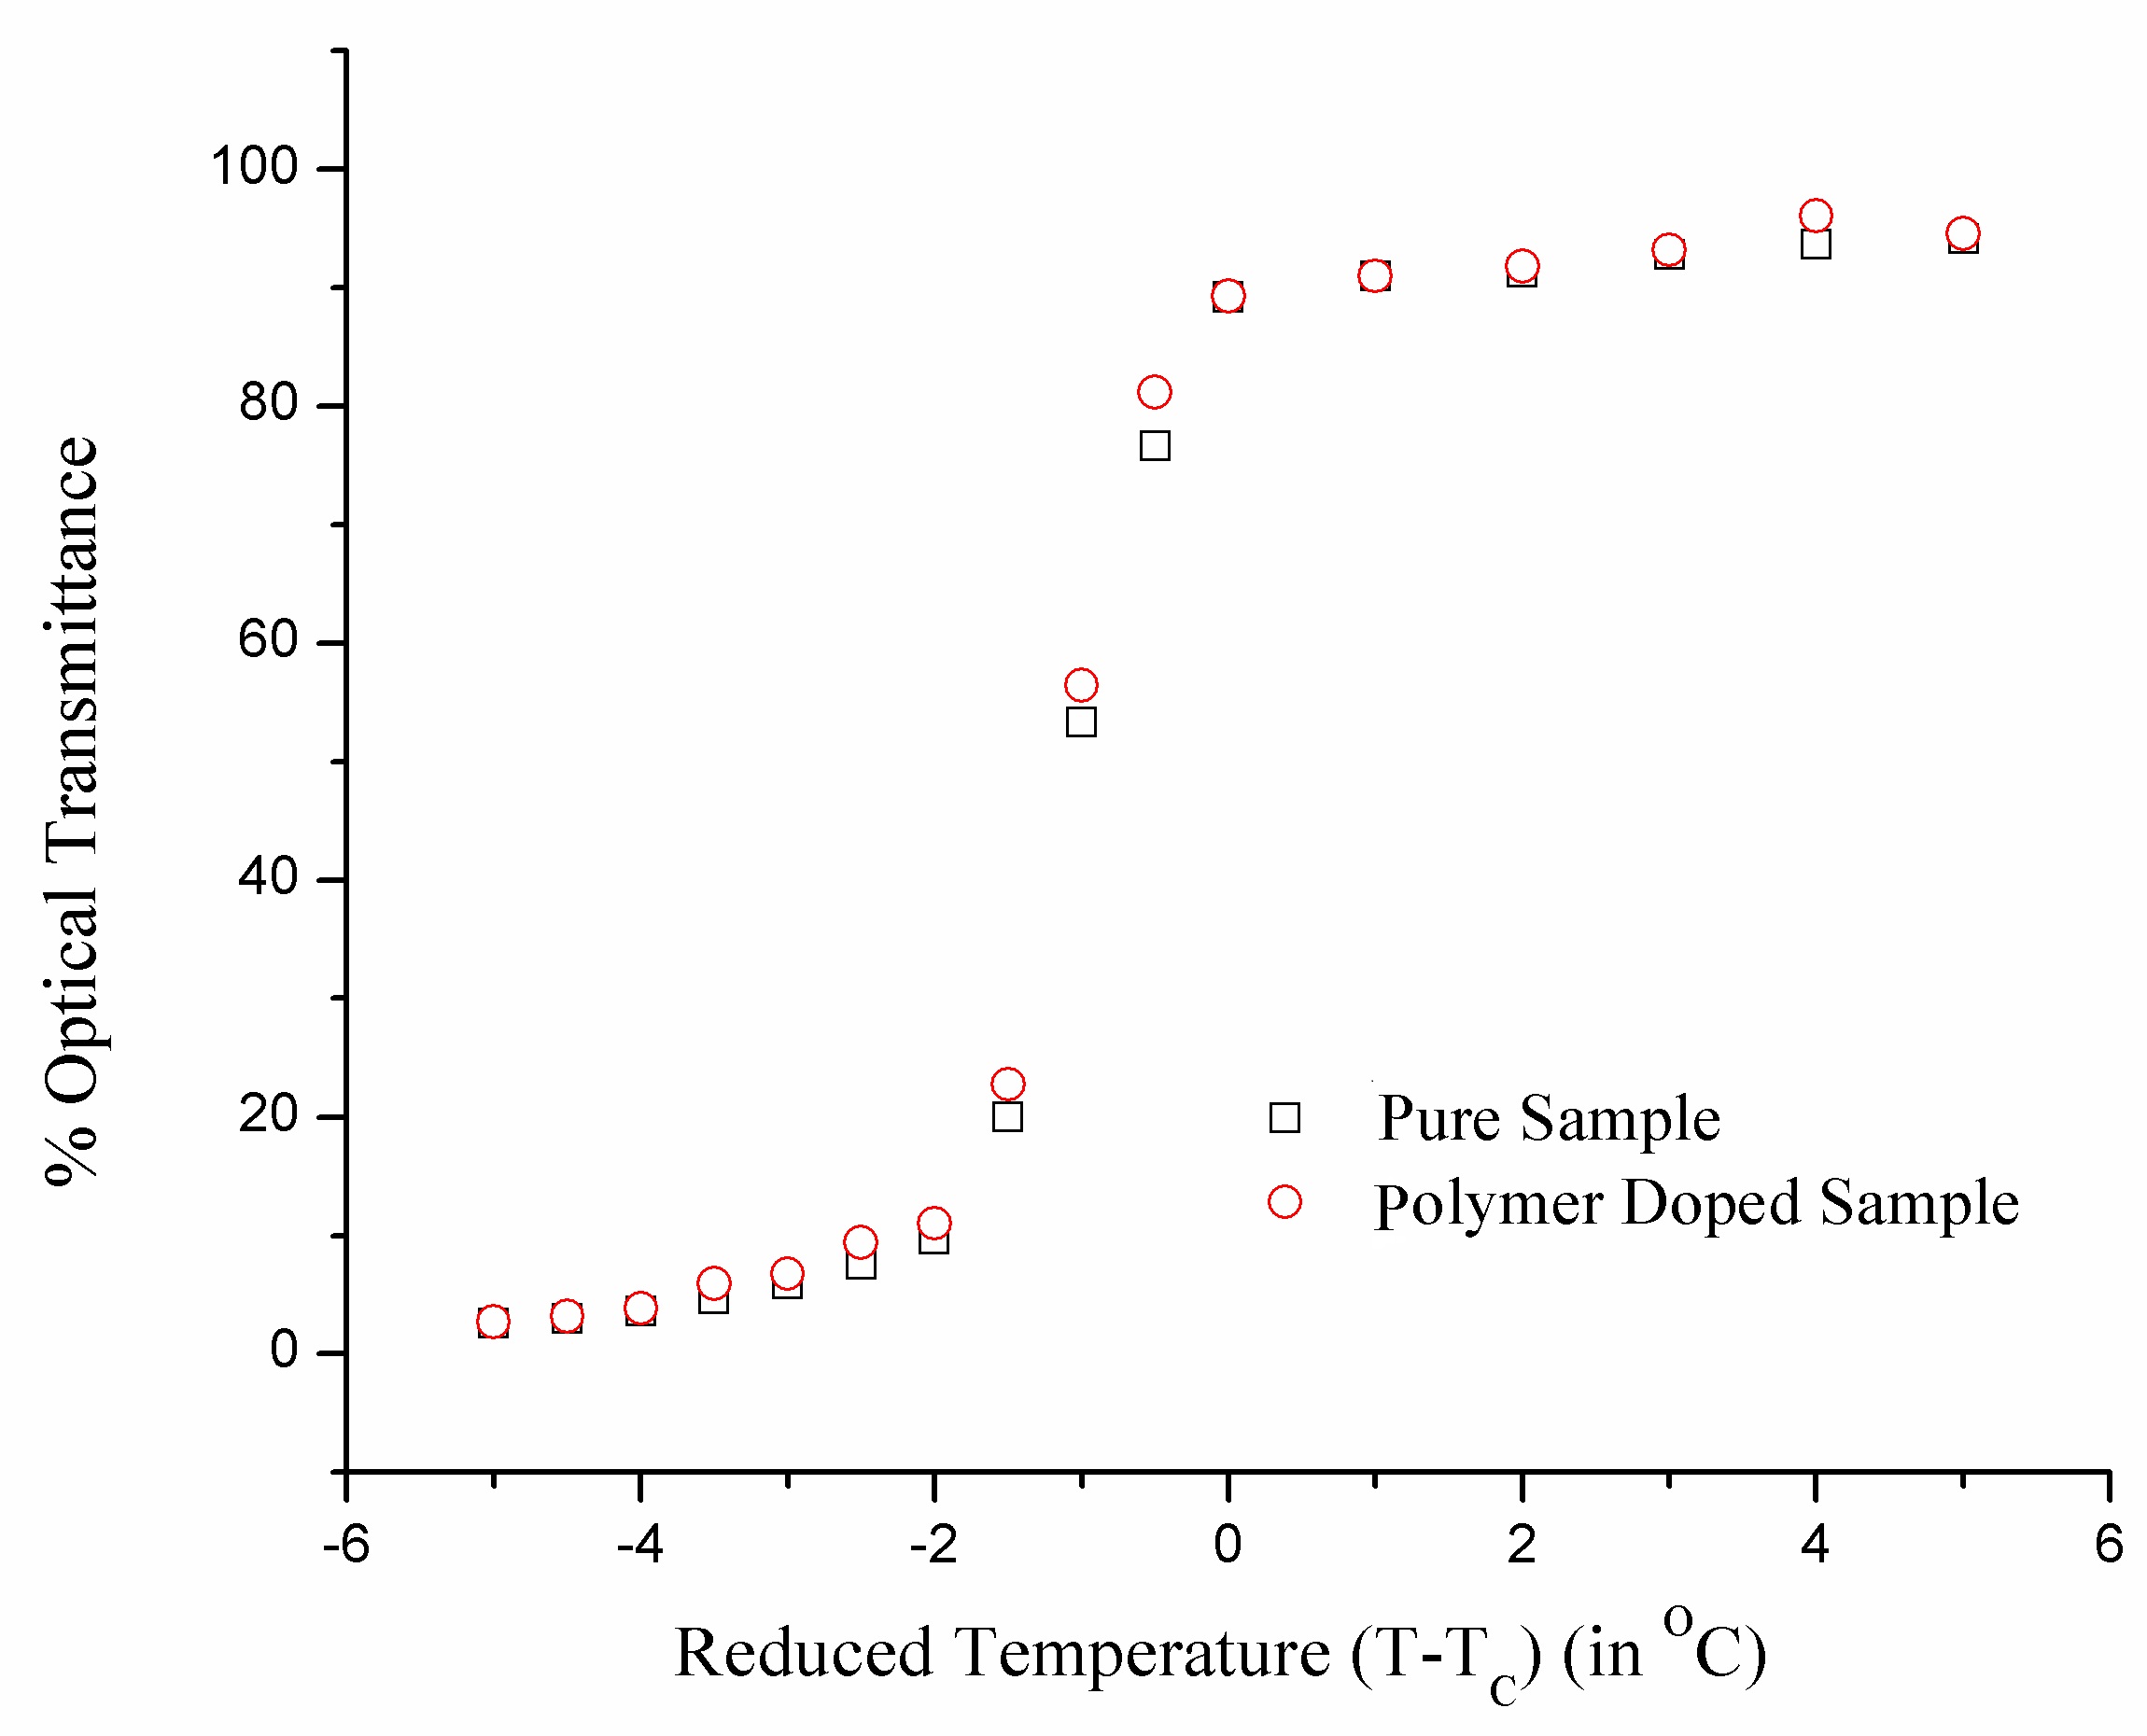
Figure 4 shows the variation of percentage optical transmittance with reduced temperature (T -TC). The temperature has
been reduced with respect to TC , i.e. N→I transition temperature. The use of reduced temperature is a common practice, as it clearly indicates the phase transition temperature and pretransitional behaviour [24]. In the present case, the temperature has been reduced, with respect to the nematic to isotropic phase transition temperature of the pure nematic mixture E-24. The value of optical transmittance increases slowly first, with increase in temperature, and then it increases rapidly near the nematic to the isotropic phase transition temperature. As soon as the sample goes into the isotropic phase, the optical impedance achieves its maximum value, i.e. nearly 92%, and after that it remains almost constant, with increasing temperature. This type of behaviour has been reported by our group, and other workers [13,25,26], for cholesteric, as well as nematic mixtures. The behavior for the pure and doped sample is almost the same, and the value of the percentage transmittance is also found to be nearly equal. This indicates that the addition of a small amount of polymer dopant does not affect the optical transmittance much.
However, the phase transition temperature of the composite system measured using polarizing microscope is not as sharp, as for the pure nematic sample. The breadth of the nematicisotropic phase was found to vary from 48℃ to 54℃. The breadth of the transition depends upon the purity of the substance, and it increases with lower purity. In the case of our sample, which is a nematic mixture, the different components behave as impurity with respect to each other, and that might be the reason for the biphasic region. This type of behaviour has already been reported by our group [13,16].
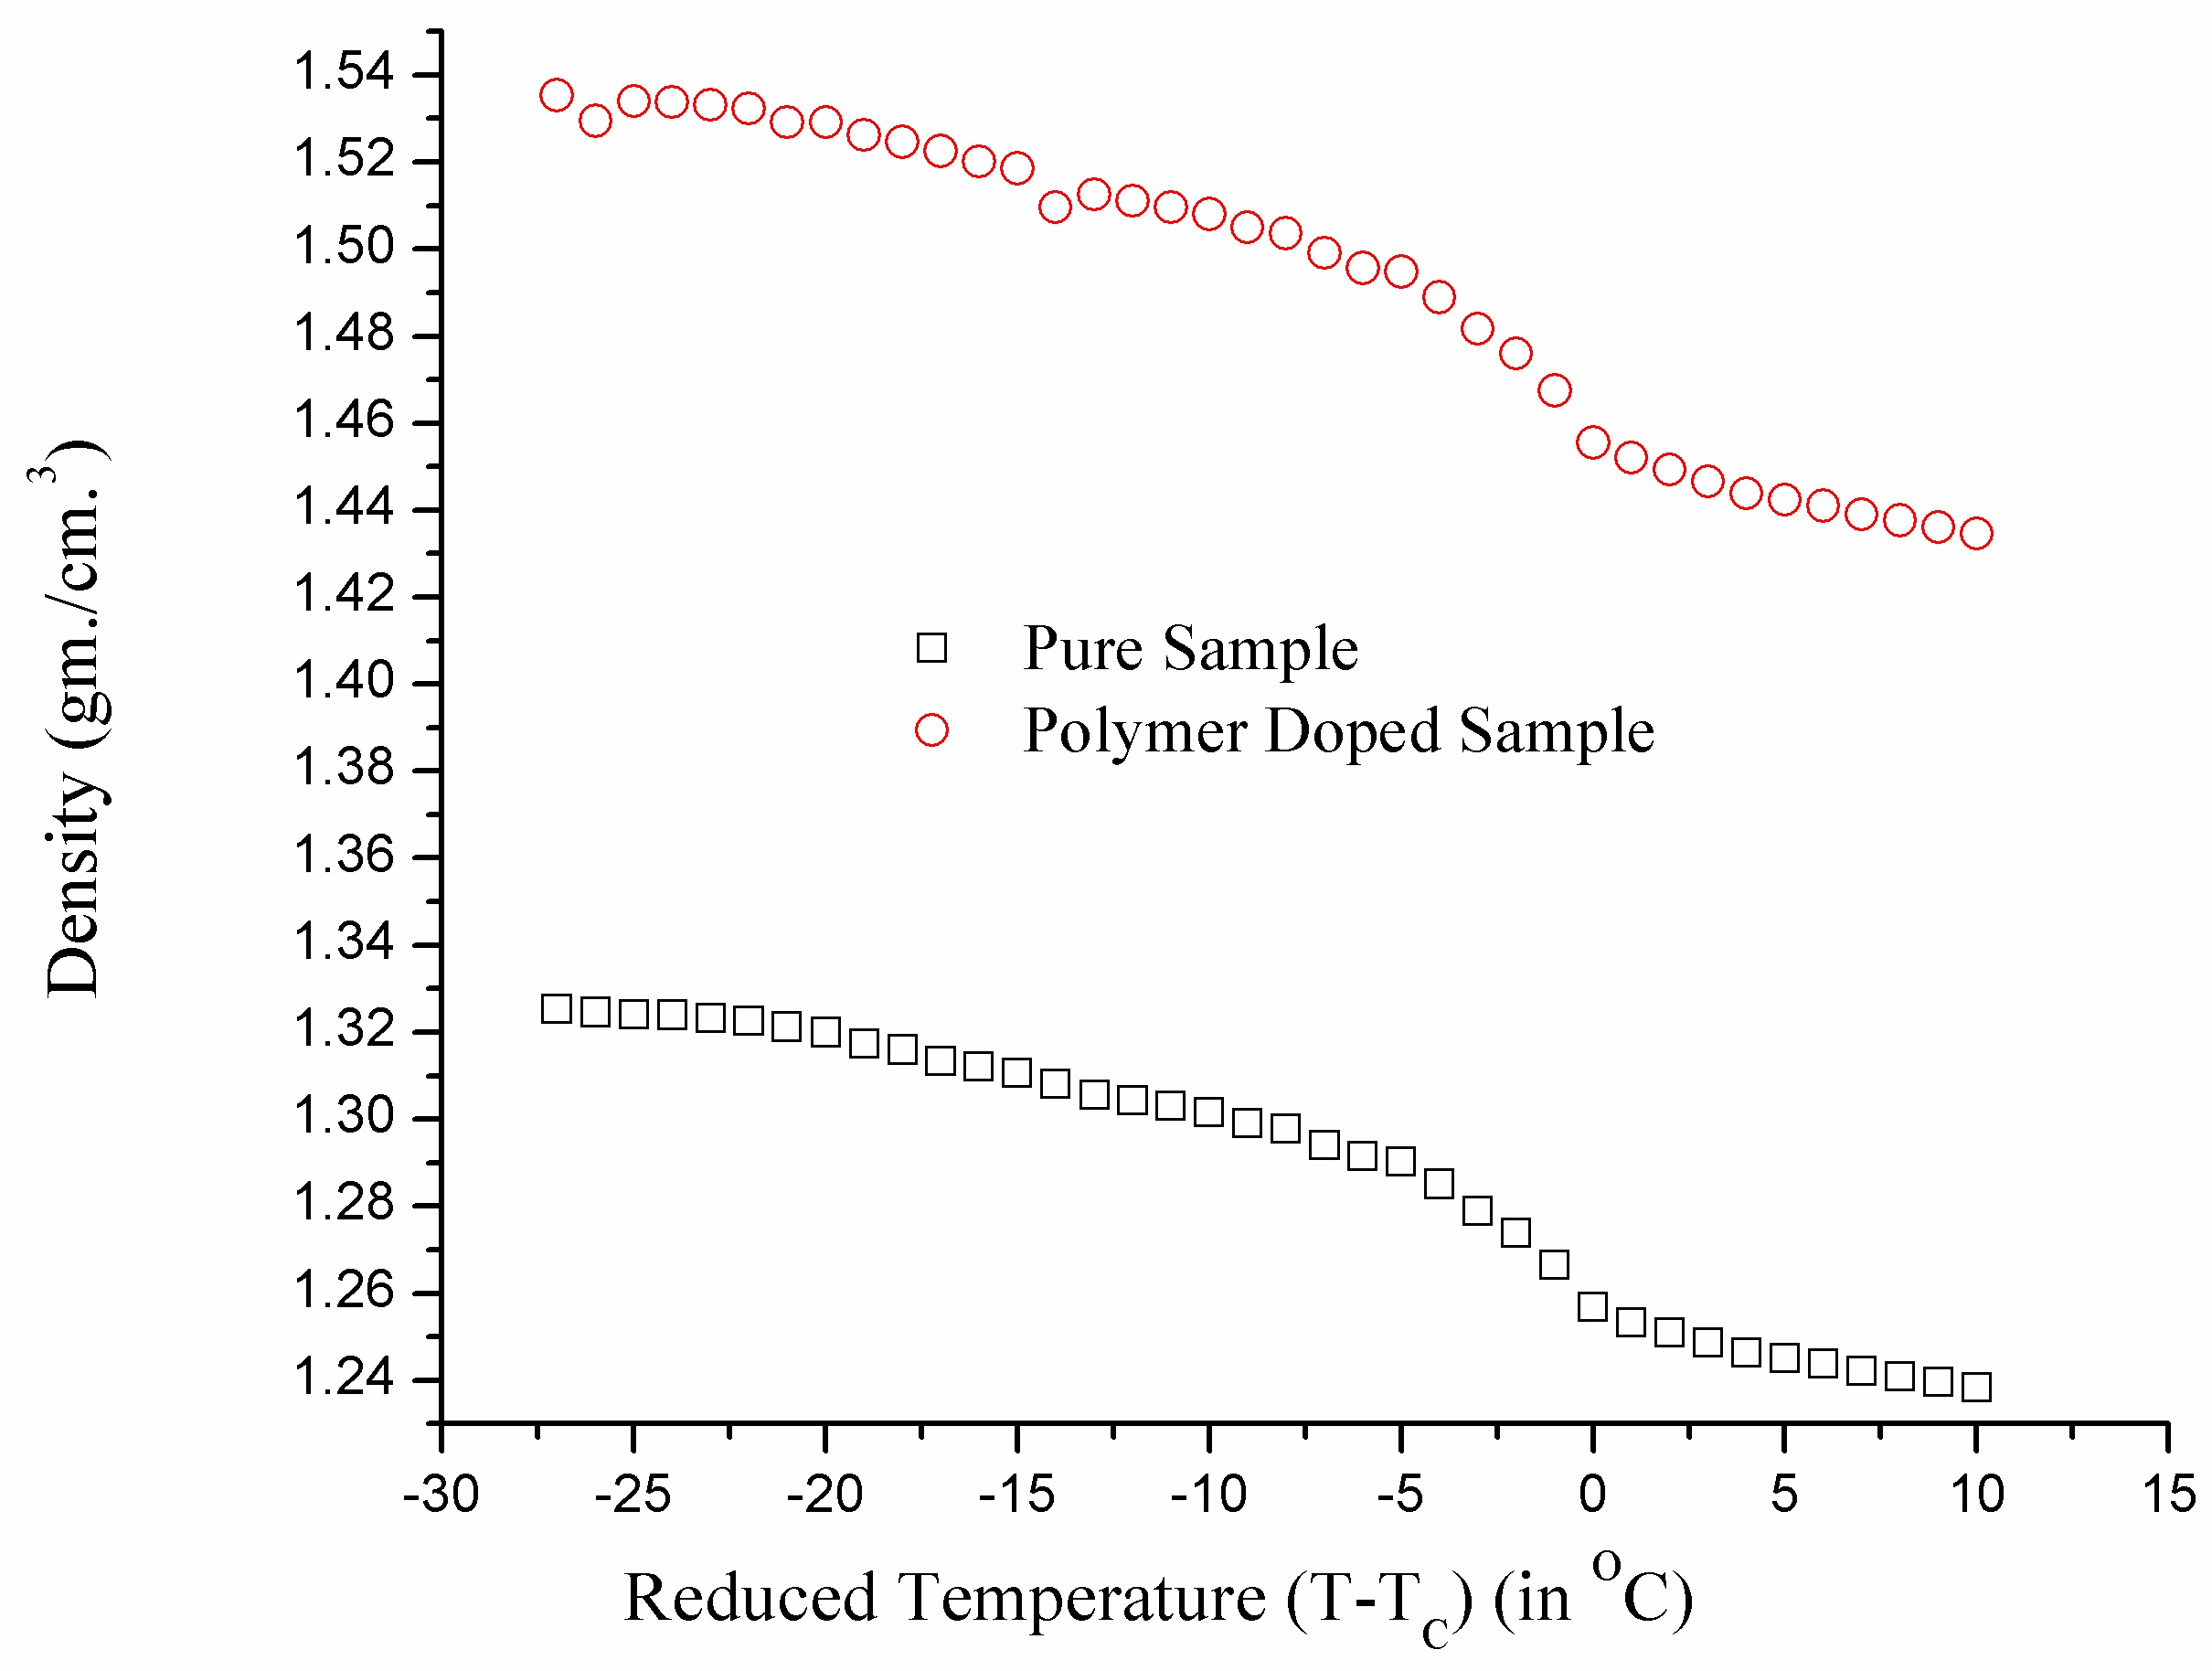
The density of the sample (Fig. 5) decreases almost linearly with increasing temperature, like the pure nematic samples [17,27]. The phase transition is indicated by a simple discontinuity, suggesting a first order phase transition [28]. The slightly broad breadth of transition is due to the different components of the mixture, as mentioned above. The density of the composite system has been found to increase by a large amount, as expected for the dopant of high density. However the phase transition temperatures for the nematogen, as obtained by different techniques i.e. density measurement technique and optical impedance measurement technique, are in good agreement.
It may therefore be concluded that the nematic mixture E-24 and its polymer composite with 1%wt/wt concentration, yields a positive anisotropy, and the behaviour of the Δε with T can be explained on the basis of the Maier and Meier theory. The doping of polymer in liquid crystal increases the order of the nematic phase, and also increases the density of the system. This increase in both the parameters is advantageous for the application of this composite in the devices. However, it does not change the phase transition behavior or the optical transmittance of the sample.