In order to develop high voltage (HV) insulation materials, epoxy/spherical alumina composites with two different particle sizes (in μm) were prepared and a dynamic mechanical analysis (DMA) and electrical insulation breakdown strength test were carried out in sphere-sphere electrodes and the data were estimated using Weibull statistical analysis. Alumina content varied from 50 to 70 wt%. The electrical insulation breakdown strength for epoxy/alumina (50 wt%) was 44.0 kV/1 mm and this value decreased with increasing alumina content. The effects of insulation thickness and alumina particle size on the insulation breakdown strength were also studied. The insulation thickness varied from 1 mm to 3 mm, and the particle sizes were 7.3 or 40.3 μm.
Epoxy resins are well-known materials in the field of insulation systems for heavy electric equipment such as mold-type transformers, current transformers (CT), potential transformers (PT), metering out-fit (MOF), gas switching gears [1-3], and so on, because they have good mechanical and thermal properties as well as excellent electrical properties. To improve the insulation properties, various kinds of inorganic fillers such as silica (SiO2) [4], alumina (Al2O3) [5], mica [6], aluminum nitride (AlN) [7], titanium dioxide (TiO2) [8], etc. have been widely used for conventional polymer composites in order for their application to insulation materials.
In the last two decades, rapid development of epoxy-based composites in electric applications has been achieved to give the epoxy resins much higher electrical performance with lower cost. Epoxy-based composites have usually been used by loading micro-sized inorganic particles, typically around 65~80 wt% in order to achieve the same low level thermal expansion as that of copper or aluminum conductor, avoiding the exfoliation between the epoxy casting part and the metallic conductor. This is because many electric apparatus are operated under various heat cycles of outside environmental temperatures [9].
In this study, an epoxy/spherical alumina composite was prepared, with particle sizes of 7.3 and 40.5 μm; an electrical insulation breakdown test was then carried out and the data were estimated using Weibull statistical analysis [10].
A commercial DGEBA (diglycidyl ether of bisphenol A) type epoxy resin, YD 128 (Kukdo Chem. Co.) was used. The equivalent weight was 184~190 and the viscosity was 11,500~13,500 cps at 25℃. The curing agent was Me-THPA (3- or 4-methyl-1,2,3,6-tetrahydrophthalic anhydride), the grade name of which was HN- 2200 (Hitachi Chem. Co.). Me-THPA is widely used in the field of electric insulation. The accelerator used was BDMA (benzyldimethyl amine, Kukdo Chem. Co.). An aliphatic epoxy resin with low molecular weight was purchased from Kukdo Chem. Co. under the trade name of BDGE. Its equivalent weight was 120~140 and its viscosity was 15~30 cps at 25℃.
Spherical type aluminas with two different average particle sizes were supplied from Sibelco Korea. Their product names were SA-0109 and SA-0450R, the average particles of which were 7.3 and 40.5 μm, respectively.
An epoxy matrix was prepared by mixing DGEBA (100 g), BDGE (10 g) and THPA (92 g) with a mechanical agitator for 5 min and 50, 60, 65 or 70 wt% of spherical alumina was then wellmixed with a high-speed agitator at 5,000 rpm for 30 min. Finally, BDMA (1 g) was mixed for 5 min and was then poured into specimen molds. Specimens for the insulation breakdown test were designed to be 1, 2 or 3 mm thickness with 100 mm diameter. The specimens were then cured at 120℃ for 2 hr and continually post-cured at 150℃ for 2 hr, and were then cooled slowly at a rate of -0.5℃/min until room temperature to avoid internal stress.
2.3 AC insulation breakdown test
Sphere to sphere electrodes were arranged to have an insulation thickness of 1, 2 or 3 mm to measure the ac insulation breakdown strength. The electrodes were made of copper and their diameters were 7.40 mm. The specimens and electrodes were then dipped into insulating oil of 30℃ and high voltage (HV) was applied using an AC Endurance Voltage Tester (Haefely, Germany) at a rising speed of 1 kV/s until electrical insulation breakdown occurred. The specification of the HV generator was as follows. It was controlled at the frequency of 60 Hz with the maximum voltage of 400 kV. The secondary maximum current was 1,000 mA with a system of 400 kVA. The data of voltage, current, and frequency were automatically recorded every 5 seconds, and all the data of the insulation breakdown strength were estimated using Weibull statistical analysis.
Field emission scanning electron microscopy (FE-SEM, JMS- 6701F, JEOL) was used at an acceleration voltage of 10 kV in order to confirm the well-dispersion of spherical alumina and good interfacial morphology between the epoxy and the micro-sized alumina. The fractured surface was gold sputter-coated after the tensile test.
Dynamic mechanical analysis (DMA2980, TA Instrument Ltd.) was carried out in a shear mode at the frequency of 1.0 Hz and the heating rate of 10℃/min. The sample dimension was 12.5×7.0×3.0 mm and the air purge rate was 110 ml/min.
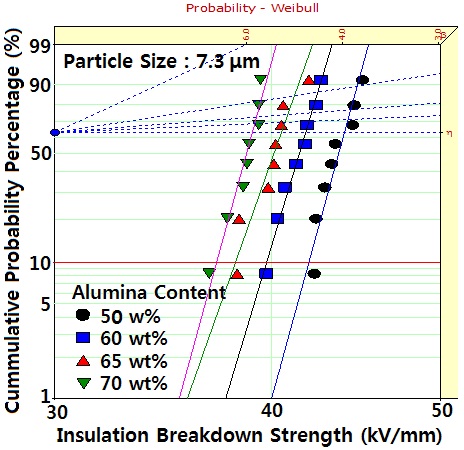
Figure 1 shows the Weibull statistical analyses for the ac insulation breakdown strength of four epoxy/spherical alumina (7.3 μm) composites with various alumina contents between 50 and 70 wt%, where insulation thickness was 1 mm. The parameters such as shape and scale, and the B10 value were obtained from the Weibull plots. Here, the shape parameter could be obtained from the slope, meaning the data distribution, and the scale parameter represented the electrical insulation breakdown strength by which 63.2% of the cumulative probability was expected to fail. The B10 value referred to the breakdown strength at which 10% would fail (90% would survive) under an applied voltage. The parameters are listed in Table 1. The statistical analysis showed that the electrical breakdown strength (i.e. scale parameter) was 44.0 kV/1 mm in epoxy/spherical alumina (50
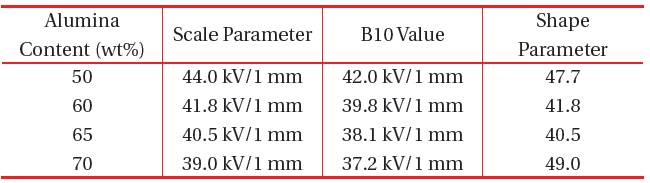
Weibull parameters for insulation breakdown strength in epoxy/alumina (7.3 μm) systems with different alumina content obtained from Fig. 1.
wt%) and it decreased with increasing alumina content. That of epoxy/spherical alumina (70 wt%) was 39.0 kV/1 mm, which was an 11.3% lower value. This meant that the dispersed micro-sized aluminas could not effectively interrupt the propagation of the electrical trace.
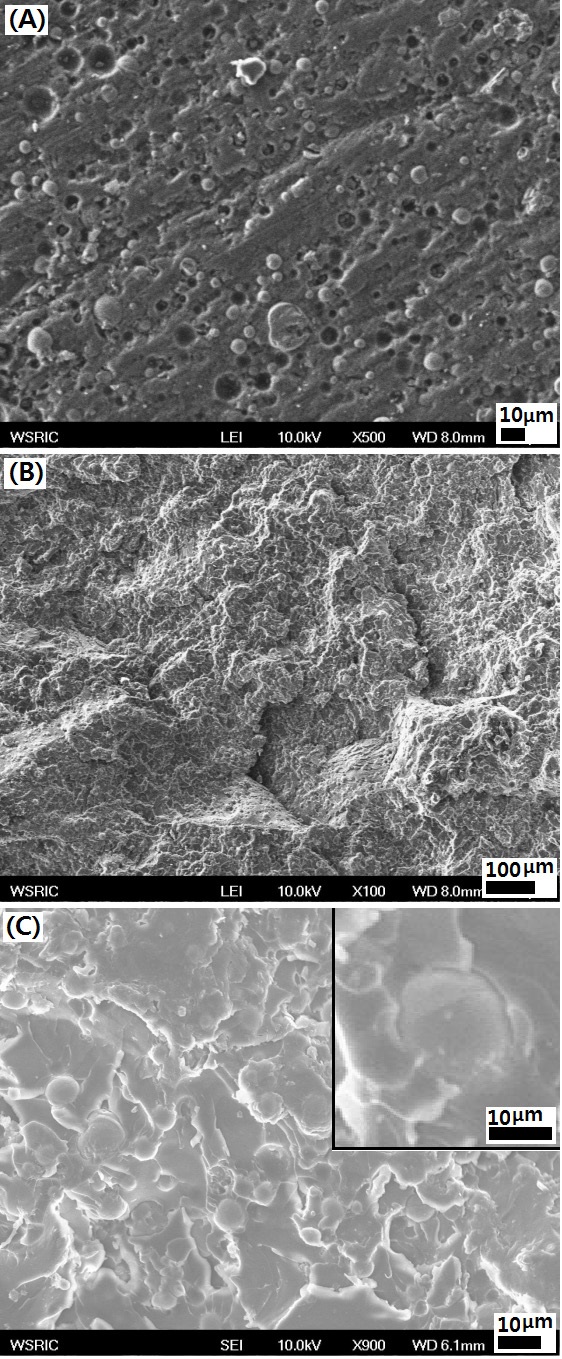
In order to check the even dispersion of alumina particles and to observe the interfacial morphology between the alumina particles and epoxy matrix, cured epoxy/spherical alumina (60 wt%) composites comprising 7.3 μm alumina were polished using an alumina abrasive and SEM observation was carried out. As shown in Fig. 2(a), spherical alumina particles were evenly dispersed without any aggregated clusters that could cause the reduction of mechanical strength. Some holes were caused by the pulling-out of the alumina particles. This meant that the interfacial strength between the epoxy matrix and alumina particles was too weak.
Microscopically, the fracture surface of the epoxy/spherical alumina composites after the tensile test is shown in Fig. 2(b) and was very complex. In the epoxy/spherical alumina composites, the internal stress was concentrated on the interface between the epoxy matrix and alumina so that the crack was easily generated from the interface. That is, the rough surface was mainly caused by the generation of new crack fronts ahead of the primary crack and the interconnection of these new cracks on the different fracture system, whereby the high internal stress generated ahead of the front of the primary crack caused new cracks and cracks propagated rapidly. SEM observation in Fig. 2(c) shows the interface gap between the epoxy matrix and spherical alumina; therefore, the micro-crack was easily initiated from the gap. Furthermore, the electrons could flow relatively easily around the interface between the spherical alumina and the epoxy matrix, creating a new electric field concentration at the opposite side of the alumina interface.
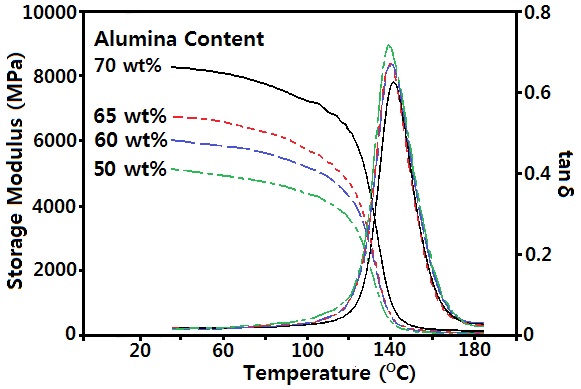
In order to study the effect of the crosslink structure of the epoxy matrix on the insulation breakdown strength, DMA analysis
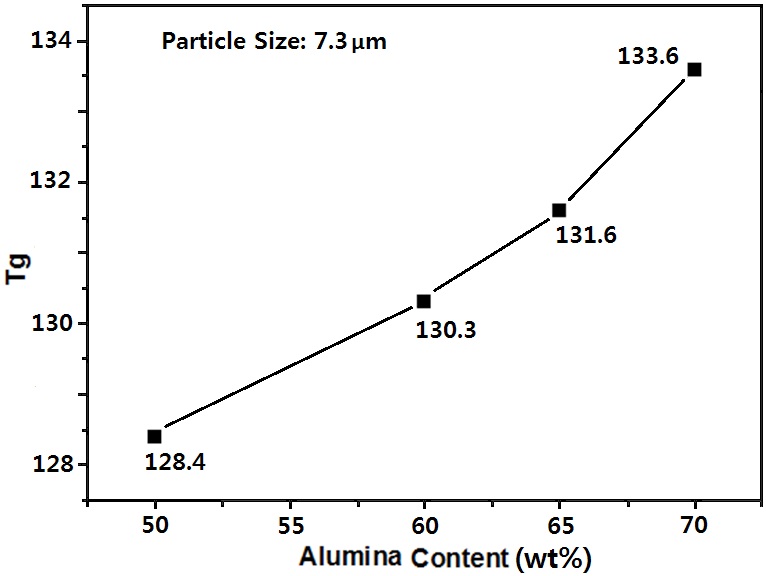
was carried out and is shown in Fig. 3. The storage modulus (G') in the epoxy/spherical alumina (50 wt%) at 40℃ (at glass state) was 5,100 MPa and increased with increasing alumina content. The value for epoxy/spherical alumina (70 wt%) was 8,259 MPa which was ca. a 62% higher value. As the atmosphere temperature increased, the decreasing rate of G' increased and a reduced temperature was shown at the higher temperature. As the atmosphere temperature increased, loss modulus (G") abruptly increased at the glass transition state which was shown in the form of tanδ = G"/G'. The glass transition temperature (Tg) was estimated from the peak temperature of tanδ and is shown in Fig. 4. The Tg value of epoxy/spherical alumina (50 wt%) was 128.4℃ and increased with increasing alumina content. The value of epoxy/ spherical alumina (70 wt%) was 133.6℃. In general, the Tg of polymers was affected by the polymer structure. In particular, Tg is directly proportional to the crosslink structure of polymer matrix. Here, the increasing Tg suggested that the density of the crosslink structure of the epoxy matrix increased. While the denser epoxy matrix should lead to higher insulation breakdown strength, here, the breakdown strength decreased with increasing crosslink density (i.e. increasing Tg). This meant that the effect of the interfacial gap between the epoxy matrix and alumina (Fig. 2(c)) on the electrical breakdown strength was considerably higher than that of the crosslink density. Therefore, the breakdown strength decreased with increasing alumina content because the interfacial gap area increased with increasing alumina content.
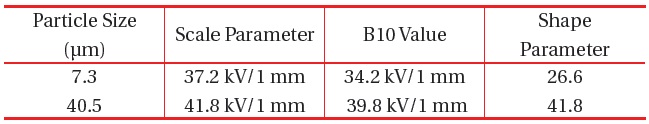
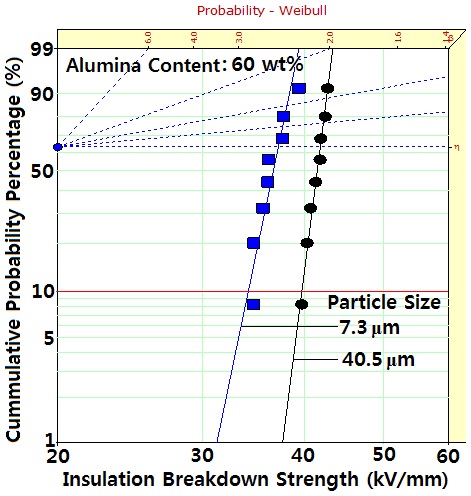
The effect of alumina particle size on the insulation breakdown strength was also studied as shown in Fig. 5. Alumina content was fixed at 60 wt%. Weibull statistical analyses shows that the ac insulation breakdown strength for epoxy/ spherical alumina (40.5 μm) was 41.8 kV/1 mm and that for the epoxy/alumina (7.3 μm) was 37.2 kV/mm, which was an 11.0% higher value. This occurred because if the particle size became smaller, the surface area increased so that the interfacial area became broader.
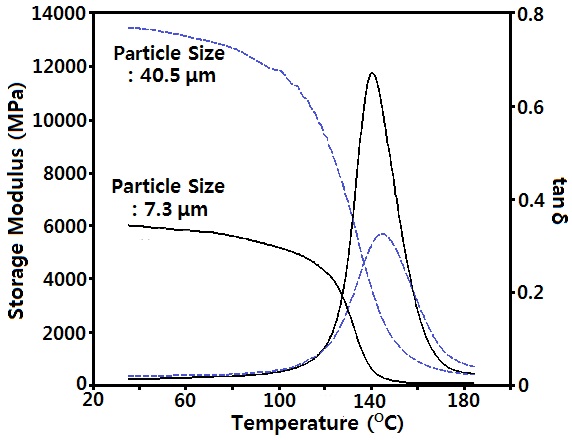
The DMA curves in Fig. 6 show that the storage modulus of the epoxy/spherical alumina (40.5 μm) system was 224% larger than that of the epoxy/spherical alumina (7.3 μm) system and Tg from tanδ peak was 4.6℃ higher in the larger particle system. This meant that the crosslink density of epoxy matrix in the epoxy/ alumina (40.5 μm) system also lead to a higher insulation breakdown strength.
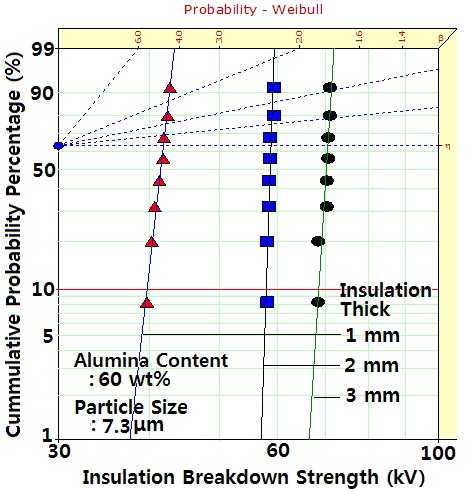
Weibull statistical analyses for ac insulation breakdown strength of epoxy/spherical alumina composites with various insulation thicknesses are compared in Fig. 7. The alumina particle size and content were fixed at 7.3 μm and 60 wt%, respectively. The shape and scale parameters and B10 value were

Weibull parameters for insulation breakdown strength in epoxy/ spherical alumina systems with different particle sizes obtained from Fig. 5.
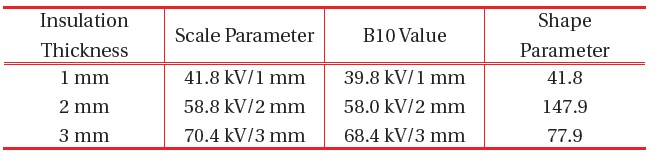
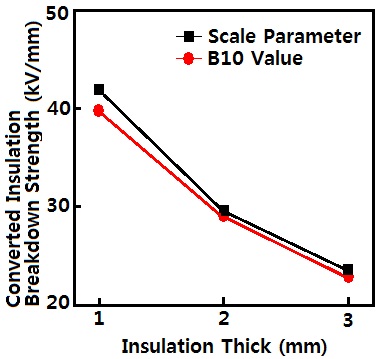
obtained from the Weibull plots and the results are listed in Table 3. While it was understandable that the breakdown strength increased with the increasing specimen thickness, it was not in direct proportion to the thickness, contrary to expectation. The statistical analysis showed that electrical breakdown strength for 3 mm thickness was 70.4 kV/mm, which was 1.7 times (not 3 times) higher than that for 1 mm thickness. In order to study the thickness effect more precisely, the scale parameter data were converted to kV/1 mm and the results are shown in Fig. 8. The converted value for 3 mm thickness was about 56% lower than that for 1 mm thickness. The thickness dependence of electrical breakdown strength is purely empirical and obtained from many electrical breakdown experiments of different dielectrics under ac, dc, and impulse conditions. While various attempts have been made to understand why such a relationship exists, the detailed mechanisms are poorly understood [11].

Weibull parameters for insulation breakdown strength in epoxy/ spherical alumina (60 wt%) systems obtained from Fig. 7.
Spherical micro-sized aluminas with two particle sizes of 7.3 μm or 40.5 μm were introduced to an epoxy matrix in order to prepare insulation materials for heavy electric equipment. The electrical property was also studied. The electrical breakdown strength for the epoxy/spherical alumina (50 wt%) was 44.0 kV/1 mm and this decreased with increasing alumina content. That of epoxy/spherical alumina (70 wt%) was 39.0 kV/1 mm, which was an 11.3% lower value. This meant that the dispersed microsized aluminas could not effectively interrupt the propagation of the electrical trace. Electrical breakdown strength for epoxy/ spherical alumina (60 wt%) with 40.5 μm particle size was 41.8 kV/1mm and that for 7.3 μm alumina was 37.2 kV/mm, which was an 11.0% higher value. This meant that well dispersed microsized alumina with larger particle sizes effectively interrupted the propagation of the electrical trace. The thickness dependence of the electrical breakdown strength was also observed.