While sulfur hexafluroride (SF6) has played an important role in the electric power industry, it has been designated as a greenhouse gas. Therefore, many researchers have investigated and developed new insulation systems; solid insulation systems have attracted attention because of the downsizing of their heavy electric apparatuses and because they do not use SF6 gas [1].
Epoxy/silica composites are well-known materials in the field of insulation systems for heavy electric equipment because they have good mechanical and thermal properties as well as excellent electrical properties [2-4]. Over the last two decades, many researchers have developed new epoxy-based composites considering much higher performance with lower cost in the electric applications. Generally, 65~80 wt% of micro-silica should be loaded into an epoxy matrix in order to satisfy the dimensional stability of the heavy electric equipment. However, when too much inorganic silica particle was incorporated into an epoxy resin, the viscosity was too high. Therefore, in order to decrease the viscosity for an easy molding process, spherical type silica was introduced to an epoxy matrix.
In this study, an epoxy/spherical silica composite was prepared in the weight ratio of two types of spherical silicas, of which the average particle sizes were 5 μm and 20 μm. An electrical insulation breakdown test was then carried out and the data were estimated using Weibull statistical analysis.
A commercial DGEBA (diglycidyl ether of bisphenol A) type epoxy resin, with the grade name of YD 128, was used (Kukdo Chem. Co.). Its epoxy equivalent weight was 184~190 g/eq and the viscosity was 11,500~13,500 cps at 25℃. The curing agent was Me-THPA (3- or 4-methyl-1,2,3,6-tetrahydrophthalic anhydride), with the grade name of HN-2200 (Hitachi Chem. Co.). Me-THPA is widely used in the field of electric insulation. The accelerator was BDMA (benzyl-dimethyl amine) purchased from Kukdo Chem. Co.
Spherical type silicas with four different average particle sizes were purchased from Sibelco Korea. Their product names were SS-0030 and SS-0200R, of which the average particle sizes were 5.25 and 21.92 μm, respectively. In this study, the average particle sizes were roughly expressed as 5 and 20 μm, respectively.
DGEBA (21 g) and THPA (18 g) were well-mixed with a mechanical agitator for 5 min and a spherical microsilica mixture (60 g) with various ratios of two different silicas was added. The mixture was then well-mixed with a high-speed agitator at 5,000 rpm for 30 min and finally, BDMA (1 g) was mixed for 5 min and then poured into specimen molds. The specimens for the insulation breakdown test were designed to be 1, 2 or 3 mm thickness and 100 mm diameter. The specimens were then cured at 120℃ for 2 hr and continually post-cured at 150℃ for 2 hr, then cooled slowly at a rate of -0.5℃/min until room temperature in order to avoid internal stress, which would be a weakness.
2.3 AC insulation breakdown test
Sphere to sphere electrodes were arranged to have insulation thicknesses of 1, 2 or 3 mm to measure the ac insulation breakdown strength. The electrodes were made of copper and their diameters were 7.40 mm. The specimens and electrodes were then dipped into an insulating oil of 30℃ and high voltage (HV) was applied by an AC Endurance Voltage Tester (Haefely, Germany) at a rising speed of 1 kV/s until electrical insulation breakdown occurred. The specification of the HV generator was as follows. It was controlled at the frequency of 60 Hz with the maximum voltage of 400 kV. The secondary maximum current was 1,000 mA with a system of 400 kVA. The data of the voltage, current, and frequency were automatically collected every 5 seconds, and all the data of the insulation breakdown strength were estimated by Weibull statistical analysis [5].
Field emission scanning electron microscopy (FE-SEM, JMS- 6701F, JEOL) was used at an acceleration voltage of 10 kV in order to confirm the well-dispersion of spherical microsilica and good interfacial morphology between the epoxy and the microsilica. The fractured surface after the tensile test was gold sputtercoated.
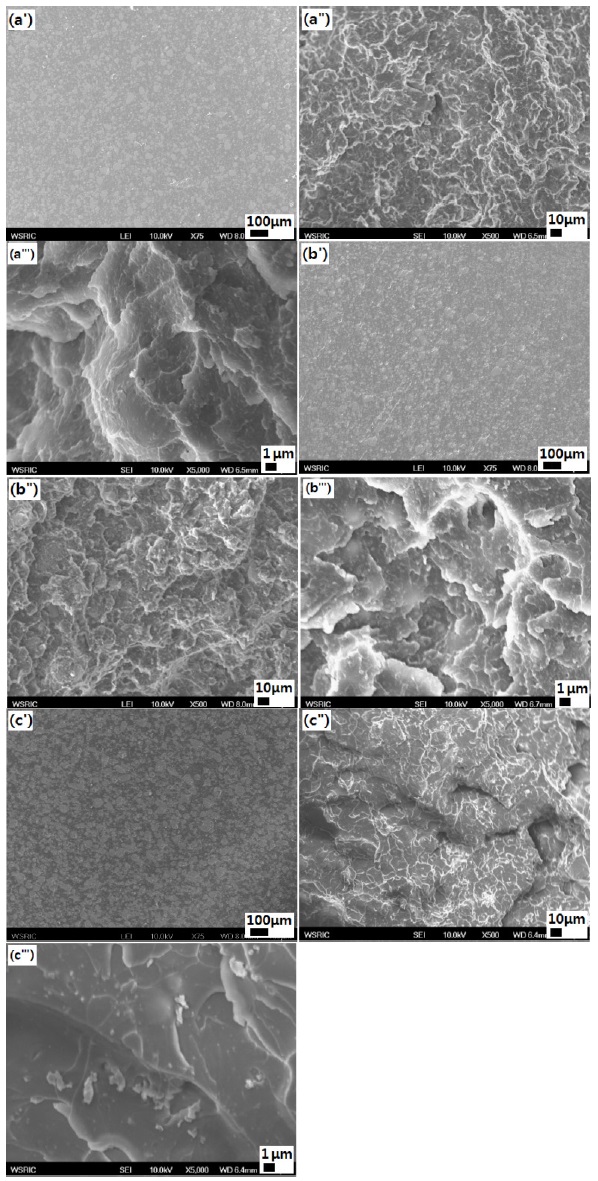
In order to check the even dispersion of silica particles, epoxy/ spherical silica composites were polished and SEM observations were carried out. As shown in Fig. 1, spherical silica particles were captured from the polished surface for the systems with various mixing ratios of 5 μm to 20 μm silicas; (a') 1 : 0, (b') 0.5 : 0.5 and (c') 0 : 1. All particles were evenly dispersed, regardless of the mixing ratio, without any aggregated clusters which caused the reduction of insulation breakdown strength and mechanical strength.
SEM images for epoxy/spherical silica (60 wt%) composites with the same mixing ratio were captured from a fractured surface after the tensile test at low magnification (a", b", and c") and triple prime ("') was captured at 10 times higher magnification. Microscopically, only the rough fracture zone was shown without the mirror zone and the fast crack zone, where the last two zones were shown in a neat epoxy system showing a typical unstable and brittle fracture [6]; in the neat epoxy, a system fracture was initiated from the mirror zone surrounded by the fast crack zone and then rough fracture zone was followed. However,
in the epoxy/spherical silica composites, internal stress was concentrated on the interface between the epoxy matrix and the silica; therefore, a crack was easily generated from the interface. As the particle size increased, the internal stress on the interface increased so that the tensile fracture occurred easily and considerably rougher fracture morphology is shown in Fig. 3 (a", b", and c"). The roughness of the surface was mainly caused by the generation of new crack fronts ahead of the primary crack and the interconnection of these new cracks on the different cracks. An observation with increased magnification showed that more fibrous surface appeared in the system with low average particle size.
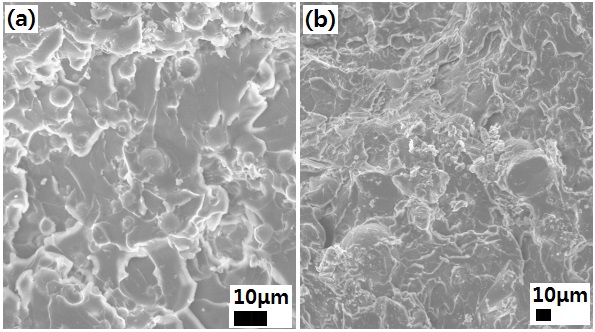
Figure 2 shows SEM images for interfacial bonding between epoxy and spherical silica: (a) 5 μm silica and (b) 20 μm silica. All the interfaces between the spherical silica and epoxy matrix had a small gap in the 5 μm and 20 μm systems and the surface of the
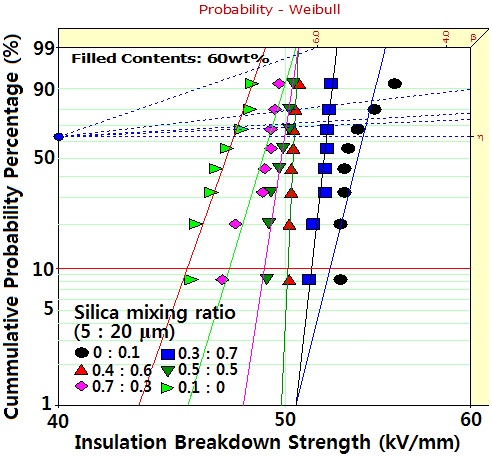
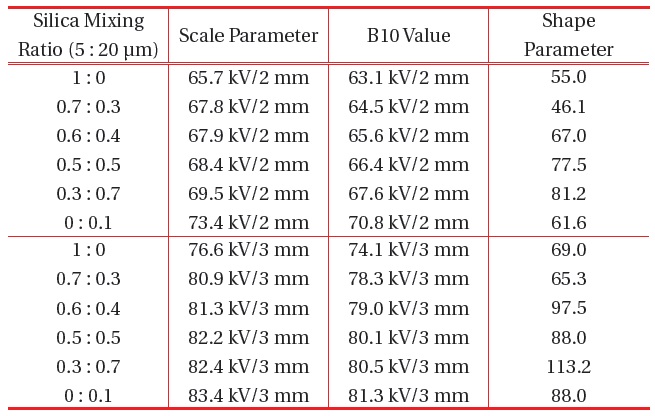
Weibull parameters for insulation breakdown strength in epoxy/ spherical silica (60 wt%) systems obtained from Fig. 3.
silicas showed no epoxy fracture. However, the gap in the smaller system was lower than that of the higher system.
Therefore, as the spherical silica size increased, the interface gap increased so that micro-crack was easily initiated from the gap.
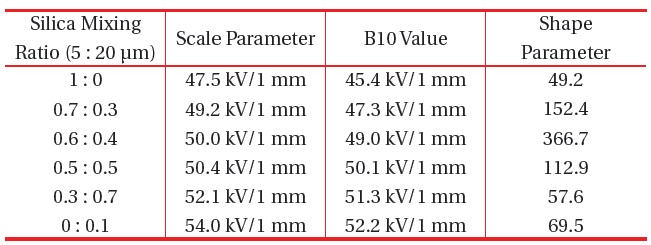
Weibull statistical analyses for ac insulation breakdown strength in epoxy/spherical silica (60 wt%) systems with different mixing ratios of 5 μm to 20 μm silicas are compared in Fig. 3. The insulation thickness was 1 mm. The shape and scale parameters and B10 value were obtained from the Weibull plots and listed in Table 1. Here, the shape parameter could be obtained from the slope that refers to the data distribution, and the scale parameter represents the insulation breakdown strength, of which 63.2% of the cumulative probability was expected to fail. The B10 value referred to the insulation breakdown strength at which 10% would fail (90% would survive) under the applied voltage. The statistical analysis showed that electrical breakdown strength was 47.5 kV/1 mm in the epoxy/spherical silica (5 μm) and this increased with an increasing mixing ratio of 20 μm silica. The electrical breakdown strength of epoxy/spherical silica (20 μm) was 54.0 kV/1 mm, which was 114% higher value. This meant that well

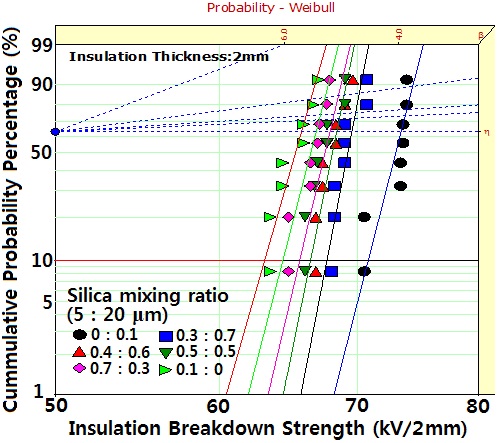
Weibull parameters for insulation breakdown strength in epoxy/ spherical silica (60 wt%) systems obtained from Fig. 5.
dispersed microsilicas with larger particle size effectively interrupted the propagation of the electrical trace; however, the barrier effect decreased in the smaller.
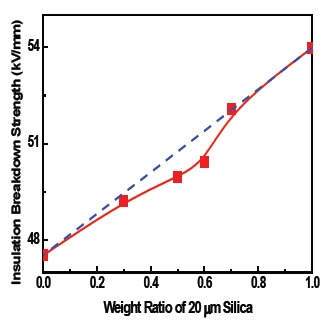
The silica mixing effect on the scale parameters was estimated by a rule-of-mixtures [7], as shown in Fig. 4, where the dashed line refers to the rule-of-mixtures. As the mixing ratio of 20 μm silica increased, the electrical breakdown strength increased; however, the values were lower than those of the dashed line because they were dependent on the much weaker 5 μm silica. That is, the electrons could relatively easily flow around the interface between the spherical microsilica and the epoxy matrix in the
smaller particles and they made a new electric field concentration at the opposite-side of the microsilica interface.
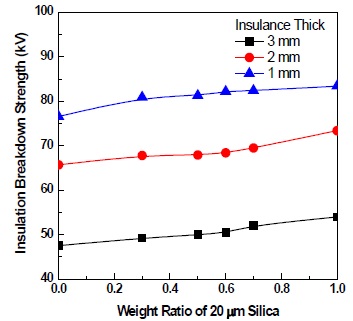
Figure 5 shows the Weibull analysis for insulation breakdown strength in the epoxy/spherical silica (60 wt%) systems with 2 and 3 mm insulation thickness. The shape and scale parameters and B10 values are listed in Table 2. The breakdown strength increased with the increasing specimen thickness; however, this increase was not in direct proportion to the thickness. That is, the electrical breakdown strength for the 2 mm thick specimen in epoxy/spherical silica (5 μm) was 65.7 kV/2 mm, which was 138% (not 200%) higher than that of 1 mm thick. The value for 3 mm thick in the epoxy/spherical silica (5 μm) was 76.6 kV/3 mm, which was 161% (not 300%) higher than that of 1 mm thick. In order to estimate the effect of thickness, the scale parameter data were converted in kV/1 mm and the result is shown in Figure 6. The converted value for 3 mm thickness was about 60% lower than that for 1 mm thickness. The thickness dependence of electrical breakdown strength is purely empirical and obtained from many electrical breakdown experiments of different dielectrics under AC, DC, and impulse conditions. While various attempts have been made to understand why such a relationship exists, the detailed mechanisms are poorly understood [8].
Spherical microsilicas with various mixing ratios of 5 μm and 20 μm were introduced to an epoxy matrix in order to prepare insulation materials for heavy electric equipment. Electrical properties were studied in a sphere to sphere electrodes system. SEM observation showed that only the rough fracture zone was shown without the mirror zone and fast crack zone, where the last two zones were shown in a neat epoxy system. It also showed that the interfaces between the spherical silica and the epoxy matrix had a small gap in the 5 μm and 20 μm systems. The statistical analysis for electrical insulation breakdown strength showed that the electrical breakdown strength was 47.5 kV/1 mm in epoxy/ spherical silica (5 μm) and increased with increasing mixing ratio of 20 μm silica, and that of epoxy/spherical silica (20 μm) was 54.0 kV/1 mm, which was 114% higher. The breakdown strength increased with the increasing specimen thickness; however, this increase was not in direct proportion to the thickness. The value for the 2 mm thick specimen in epoxy/spherical silica (5 μm) was 65.7 kV/2 mm, which was 138% (not 200%) higher than that of 1 mm thick. The value for the 3 mm thick specimen in epoxy/ spherical silica (5 μm) was 76.6 kV/3 mm, which was 161% (not 300%) higher than that of 1 mm thick. That is, the thickness dependence of electrical breakdown strength was also observed.