In many electrical applications insulation materials play a key role in equipment functionality. Therefore knowledge about the insulation materials helps in the planning of investigations of power systems material developers can choose the best possible option for each application, it is possible to optimize the insulation properties of such materials further [1].
Epoxy/silica composites are well-known materials in the field of insulation systems for heavy electric equipment, because they have good mechanical and thermal properties as well as excellent electrical properties [2-4]. In the last two decades, many researchers have developed new epoxy-based composites for much higher performance with lower cost for electric applications. Generally, 65~80 wt% micro-silica should be loaded into epoxy matrix in order to provide dimensional stability for heavy electric equipment. However, when too many inorganic silica particles are incorporated into an epoxy resin, the viscosity becames too high. This makes it very difficult to inject the viscous mixtures into molds during curing processes or to remove bubbles from epoxy/silica mixtures. Therefore in order to decrease the viscosity, plasticizers have been introduced to the epoxy/silica composites during the molding process,which allows bubbles to be removed easily after injection into molds. However, plasticizers can act as impurities, and negatively affect the electrical, mechanical and thermal properties of the epoxy composite. To solve these problems, spherical- type silica was introduced .
In this study, an epoxy/spherical silica composite was prepared, and the particle sizes were varied from 5 to 30 μm. Then, tensile, flexural, and electrical insulation breakdown testS were carried out, and the data were estimated by Weibull statistical analysis.
YD 128 was used, which is a commercial DGEBA (diglycidyl ether of bisphenol A) type epoxy resin(Kukdo Chem. Co.). The equivalent weight was 184~190 and the viscosity was 11,500~13,500 cps at 25℃. The curing agent was HN-2200 Me- THPA (3- or 4-methyl-1,2,3,6-tetrahydrophthalic anhydride, Hitachi Chem. Co.). This curing agent is widely used in the field of electric insulation. The accelerator was BDMA (benzyl-dimethylamine, Kukdo Chem. Co.).
Spherical-type silicas with four different average particle sizes were purchased from Sibelco Korea. Their product names were SS-0030, SS-0090, SS-0200R and SS-0300, which had average particles of 5.25, 9.85, 21.92 and 27.4 μm, respectively. In this study, the average particle sizes were roughly expressed as 5, 10, 20 and 30 μm, respectively.
DGEBA (21 g) and THPA (18 g) were thoroughly mixed with a mechanical agitator for 5 min and then spherical microsilica (60 g) with various average particle sizes was added and thoroughly mixed with a high-speed agitator at 5,000 rpm for 30 min. Finally, BDMA (1 g) was mixed for 5 min and the mixture was poured into specimen molds. Specimens for insulation breakdown test were designed to have thicknesses of 1, 2 or 3 mm with 100-mm diameter. Specimens for tensile test were prepared under the according to the JIS B7502 standard, and those for flexural tests were prepared according to the JIS B7507 standard, with a size of 70×10×4 mm. Then, the specimens were cured at 120℃ for 2 hr and continually postcured at 150℃ for 2 hr, and then cooled slowly at a rate of -0.5℃/min to room temperature to prevent internal stress.
2.3 Mechanical and AC insulation breakdown tests
Tensile and flexural tests were carried out using a universal testing machine (SHM-C-500, Shamhan Tech, Korea). The tensile tests were carried out according to the JIS B7502 standard at a crosshead speed of 10 mm/min, 23℃, and 50% relative humidity and the flexural tests were done by the three- point bending method according to the JIS B7507 standard with a span length of 50 mm and crosshead speed of 10 mm/min at the same temperature and humidity conditions.
Sphere to-sphere electrodes were prepared with insulation thicknesses of 1, 2 or 3 mm to measure the AC insulation breakdown strength. The electrodes were made of copper and their diameters were 7.40 mm. Then, the specimen and electrodes were dipped into insulating oil at 30℃ and HV was applied using an AC Endurance Voltage Tester (Haefely, Germany) at a rising speed of 1 kV/s until the electrical breakdown occurred. The HV generator was controlled at a frequency of 60 Hz,and had a maximum voltage of 400 kV. The secondary maximum current was 1,000 mA with a system of 400 kVA. The voltage, current and frequency data were collected every 5 seconds.
All the data were estimated by Weibull statistical analysis [5].
Field emission scanning electron microscopy (FE-SEM, JMS- 6701F, JEOL) was used at an acceleration voltage of 10 kV in order to confirm the thorough dispersion of the spherical microsilica and the good interfacial morphology between it and the epoxy. After the tensile test, the fractured surface was sputter-coated with gold .
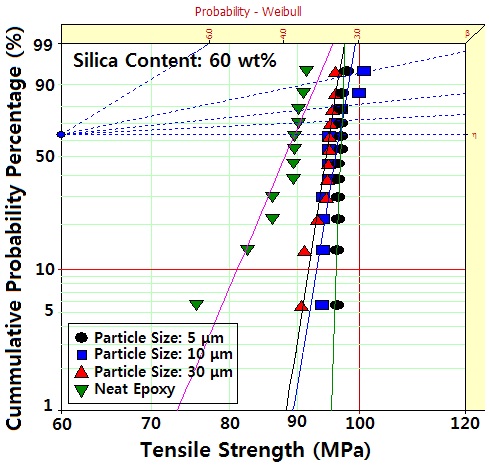
Figure 1 shows the Weibull statistical analyses for the tensile strength of neat epoxy and the epoxy/spherical silica composites, and parameters such as the shape and scale parameters and the B10 value were obtained from the Weibull plots. The shape parameter could be obtained from the slope,which represents
the data distribution, and the scale parameter represented the tensile strength by which 63.2% of the cumulative probability was expected to fail. The B10 value refers to the tensile strength at which 10% would fail (90% would survive) under a given stress. The statistical analysis showed that the scale parameter of the neat epoxy was 89.5 MPa with a shape parameter of 22.9, and that of the epoxy/spherical silica composite with 5-μm particles was 97.0 MPa, with a shape parameter of 269.0. The B10 value for neat epoxy was 81.2 MPa and that for epoxy/spherical silica composite with 5-μm particles was 96.2 MPa which was a 118% higher value. All the scale parameters and B10 values for the epoxy/spherical silica composites were higher than those for the neat epoxy regardless of the average particle size, and as expected, the tensile strength decreased with increasing particle size.
When microsilica was added to epoxy matrix, the silica could anchor the epoxy chains by hydrogen bonding between silanol groups on the silica surface and hydroxyl groups in the epoxy matrix so that the mobility of the epoxy chains became disturbed, and the tensile strength increased. As the particle size decreased, the surface area increased so that the hydrogen bonding density increased and therefore,the mechanical strength increased with decreasing particle size. As the particle size increased, the internal stress on the interface increased, so that the tensile fracture occurred easily.
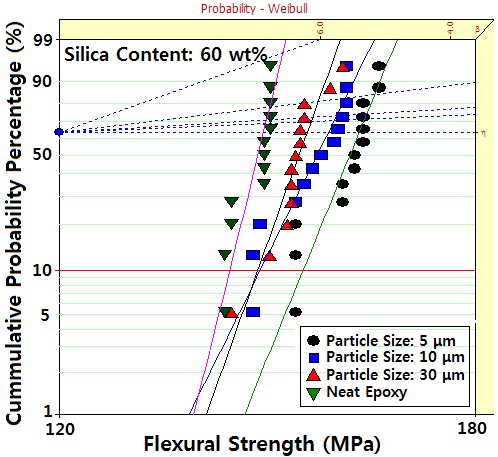
The same tendency was observed in the flexural strength as shown in Fig. 2 and the Weibull parameters obtained from Fig. 2 are listed in Table 1. The scale parameter for neat epoxy was 146.5 MPa and the largest scale parameter for epoxy/ spherical
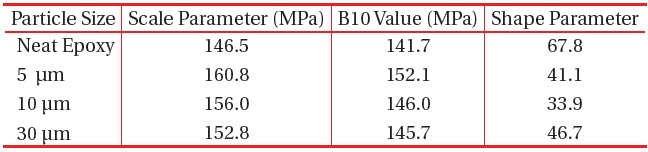
Weibull parameters for flexural strength of epoxy/spherical silica (60 wt%) obtained from Fig. 2.
silica composite with 5-μm particles was 160.8 MPa, which was a 110% higher value.
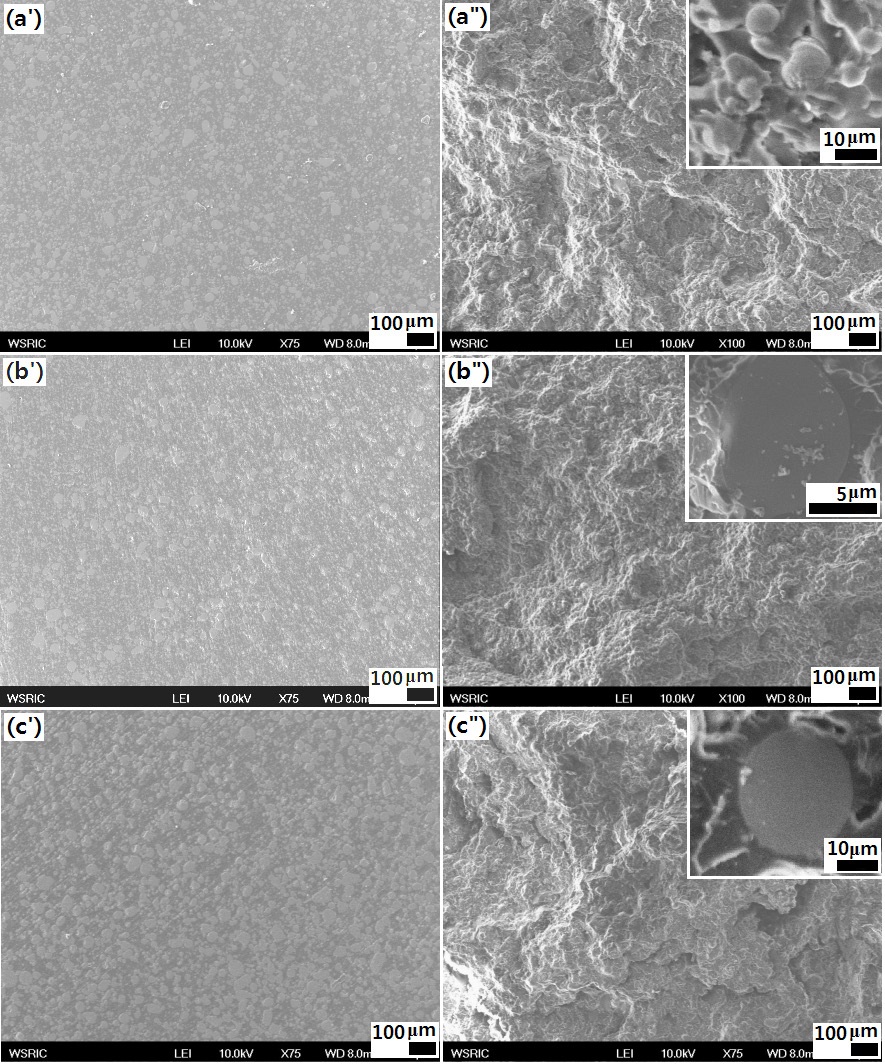
In order to check for even dispersion of the silica particles, the epoxy/spherical silica composites were polished and SEM observation was carried out. As shown in Figure 3, spherical silica particles with different sizes of (a') 5 μm, (b') 10 μm, and (c') 30 μm were evenly dispersed, regardless of the particle size, without any aggregated clusters which reduce the mechanical strength.
Microscopic images of, the fracture surface of the epoxy/ spherical silica composites after tensile tests are shown in Figs. 3(a"), (b"), and (c") with different sizes of (a') 5 μm, (b') 10 μm, and (c') 30 μm, respectively. In the neat epoxy system, fracture was initiated from the mirror zone surrounded by a fast crack zone,which led to a rough fracture zone. A typical unstable and brittle fracture was shown [6]. The roughness of the surface was mainly caused by the generation of new crack fronts ahead of the primary crack and the interconnection of these new cracks on the different fracture system, the high internal stress generated ahead of the front of the primary crack caused new cracks and cracks propagated rapidly.
In the epoxy/spherical silica composites, the internal stress
was concentrated at the interface between the epoxy matrix and the silica,which led to easy generation of cracks in these areas. As the particle size increased, the internal stress at the interface increased so that the tensile fracture took place easily, which was confirmed by SEM observation as shown in Figs. 3(a"), (b") and (c"). The interface gap grew with the size of the spherical silica. Therefore, micro-cracks were easily initiated from the gap .
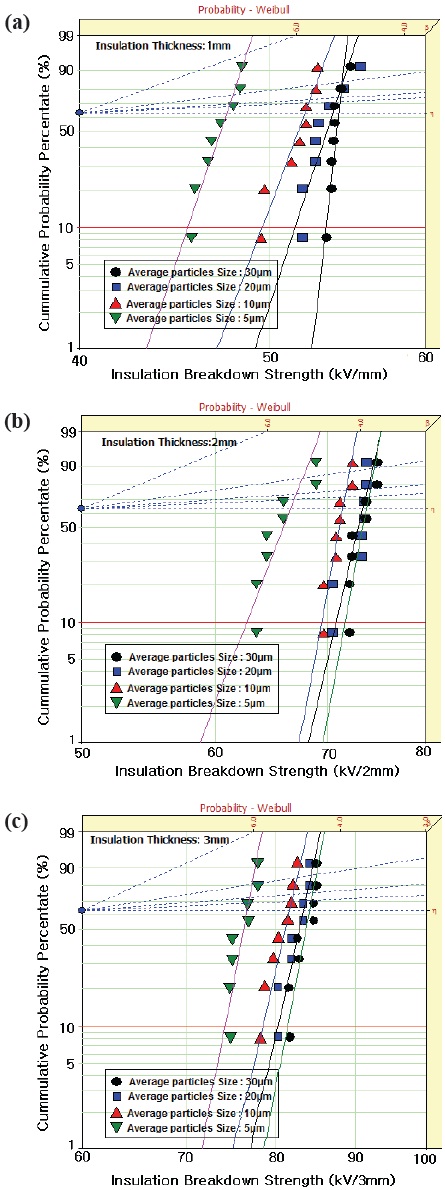
Weibull statistical analyses for AC insulation breakdown strength of the four epoxy/spherical silica composites with various insulation thicknesses were compared in Fig. 4. The shape and scale parameters and the B10 value were obtained from the Weibull plots and are listed in Table 2. The statistical analysis showed that the electrical breakdown strength was 47.5 kV/1 mm in epoxy/spherical silica (5 μm),which increased with increasing particle size. That of epoxy/spherical silica (30 μm) was 54.2 kV/1 mm, which was a 114% higher value. This meant that the well dispersed microsilicas with larger particle size effectively interrupted the propagation of the electrical trace. However, the barrier effect decreased with the smaller particles. Electrons could
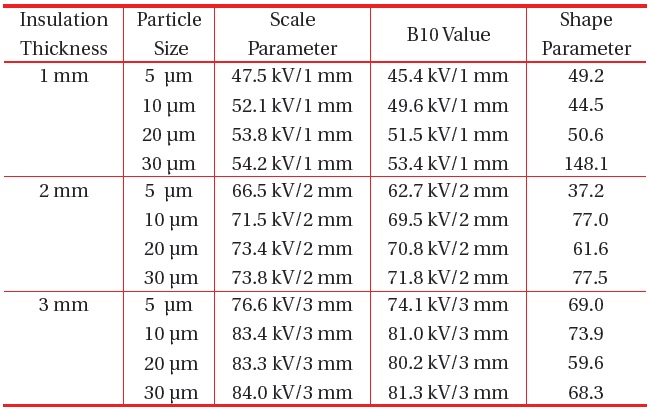
Weibull parameters for insulation breakdown strength for epoxy/spherical silica (60 wt%) with different insulation thickness at 30℃ obtained from Fig. 4.
flow relatively easily around the interface betweenThe spherical microsilica and the epoxy matrix in the smaller systems and they resulted in new electric field concentrations at the opposite- side of the microsilica interface.
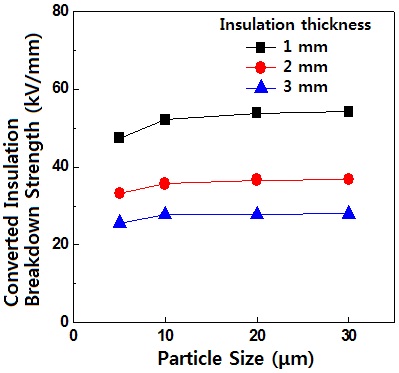
Understandably, the breakdown strength increased with the increasing specimen thickness,but it was not in direct proportion to the thickness, contrary to expectation. In order to study the effect of thickness, the scale parameter data were converted to kV/1 mm and results are displayed in Fig. 5. The converted value for 3 mm thickness was about 52% lower than that for 1 mm thickness, regardless of particle size. The thickness dependence of the electrical breakdown strength is purely empirical and obtained from many electrical breakdown experiments with different dielectrics under AC, DC, and impulse conditions, and various attempts have been made to understand why such a relationship exists. However the detailed mechanisms are poorly understood [7].
Spherical microsilicas with various particle sizes ranging from 5 μm to 30 μm were introduced to an epoxy matrix in order to prepare insulation materials for heavy electric equipment, and the mechanical and electrical properties were studied. The tensile strength and flexural strength increased with decreasing particle size. The tensile strength for neat epoxy was 81.2 MPa and that for the epoxy/spherical silica composite with 5-μm particles was 96.2 MPa which was a 118% higher value. The flexural strength for the former was 146.5 MPa and the largest scale parameter for the latter was 160.8 MPa, which was a 110% higher value. The statistical analysis for electrical insulation breakdown strength showed that the electrical breakdown strength was 47.5
kV/1 mm in epoxy/spherical silica (5 μm),which increased with increasing particle size. That of epoxy/spherical silica (30 μm) was 54.2 kV/1 mm, which was a 114% higher value. This meant that the well-dispersed microsilicas with larger particle size effectively interrupted the propagation of the electrical trace, but the barrier effect decreased in the smaller ones. The thickness dependence of electrical breakdown strength was also observed.