Dense urbanization and rapid industrialization degrades physical habitat and chemical conditions of streams and rivers regionally (Ricciardi and Rasmussen 1999) and also globally (Baer and Pringle 2000). The urbanization altered stream biotas in numerous ways such as local extinction of anadromous fishes (Limburg and Schmidt 1990), increased dominance by pollution-tolerant fishes, and frequent algal blooms (Olguin et al. 2000). Also such phenomenon reduced the species diversity of aquatic biotas such as phytoplankton, zooplankton, macroinvertebrate, and fish and in worst case, some biotas were eradicate from the aquatic ecosystems, resulting in decreased ecological health in the overall downstream/ river watersheds (Karr et al. 1985a, 1985b, Morley and Karr 2002).
Recent numerous studies of stream ecosystem health assessments (Plafkin et al. 1989, Karr et al. 1986, An and Kim 2005, Lee and An 2007) pointed out that water pol-lutions of aquatic ecosystems were widely spread out in various regions or over the many countries including Korea. For this reason, stream management strategies or effective diagnostic approaches of its health condition were highly applied to various monitoring programs, usually conducted by the province, state, or government. Conventional water quality monitoring programs, however, were usually focused on the influences originated from chemical pollutions such as nitrogen, phosphorus, or hazard toxicant pollutants. Therefore, the monitoring could not detect the biological and physical (habitat) functional modifications on the living biota and habitats in the streams and rivers.
To solve such conventional problems in the monitoring, multimetric biological integrity modeling approach was widely applied to various lotic waterbodies and later it became a key monitoring tool reflecting living biota status and its habitat condition in stream environments. The first biotic integrity concept was originated from the index of biological integrity (IBI) of fish assemblages (Karr 1981, Karr et al. 1986). As numerous researches (Karr et al. 1986, Plafkin et al. 1989, Ganasan and Hughes, 1998) pointed out, fish as an indicator of aquatic biota, is a useful bioindicator for measuring the influences of agricultural, municipal and industrial effluents in aquatic environments.
One of the important features in the multi-metric modeling approach, fishes shows cumulative effects of multiple types of anthropogenic disturbances from the watershed and in-stream structures and integrates the effects of complex and varied stressors in the ecosystem. Previous studies pointed out that the multi-ecometric approach measures the final response of biological degradation and also synthesizes the cumulative effects of a wide variety of environmental disturbances (Keeler and McLemore 1996). The accuracy of these biological assessments depends primarily on the sensitivity of these tools to natural environmental variation as opposed to human induced disturbances of river biota (Pont et al. 2006). The multimetric approach was widely applied to United States and European Union (EU) to assess ecological health of lotic ecosystems, and spread out all over the world including Asia (An et al. 2001).
In this study, multimetric eco-modeling approach was applied to various lotic ecosystems within four major watersheds an evaluated ecological health conditions. These model values were compared with individual metric model values of trophic and tolerance guilds and physical habitat health of Qualitative Habitat Evaluation Index (QHEI). Also, major chemicals influencing the ecological health conditions were discussed in relation to the degradations of habitat health and biological health conditions.
>
Study regions and sampling methods
This study was conducted in four large watersheds of Geum-River (GR), Mangkyeong River (MR), Dongjin River (DR) and Sapgyo Stream (SS) watersheds in 2008, respectively. All the watersheds are located in the mid-west temperate region of South Korea. From the four major watersheds, we selected 100 sites for ecological data sampling including habitat, fish, and chemical measurements in the watershed. It was consisted in 66 sites of GR watershed (G001 - G066) including 14 sites of mainstream and 52 sites of tributaries, 11 sites of MR watershed (G067 - G077), 6 sites of DR watershed (G078 - G083), 7 sites of SS watershed (G084 - G090) and 10 sites (G091 - G100) of other small watersheds. All sampling was operated by the modified wading method to adapt the Korean aquatic ecosystem based on the Ohio EPA method (1989). Also, we selected and sampled in 39 reference streams along with determination of the stream order based on the approach of Strahler (1957) concept using 1:120,000 scaled map.
All habitat types such as riffle, run, and pool in the same site were included for the fish sampling, and directed in an upstream to downstream reach for at least 200 m distance during 50 minutes for the catch per unit efforts (CPUE). Kick-net (4 × 4 mm) and casting-net (7 × 7 mm), the most popular fish sampling gears in Korea, were applied to sample. All fishes were identified at the direct sampling place and released immediately. However, some ambiguous specimens hardly to identify were preserved in 10% formalin solution and then, move to the laboratory for further research. All sampled fishes were examined external characteristics such as deformities (D), erosion (E), lesion (L), and tumors (T) of anomalies (DELT) based on the concept of Sanders et al. (1999). Tolerance and trophic guild analyses were based on the previous regional studies (An et al. 2004).
>
Chemical water quality analysis
Water quality data were obtained from the Water Information System (WIS) of the Ministry of Environment, Korea (MEK) during 2004 - 2008 for chemical analysis. 8 parameter such as water temperature (℃), pH, dissolved oxygen (DO), biological oxygen demand (BOD), chemical treatoxygen demand (COD), suspended solids (SS), total phosphorus (TP), and total nitrogen (TN) were examined for the analyses.
Qualitative Habitat Evaluation Index (QHEI), originally proposed by Plafkin et al. (1989) was applied for the evaluation of physical habitat health condition. We modified it as eleven metrics model, based on the previous references widely used (Barbour et al. 1999) for the regional application. For the habitat assessments, the primary, secondary, and tertiary components were included to the model and their metrics were composed of substrate structure and vegetation coverage, channel characteristics, bank characteristics and bank structure. All metric characteristics were previously described in An et al. (2006). The habitat condition were judged by the summation of each metric score and were categorized in 4 level as excellent (A, 182 - 220), good (B, 124 - 168), fair (C, 66 - 110), and poor (D, 8 - 52) conditions (MEK, 2006).
>
Analysis of multiple-ecometric model
For the study, eight metric model of the Index of Biological Integrity (IBI) was applied, instead of original 12 metric model originally suggested by Karr (1981). The model was modified by the regional application of the Geum River Watershed (An et al. 2002). The metrics (M) consist of three major groups as ecological characteristic and species composition, trophic composition, and fish abundance and health condition. Each metric was scored in 1, 3, or 5 point after the approach of US EPA (Barbour et al. 1999). Each metric and criteria characteristics were previously described in An et al. (2006). These scores were, then summed to obtain a site-specific model value that ranged from 8 to 40, and categorized with excellent (A, 36 - 40); excellent-good (A - B, 35), good (B, 28 - 34); good - fair (B - C, 25 - 27), fair (C, 18 - 24); fair - poor (C - D, 15 - 17), poor (D, 8 - 14) conditions (MEK, 2006).
SPSS (Version 12.0 KO for windows; SPSS 2004) was used for statistical analysis such as correlation analysis, regression analysis, cluster analysis, and Principal Component Analysis (PCA). In addition, PC-Ord (Ver. 4.25 for Windows; McCune and Mefford 1999) was simultaneously applied for the PCA analysis. The PCA was used to identify the primary gradients in the IBI, independent of the IBI metrics, QHEI metrics, and water quality parameters.
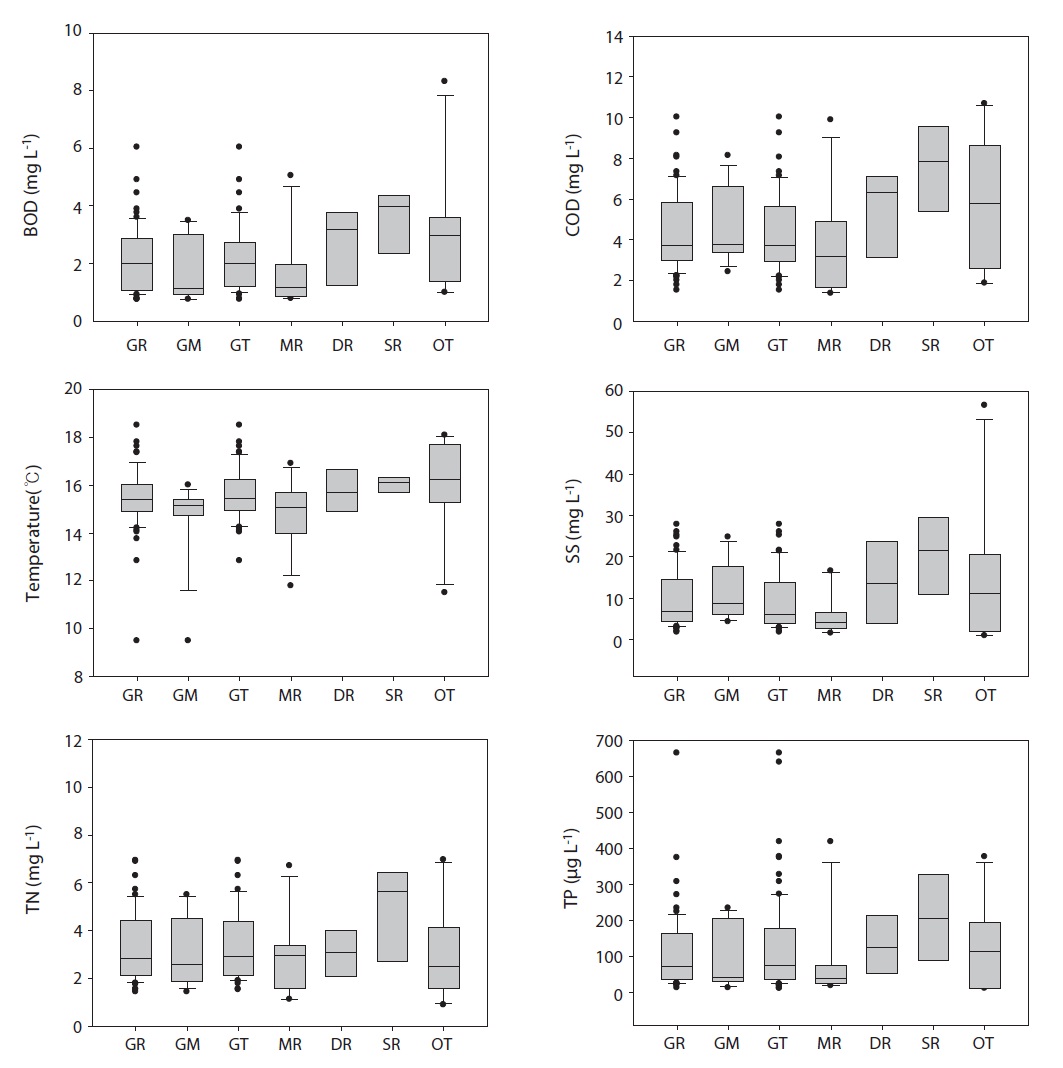
According to water chemistry analysis, concentrations of BOD, as a measure of organic matter pollution, averaged 2.4 mg L-1 (range: 0.7 - 7.0 mg L-1, n = 99; Fig. 1), indicating a good condition” by the criteria of MEK (2006). The watershed of Sapkyo Stream had higher mean (3.8 mg L-1) than any other watersheds such as MR and DR watersheds (Fig. 1), indicating a greater degradation. Spatial patterns of COD were similar to variations of BOD. Suspended solids (SS) averaged 10.8 mg L-1 (range: 0.9 - 56.6 mg L-1) in the all watersheds, indicating a low impacts of solids in the watersheds.
Nutrient analysis of nitrogen (N) and phosphorus (P) in the ambient water indicated a eutrophic state. Total phosphorus (TP) varied from 11.4 to 663.5 μg L-1 depending on the sampling locations and seasons (Fig. 1) and averaged 129.3 μg L-1, which is judged as highly enriched in the watersheds. Spatial patterns of phosphorus were similar to the nitrogen dynamics except for some locations. Thus, organic matter pollution, based on BOD and COD parameters, reflected nutrient regimes of TN and TP as well as suspended solids. Mean values of BOD, COD, and SS were minima in Mangkyeong River, whereas they were maxima in Sapgyo Stream watershed (Fig. 1). Especially, TN and TP were highest in Sapgyo Stream due to direct influences of point sources such as residential, industrial, and livestock from the watershed. Park et al. (2001) pointed out that effluent effects from those point sources were more intensified during monsoon season. These results suggest the hydrological influences of water quality under the conditions of point source pollutions (Ganasan and Hughes 1998, Barbour et al. 1999). Most TN:TP ratios, based on mass ratios, were greater than 17, indicating a phosphorus limitation rather than nitrogen. Thus, N:P ratios were decreased in the more polluted watersheds such as Mangkyeong River and Sapgyo Stream.
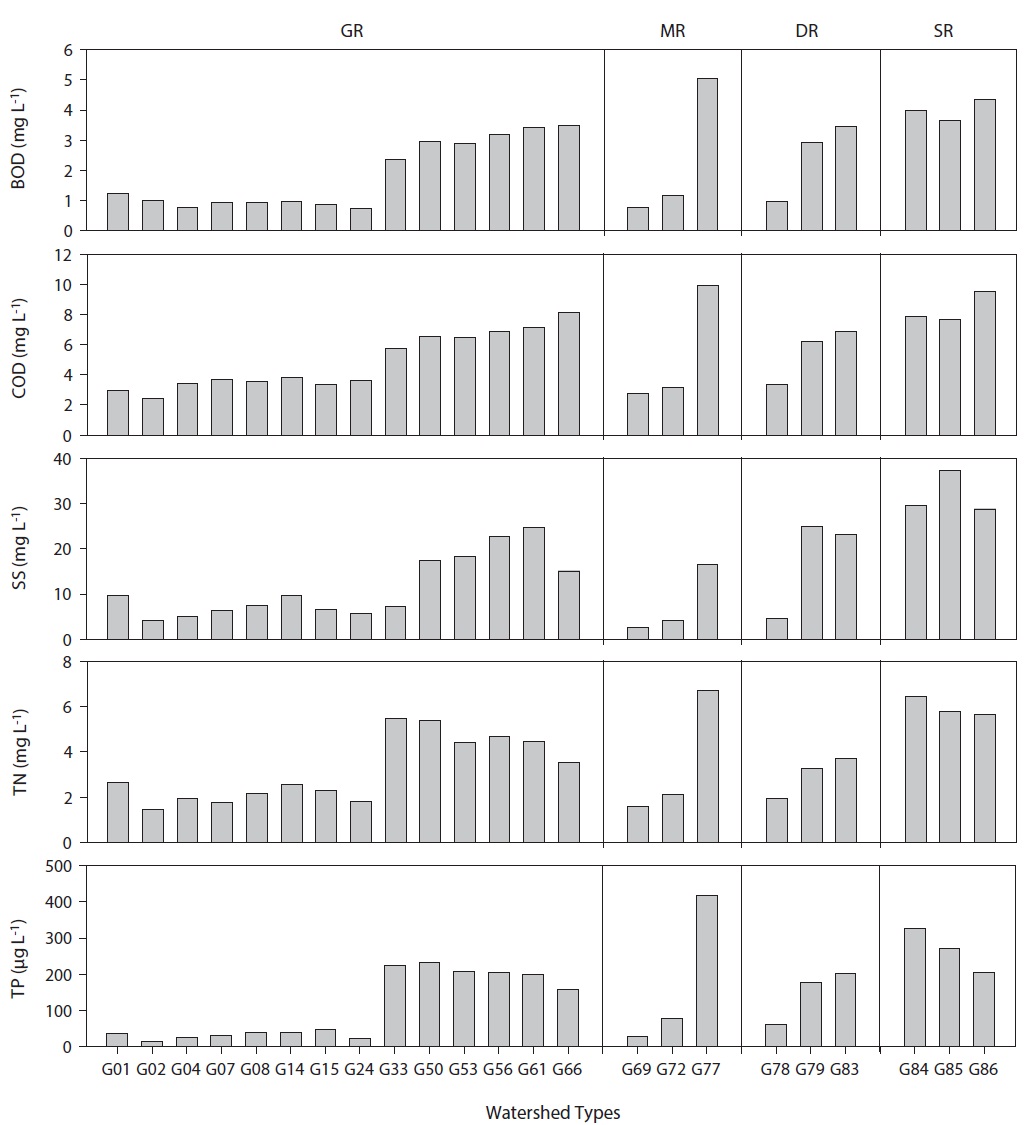
Chemical analysis in the mainstream sites of four watersheds indicated that water quality showed a decreasing trend toward the downstreams in the watersheds of GR, MR and DR, whereas it showed enhancing trend toward the downstreams in the SR watershed. As shown in Fig. 2, all concentrations of BOD, COD, SS, TN and TP in the mainstreams of Geum River increased abruptly in G33, which is directly influenced by wastewater treatment
plants (WWTPs) of Gap Stream and in G50, which is directly influenced by wastewater treatment plants (WWTPs) of Gap Stream (GS) and Miho Stream (MS). Thus, TP in G33 sites increased 9 times greater than in the G24, while TN in G33 increased about 2.5 times greater than in the G24 (Fig. 2). Such larges differences between the two sites were due to major point sources of GS, and also effluents from the MS added up the greater organic matters and nutrient enrichments.
The organic matter and nutrient pollutions were worse near the point source reach. Thus, Miho Stream and Gap Stream which pass through the major large cities characterized as large point sources of the typical urban regions. Kim and An (2008) pointed out that it was necessary to manage these two streams for improving downstream water quality of Geum River. In the meantime, large nutri-ent enrichments occurred between G72 and G77 sites of Mangkyeong River (Fig. 2), resulting in hyper-eutrophic conditions of > 400 μg L-1 as TP and > 6.3 mg L-1 as TN. Such downstream nutrient enrichments were highest among the all sampling sites and this was due to inflows of serious polluted water from Jeonju tributary stream (Park et al. 2009).
>
Physical habitat health evaluations using multimetric modeling approach
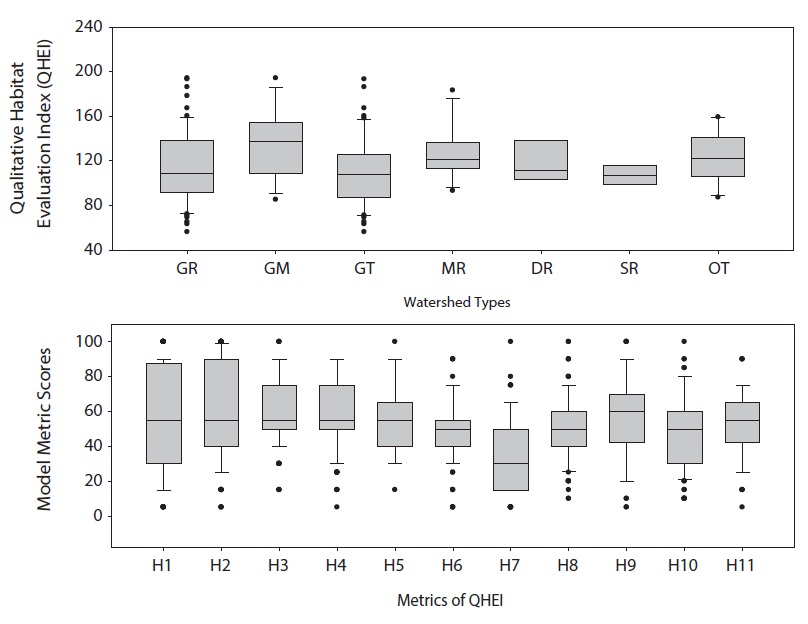
Physical habitat health, based on multi-metric modeling approach of Qualitative Habitat Evaluation Index (QHEI) varied between 56 and 194 (n = 100) and averaged 114 in the all sampling sites. This health condition was judged as a “good condition (G)” by the criteria of US EPA
(1993). In the entire watersheds, the model mean value of QHEI was highest (mean = 127; range = 93 - 183) in Mangkyeong River watershed and was lowest in Sapgyo Stream (SS) watershed (mean = 105.7; range = 84 - 125; Fig. 3). The minimum in the SS watershed was mainly attributed to active channel constructions and modifications in midto- downstream regions. The constructions affected to relative proportions of sands on the bottom substrates, resulting in decreasing of relative riffle area and rapid deposition of silt and sand on the stream bottoms (Plafkin et al. 1989). Such activities of the SS watershed degraded more rapidly physical habitat health than in other watersheds.
In the analysis of primary variables such as substrate structure and vegetation coverage proportions, silt sedi-mentation and habitat simplification occurred more in the downstream reaches than in the upstream sites. In contrast, substrate types and natural habitats in H1 (substrate / instream coverage, 55.7%), H2 (embeddedness, 59.7%). and H3 model metrics (flow velocity / depth, 60.0%) judged as “good conditions” in most sites, except for few locations. The habitat health in terms of H4 metric (channel flow status, 58.2%) had similar patterns with metric variables of H1 - H3 (Fig. 3). The H4 metric had low scores in upstream and tributaries and this was mainly attributed to seasonal flow reduction effects on the small weirs that set up a lot in the channel and artificial waterbodies such as Daechung and Yongdam reservoirs. The metric of H11 (dam construction, 54.6%) was shown as relatively low variance among the sampling sites (Fig. 3),
disand artificial structures, like as dam or weir mainly were infrequently observed in most sites.
In the meantime, secondary variables of channel characteristics (H5) had remarkably low scores at the sites with channel constructions and modifications (Fig. 3). Those sites were usually located in the urban regions of midstreams and also located near the recreational resorts and recreational parks. The metric of H6 (bottom scouring / sediment deposition, 48.7%) also had low scores in the downstream reaches due to massive sedimentations caused by an infrastructure built such as weirs and small dams, usually associated with flow reduction. While, it was scored high at the mainstream with heavy amount of flowing and downstream reaches. In this survey, one of the significant features in the all metrics was frequent reduction of frequency of riffles or bends. Thus, the metric values of H7 (frequency of riffles or bends) was 35%, which was lowest among the entire metrics. This was mainly due to wide channelization for larger storage capacity of stream water, especially near the large bridges in the stream, resulting in lower channel sinuosity (Barbour et al. 1999, Ohio EPA 1989).
Tertiary variable analyses of H8 - H10 metrics showed that mean values varied between 10 and 13 (Fig. 3), indicating a “fair health” conditions by the criteria of Plafkin et al. (1989). The metrics of H8 (bank stability, 49.2%), H9 (bank vegetative protection, 53.8%), and H10 (riparian vegetative zone width, 49.3%) had relatively decreased scores in urban regions, which is associated with artifi-cially modified channel, riverside roads and recreational parks. These conditions resulted in unstable banks by erosion and narrow riparian vegetative zone, so the physical habitat health was affected by these tertiary stream variables.
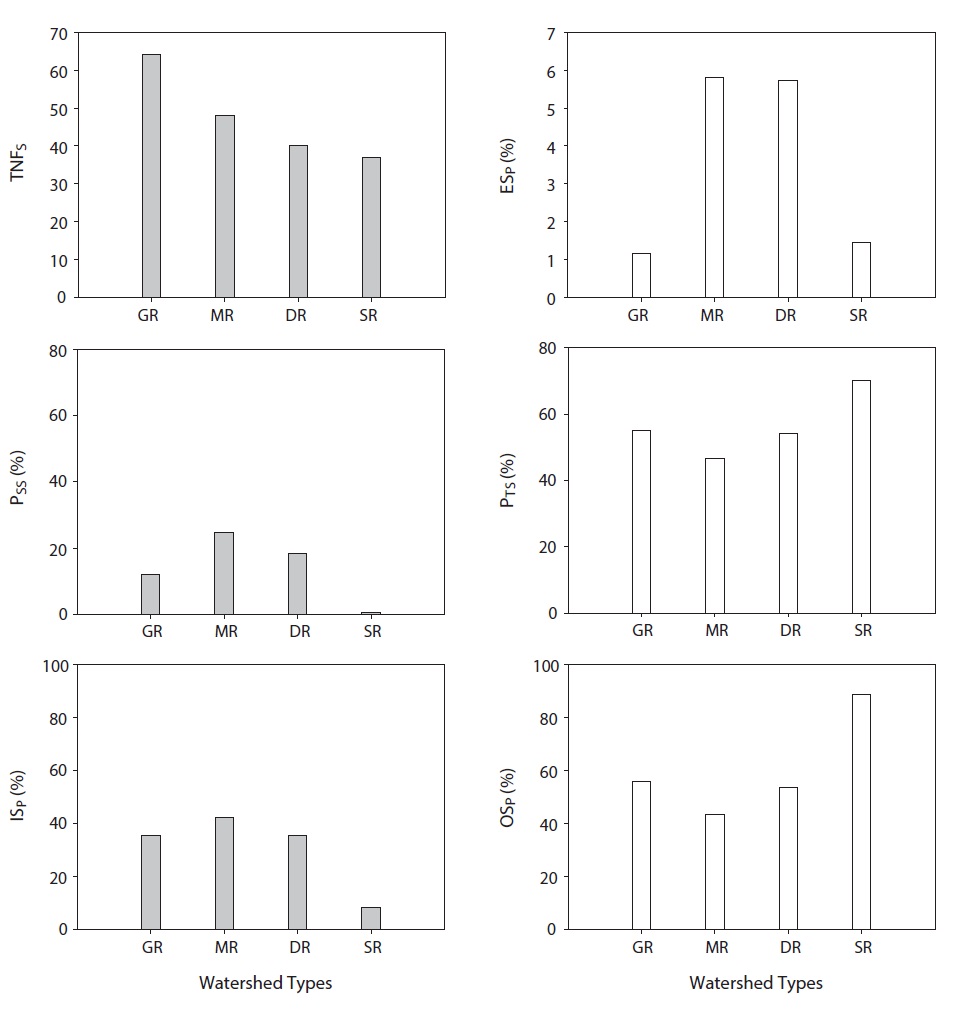
During the study period, total 17 families and 77 species were sampled at the 100 sites within four watersheds. Total number of fish species sampled was 64 and 48 in Geum-River (GR), Mangkyeong River (MR) watersheds, respectively, while it was 40 and 37 in Dongjin River (DR) and Sapgyo River (SR) watersheds, respectively (Fig. 4). The species diversity, thus, was greatest in the GR watershed, which reflected the size of drainage. Exotic species were > 1% in all watersheds and were higher in the MR and DR watersheds than others (Fig. 4). The fish species was mainly composed of tolerant species with > 45% of the total and the proportion in the SR watershed was 70%. This composition indicates that the waterbodies were severely degraded by the criteria of tolerance guilds (US EPA 1993). In contrast, the proportions of sensitive species were < 25% in the all watersheds, and the proportion was < 3% in the SR watershed (Fig. 4), indicating that the ecosystem is largely disturbed due to chemical and habitat degradations. Trophic structure, based on the bioindicator of omnivore species and insectivore species (Karr 1981, US EPA 1993, Barbour et al. 1999), also showed a distinct
ecological disturbance. The proportions of omnivore were > 40% in all watersheds and insectivores were < 40% in the all watersheds (Fig. 4), indicating a poor ecological health (Barbour et al. 1999). Especially, the proportion of omnivore was > 80% of the total in the SR watershed, indicating a severely damaged fish composition by eutrophication and habitat disturbances (Ohio EPA 1989).
>
Relations of tolerant and sensitive species to water quality and habitat health
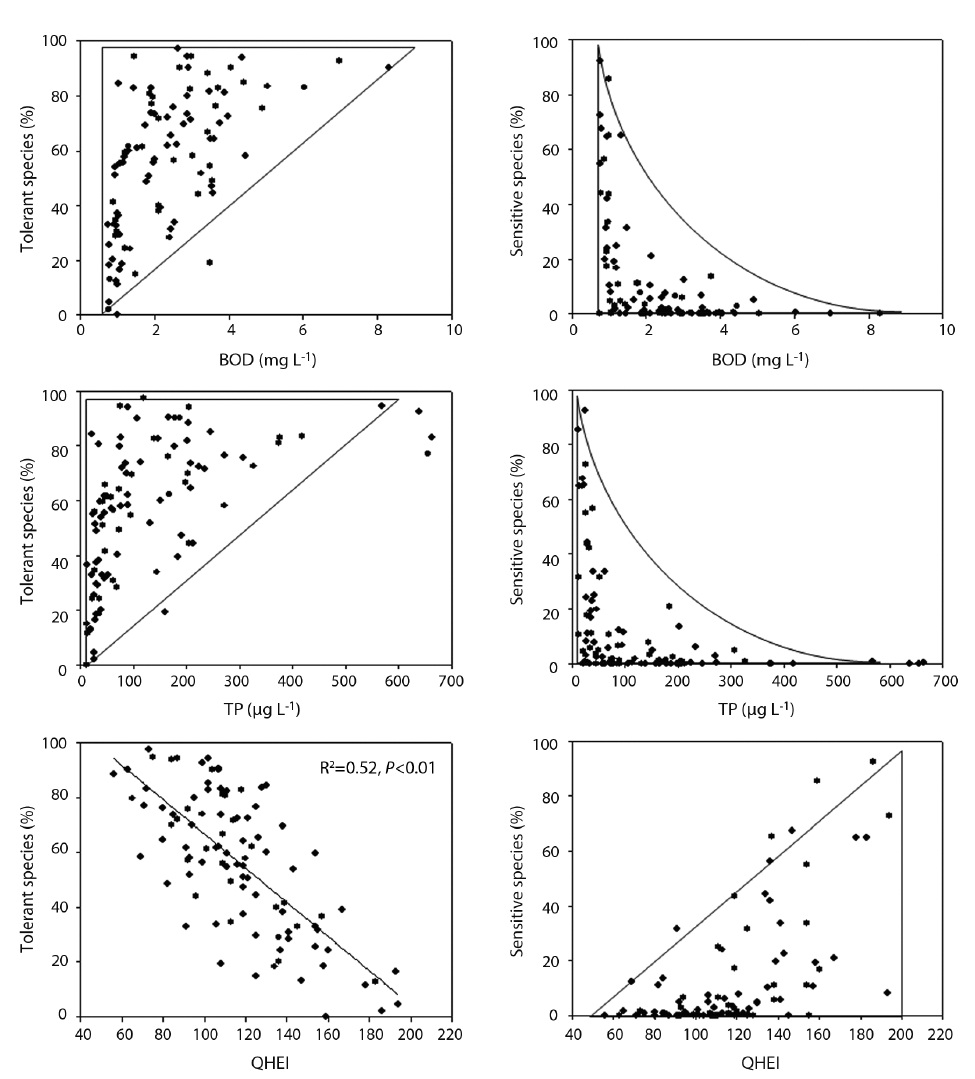
The plots of tolerant species (TS) and sensitive species (SS) to water chemistry data (Fig. 5) showed that proportions of tolerant species (PTS) had linear relations with increases of organic matter and nutrients (N, P). Values of PTS ranged between 0% and 99% when mean concentrations of biological oxygen demand (BOD) were < 1 mg L-1, whereas the values of PTS were > 85% when BOD were > 6 mg L-1. In the water quality ranges of 4 - 6 mg L-1 as BOD, the PTS values were > 40%. In contrast, the proportions of sensitive species (PSS) had inverse relations with concentrations of BOD (Fig. 5). Values of PSS ranged between 0% and 93% when concentrations of BOD were < 1 mg L-1, whereas the PSS values were < 2% when mean concentrations of BOD were > 5 mg L-1 (Fig. 5). These results suggest that sensitive species are rapidly decreased by organic matter pollutions.
Relations of tolerant species and sensitive species to nutrients (TP) also had similar patterns with BOD values. Values of PTS ranged between 0% and 98% when mean concentrations of TP were < 50 μg L-1 whereas the PTS values were > 75% when TP values were > 400 μg L-1. In the water quality ranges of 300 - 400 μg L-1 as TP, the values of PTS were > 50% (Fig. 5). In the meantime, the proportions of sensitive species (PSS) decreased rapidly with increases of phosphorus. Values of PSS ranged between 0% and 93%
when TP values were < 50 μg L-1, whereas the PSS values were < 1% when mean concentrations of TP were > 300 μg L-1.
Regression analyses of tolerance guild parameters against habitat quality showed that tolerant species (PTS) had a negative linear relation with physical health multimetric model values. The values of PTS had a significant inverse function (p < 0.01, R2 = 0.52) with values of Qualitative Habitat Evaluation Index (QHEI; Fig. 5). Tolerant species, thus, linearly increased as the habitat health conditions degraded, and also increased with increases of BOD and TP. In contrast, the values of the PSS values were < 1% when mean TP values were > 300 μg L-1 (Fig. 5), thus the proportion of PSS had a positive linear function with maximum QHEI values at each interval. Overall, these results support the hypothesis (Barbour et al. 1999, US EPA 1993) that relative proportions of tolerant and sensi-tive fish species in the habitats are directly determined by both water quality and habitat quality.
>
Multiple eco-metric health assessment (MEHA) model
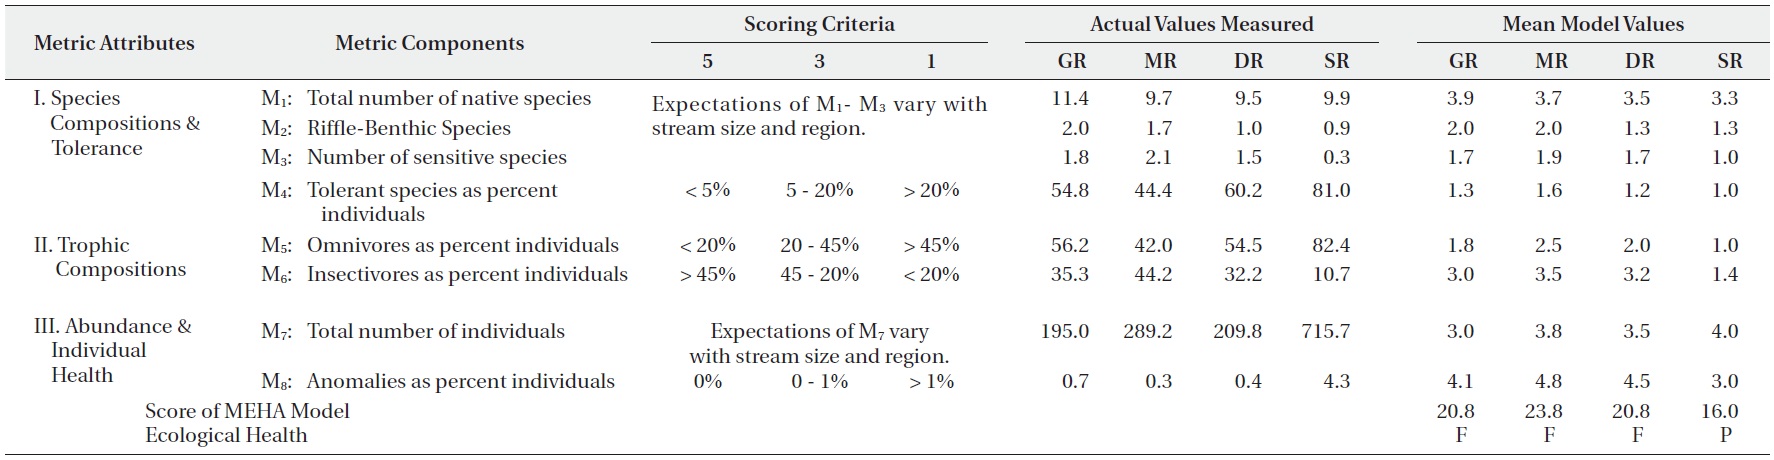
Ecological health in the four watersheds was evaluated using multiple eco-metric health assessment models as shown in Table 1. We adapted eight-metric model for the multimetric model development, based on the original model of the Index of Biological Integrity (IBI; Karr 1981), and each metric value was compared to the value expected at the references streams and rivers (i.e., least-disturbed waterbody; Barbour et al. 1999) located in the watersheds where human influences have been minimal. Scoring criteria of 1, 3, and 5 were assigned to each metric according to whether its value approximates, deviates

2Multiple eco-metric health assessment model, based on fish bioindicators, and the ecological health in the four watersheds (GR = Geum River watershed, MR = Mangyeong River watershed, DR = Dongjin River watershed, SR = Sapgyo River watershed). Ecological health of ‘C’ and ‘D’ indicates a fair condition and poor condition, respectively (F: Fair condition, P: Poor condition).
somewhat from, or deviates greatly from the value expected at the eleven metric ratings (Table 1). Overall, mean MEHA was 20.4, which was judged as a fair condition, based on the modified criteria of US EPA (1993). Values of MEHA, based on four major watersheds, varied from 16 in the SR watershed to 23.8 in the DR watershed. Thus, ecological health was worst in the SR watershed and these conditions were closely related with highest TP (nearly 200 μg L-1) and TN (5.5 mg L-1) as shown in Fig. 1. According to the each metric analysis, metric values of M1, as total number of native species, were > 4.0 in all watersheds and values of M7 metric, as total number of individuals, were > 4.4 in all watersheds. These two each metric indicates that the ecological health is nearly excellent condition. In contrast, values of M7, as tolerant species as percent individuals, were < 1.5, indicating nearly poor conditions.
Overall, our data indicated that water chemistry, based on nutrients (N, P) and organic matter (BOD, COD) directly modified the trophic structures in relation to food chain in the aquatic ecosystems, and then these influenced the tolerance species and sensitive species of the fish compositions. These conditions reflected physical habitat health conditions, based on multi-metric approach of Qualitative Habitat Evaluation Index (QHEI). Under these circumstances, the proportions of omnivores dominated the fish community and the insectivores were largely reduced in the all watersheds. This chemical degradation, habitat disturbances, and the modified trophic compositions influenced the overall ecological health in the all watersheds, as shown in previous numerous other researches (Karr 1981, Ohio EPA 1989, US EPA 1993, Barbour et al. 1999). The ecosystem health, based on multiple eco-metric fish health model, was judged as “fair - poor” condition. Especially, the Miho Streams and Gap Streams influenced by effluents of wastewater disposal plants in the urban regions degraded the chemical conditions of the mainstream of Geum River, resulting in severely poor ecological health. Our integrative ecosystem evaluations suggest that nutrient enrichments should be reduced from the effluents of point pollution sources in the urban regions for better ecological health in the future.