검색 전체 메뉴
PDF
맨 위로
OA 학술지
Relationship between airborne pollen concentrations and meteorological parameters in Ulsan, Korea
  • 비영리 CC BY-NC
  • 비영리 CC BY-NC
ABSTRACT
Relationship between airborne pollen concentrations and meteorological parameters in Ulsan, Korea
KEYWORD
airborne pollen , meteorological parameters , peak date , start date , Ulsan
  • INTRODUCTION

    Many plant species have anemophilous flowers, with their pollen being carried primarily on air currents. These anemophilous flowers may not always be readily distinguished from entomophilous flowers whose pollen is carried primarily by insects. The anemophilous pollens are biological particles transported within aerosols (Ogend et al. 1974). The anemophilous pollens are related with some of allergic diseases and especially has been included asthma-allergic lung disease, hay fever-allergic rhinitis and allergies of the eyes and skin (Choi 2011). A environmental material such as pollen in aerosols can trigger allergic symptoms in susceptible humans (D’Amato et al. 2007). It is necessary to investigate pollen types, concentrations, and dispersal periods to determine strategies that could potentially decrease the direct impact of airborne pollen on pollinosis patients. Many countries are accumulating information regarding airborne pollen using the pollen calendar, which is a compilation of monthly data on airborne pollen scatter of major species using statistical analysis. Such information is also made available to the local public data (Lewis et al. 1983, Anderson 1985, Prentics 1985). Airborne pollen scattering, type, and concentration vary from region to region locations (Knok 1979, McDonald 1980), and they are accordingly interrelated with local meteorological parameters such as wind speed, wind direction, air temperature, humidity, and precipitation (Dimitrios et al. 2004) as well as local vegetation (Garcia et al. 2002, Stella 2000). Therefore, local environmental factors that may affect airborne pollen, including local meteorological parameters and vegetation, should be assessed (Boral et al. 2004).

    Many studies on airborne pollen in South Korea, have focused on pollen density, size, shape, and scattering patterns, although a few studies have emphasized the relationship between environmental factors and airborne pollen distribution (Chang and Kim 1985, Oh 2009). Continuing to study airborne pollen will be most beneficial to preventive medicine. Therefore, it is imperative to identify which reflects the characteristics of each region for the correlation between meteorological elements and airborne pollen. The purpose of this study was to classify the airborne pollen in Ulsan, and to describe the relationship between meteorological parameters and airborne pollen dispersal. In order to achieve this, we analyzed the pollen scattering period, peak date and concentration of pollen of tree pollen (Pinus, Quercus, and Alnus) and herbaceous pollen (Humulus).

    MATERIALS AND METHODS

      >  Study area

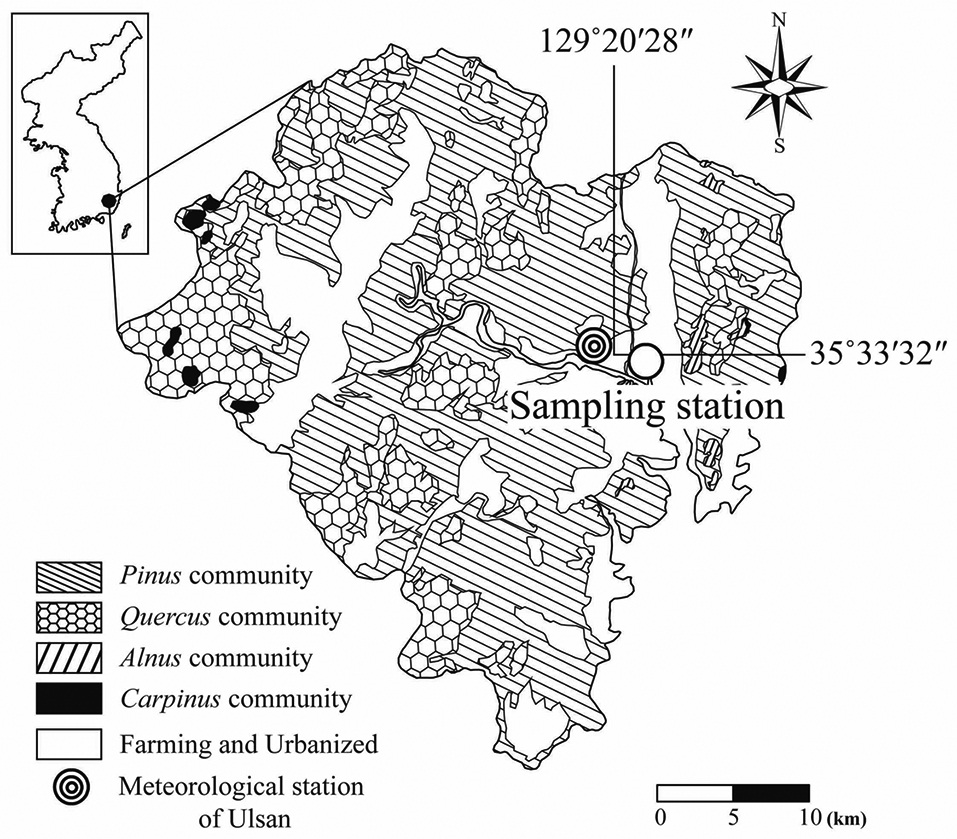
    Forest areas are distributed over approximately 64% (68134 ha) of the total area of Ulsan. Pinus communities comprise over 70% of the overall forest area, with Pinus densiflora Siebold & Zucc. as the dominant species. Quercus communities occupy nearly 30% of the forest areas. Riparian vegetation such as Miscanthus sinensis var. purpurascens (Andersson 1985) Rendle and Phragmites communis TRIN is found along the major perennial streams in Ulsan (Choi 2009) (including the Taehwa River and Dongcheon Stream, cf. Fig. 1).

    The sampling site for airborne pollen was located in an urban area of Ulsan (35°33′11″N, 129°21′22″E; altitude 43 m). Although the sampling site is in an urbanized area, it in proximity to the forested areas and the rivers of Ulsan. The sampling station is 3.4 km from the Ulsan Regional Meteorological Station.

      >  Sampling methods

    Durham samplers were used to collect airborne pollen grains (Durham 1946) from January 1, 2010 to December 31, 2011. Two horizontal 23 cm-diameter circular disks were placed 7.6 cm apart. A mount for a slide glass was placed between the two disks, 2.5 cm below their lower end. The entire apparatus was positioned 1.5 m above the

    ground. The installation was such that it was in an open area away from the air handling unit and in a position that allowed for regular exchange of the slide glass. Vaseline was applied to the surface of the slide glass (76 × 26 mm), which was then installed for 24 hr on the sampler. The slide glass was exchanged daily at 09:00. In instances when the slide glass was soaked by precipitation, it was allowed to try naturally. For preservation, the slide glass was stained and sealed using the GV method (gentian violet glycerin jelly). An 18 × 18 mm cover glass was used to protect the sample. Collected airborne pollen was measured and then compared with measurements of airborne pollen and a standard of pollen information collected by the Japan Allergy Foundation (Sahashi et al. 1993). Pollen grains were then measured as the number of grains per cm2 and rounded up to 1 decimal point. The start date was designated as the average of the first two consecutive days with pollen grain observations greater than 1 grains/ cm2. The end date was determined to be one day prior to three consecutive days without pollen grains being observed during the main season.

    In order to discern their relationship with airborne pollen scattering, seven meteorological parameters were monitored: average temperature, maximum temperature, minimum temperature, wind speed, maximum wind speed, relative humidity, precipitation, and sunshine. Data was collected at the Ulsan Regional Meteorological Station (located at 35°33′46″N, 129°19′34″E; altitude 34.7 m) using an anemometer, thermometer, and rain gauges set at 12.4 m, 1.7 m, and 0.6 m above ground level.

      >  Statistical analysis

    We were investigated the correlation between seasonal pollen concentration (i.e. start date and peak date) and 8 meteorological parameters. Especially, we focused on several pollen species that had clear seasonal pollen concentration and high concentration in studied sites. Spearman rank correlation coefficient was used to determine the relationship between the seven meteorological parameters and the pollination start and end dates. All statistical analyses were performed using the PASW Statistics 18 software (18.0.0).

    RESULTS

      >  Meteorological parameters and pollen monitoring

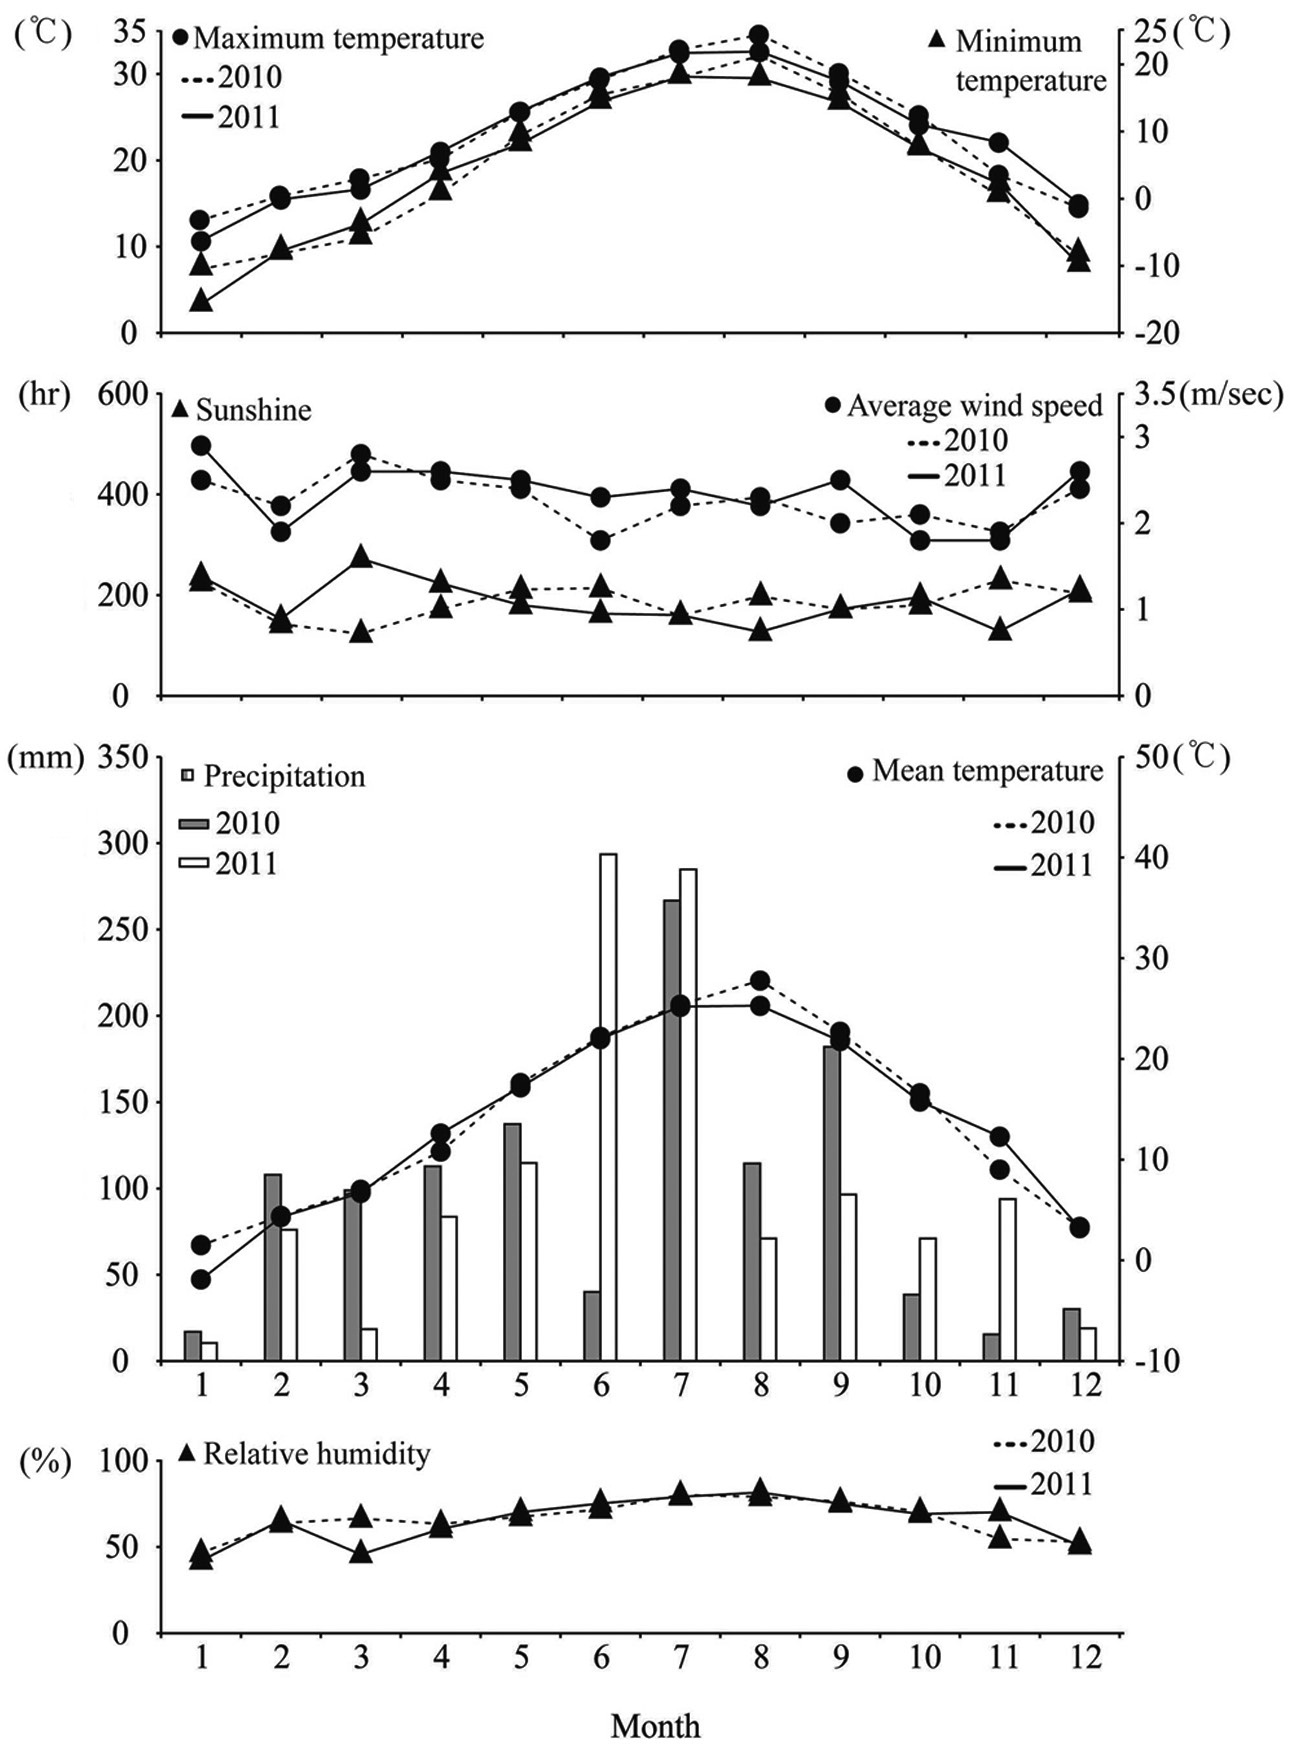
    The meteorological parameters in the study area were not statistically different between the two years of measurement. The average annual temperatures were slightly higher in 2010 than in 2011 by 0.3 ℃. Although annual precipitation was not significantly different between 2010 and 2011, spring rainfall was higher in 2010 than in 2011 by 132 mm. Maximum temperature in 2011 was higher by 4.1 ℃ than in 2010 and the lowest temperature in 2011 was also lower than that in 2010 by 0.3 ℃. Although the average relative humidity was not significantly different, the monthly relative humidity was 20.8 % higher in March 2010 than in March 2011. Sunshine was 149.2 hr longer in March 2011 than in March 2010 (Fig. 2).

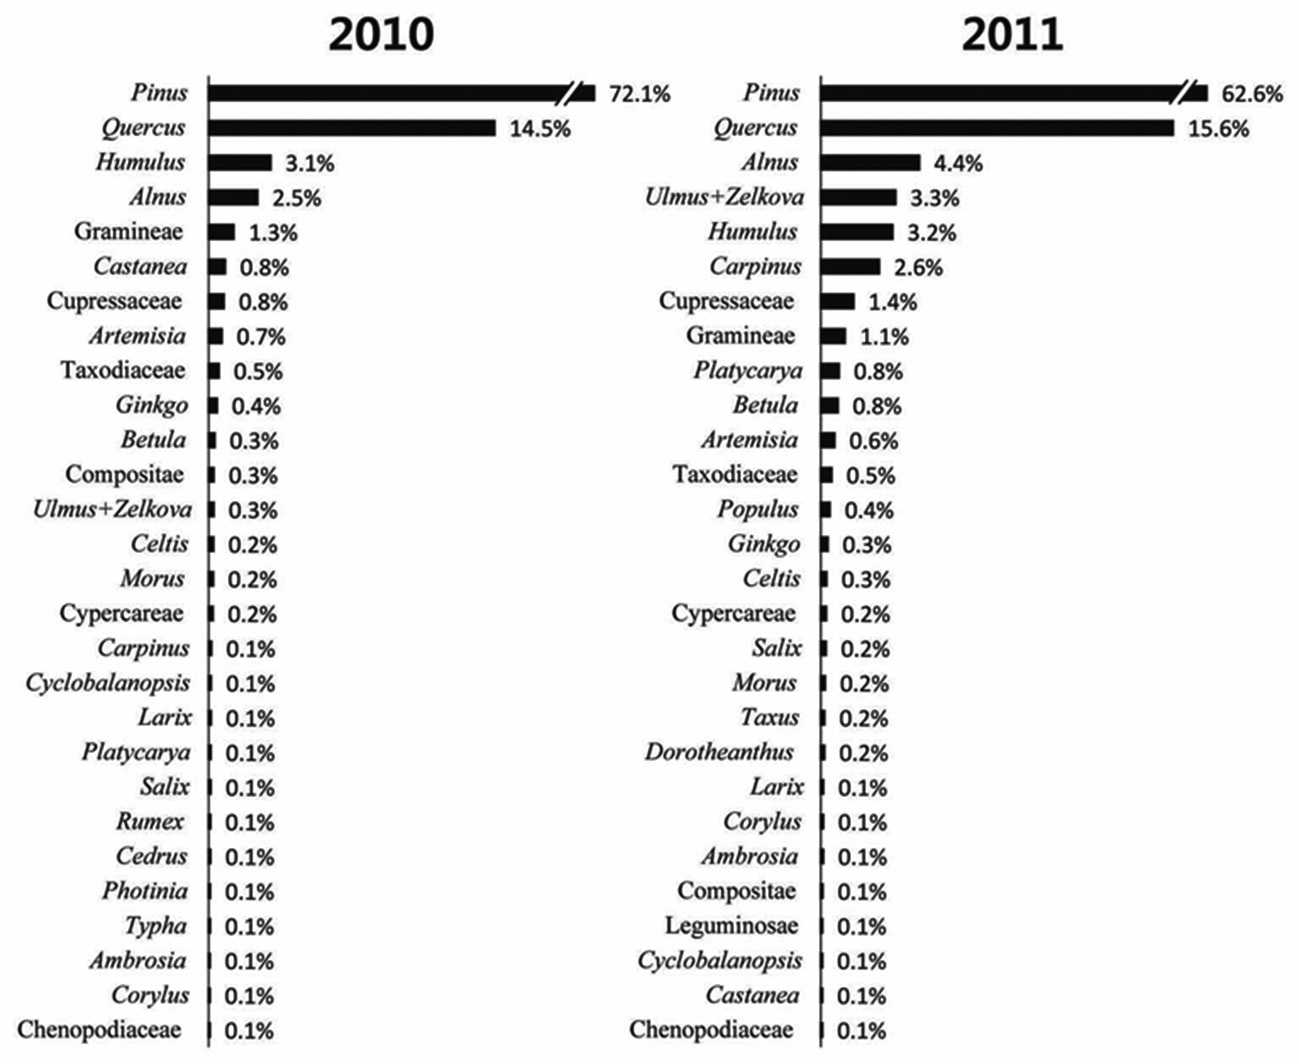
    Pollen from 36 genera belonging to 41 families were recorded and identified during the 2-year study. The total number of pollen grains recorded in 2010 was 13152.9 grains/cm2 and 11542.4 grains/cm2 in 2011. Pollen was recorded from 29 genera belonging to 23 families in 2010 and from 26 genera belonging to 21 families in 2011. Of these, 15 families (12 genera) and 14 families (12 genera) belonging to herbaceous plants were identified in 2010 and 2011, respectively. Pinus, Alnus, Quercus, and Humulus were the dominant pollen observed at the study site. In 2010, Pinus pollen was recorded in the highest concentration (72.1 % of the total pollen collected), followed by Quercus (14.5 %), Humulus (3.1 %), and Alnus (2.5 %). In 2011, Pinus pollen was again predominant at 62.6 % of the total pollen collected, followed by Quercus (15.6 %), Alnus (4.4 %), and Humulus (3.2 %) (Fig. 3). The remaining 20 taxa contributed less than 1% each to the total number of pollen grains (cf. Fig. 3).

      >  Relationships between meteorological parameters and pollen distribution

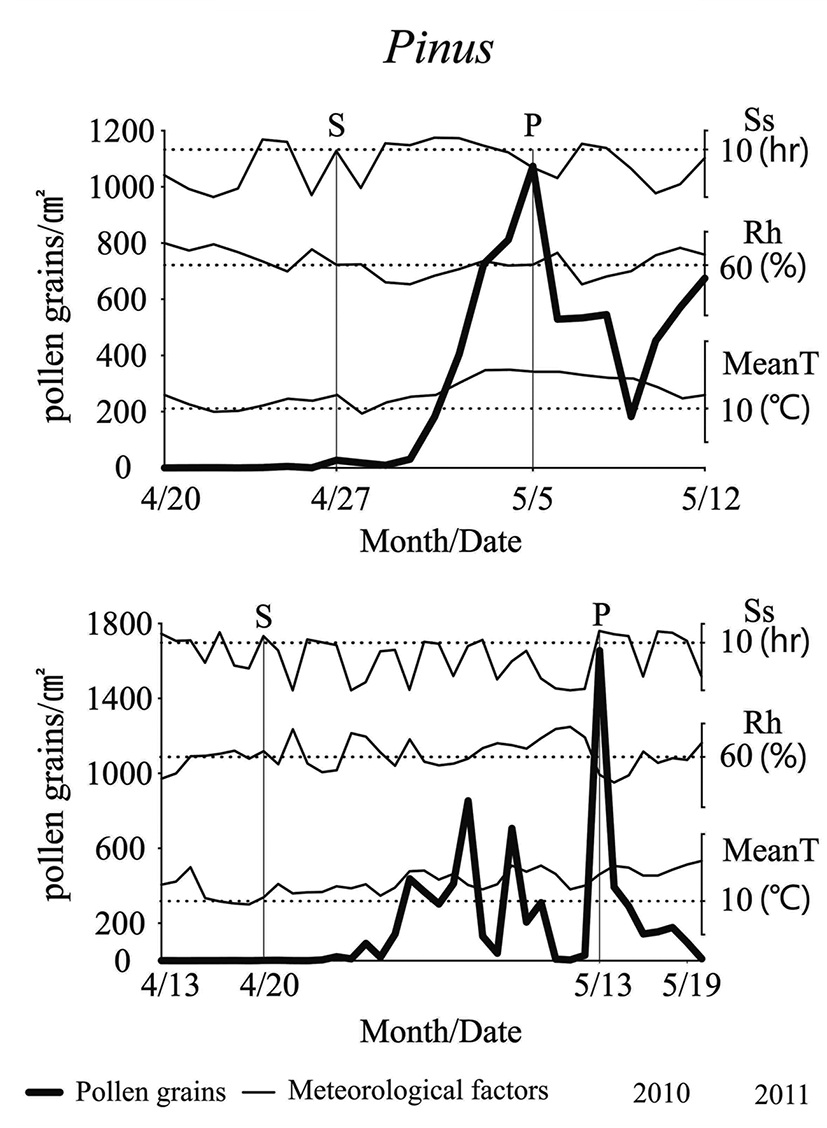
    The start date of the pollen season of Pinus was late April. The Pinus pollen peak can vary from year to year, but it usually is most noticeable for approximately 1?2 weeks, beginning as early as mid-March and ending as late as late July. The start date of the Pinus pollen season was earlier by 7 days in 2011 than in 2010 and the end date was earlier by 19 days in 2011 than in 2010. The total pollen grains collected was 2237 grains/cm2 fewer in 2010 than in 2011. The Quercus pollen start date was mid- April in 2011 and late April in 2010. The Quercus pollen season peaked during late April, and ended in late May in 2011and mid-June in 2010. The Quercus pollen season of 2011 was 14 days longer than that in 2010. The total pollen concentration in 2010 was 1521 grains/cm2 fewer than in 2011 (cf. Table 1).

    The start date of the pollen season of Alnus was late February in 2010 and mid-March in 2011. The peak date of this community was recorded as late March in 2010 and early April in 2011. The total pollen was 178 grains/cm2

    [Table 1.] Deposition time, peak time, and amount of pollen

    label

    Deposition time, peak time, and amount of pollen

    [Table 2.] Significant correlation coefficients (Spearman's R) for daily pollen concentration and meteorological parameters

    label

    Significant correlation coefficients (Spearman's R) for daily pollen concentration and meteorological parameters

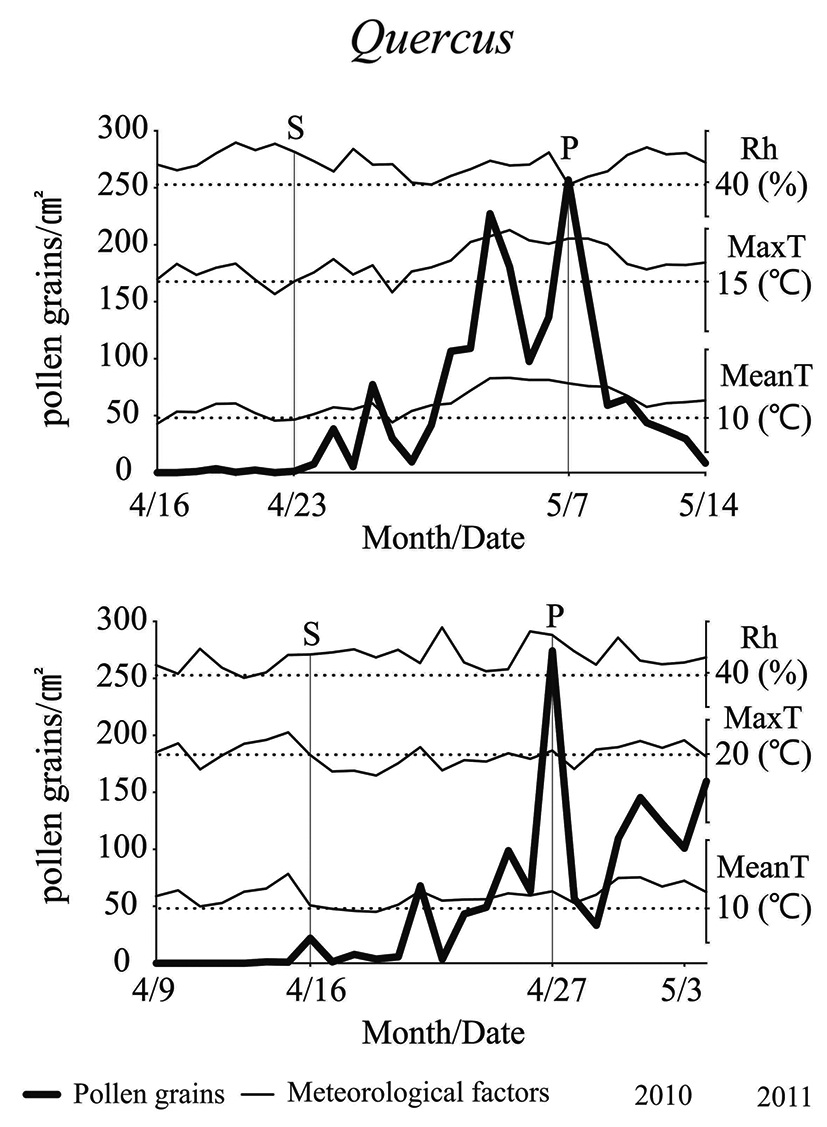
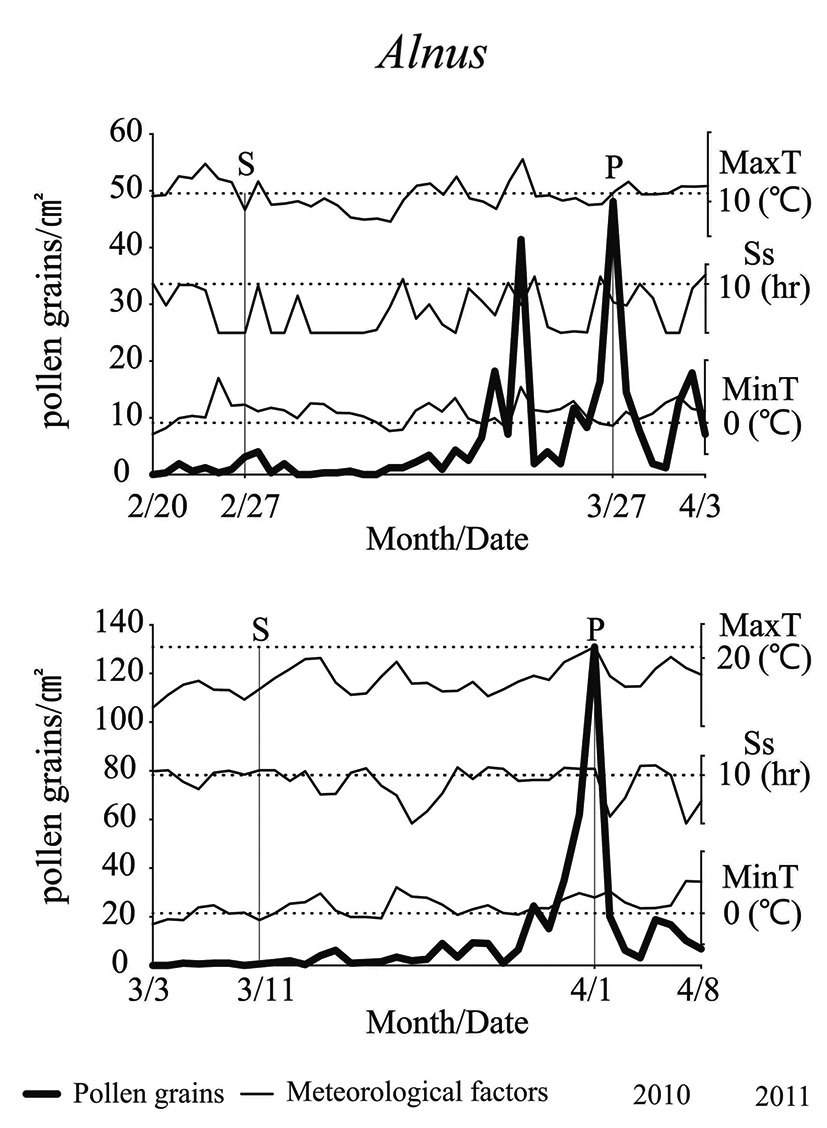
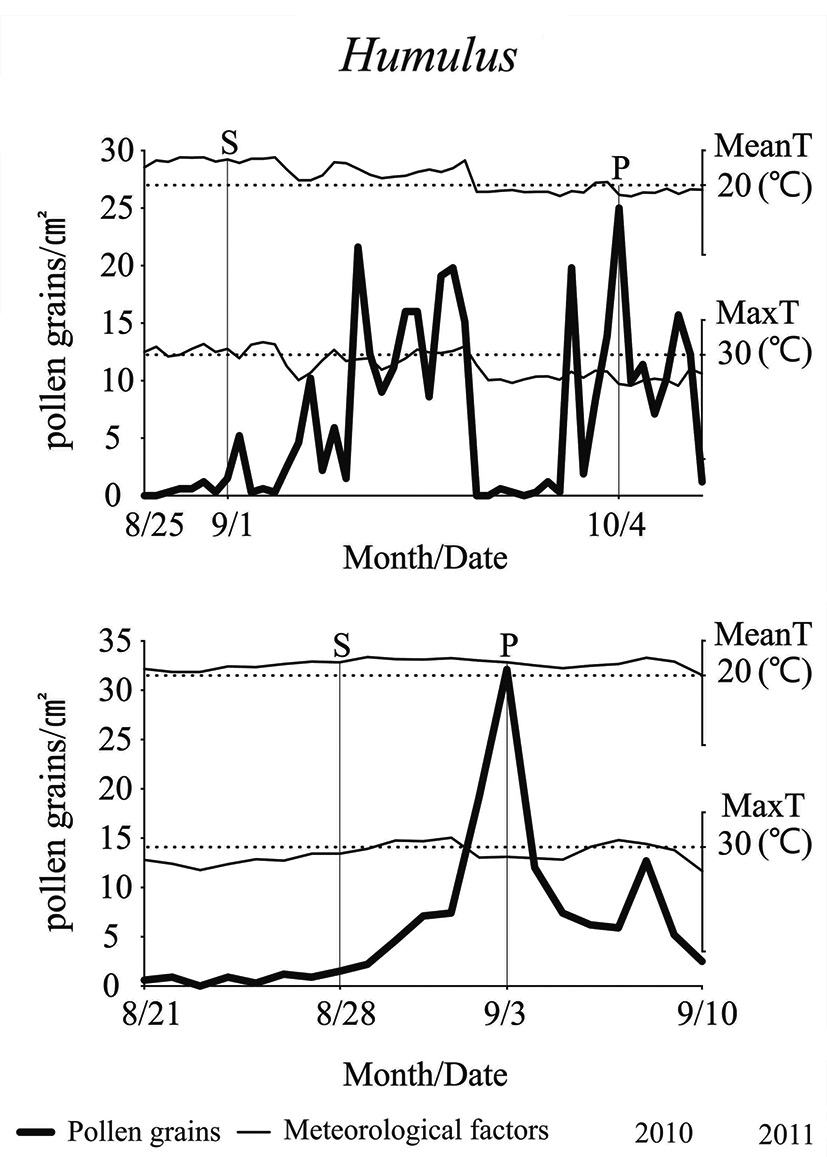
    greater in 2011 than in 2010. The start date of the Humulus pollen season was later than that for the other communities (Pinus, Quercus, and Alnus). Humulus pollen started scattering in late August in 2011 and early September in 2010. The end date of the Humulus pollen season was early October and early September, respectively. The peak date of this community differed greatly between years. The pollen season of Humulus was longer in 2010 than in 2011, and the total number of pollen grains was also greater by 52 grains/cm2. The airborne pollen concentration was significantly affected by meteorological parameters. The pollen season and concentration contributed by tree communities (e.g., Pinus and Alnus) were correlated with an increase in temperature (Table 2). In contrast, the pollen season of the Quercus community was correlated with wind (measured as the daily maximum wind speed and average wind speed). The pollen season of Humulus, an herbaceous species, was strongly affected by temperature. Relative humidity significantly affected the entire pollen community Table 2). The start day of the Pinus, Quercus, and Humulus pollen seasons was correlated with an increase of the average temperature (Figs. 4,5 and 7). However, the start day of the Alnus pollen season was affected by both the maximum and minimum temperatures (Fig. 6). The metrological parameters that strongly

    affected to the peak date of pollen were not clear but the peak date of Alnus pollen were was marginally related to sunshine (Fig. 6).

    DISCUSSION

    This study assessed the types and concentrations of airborne pollen grains in Ulsan. Pinus and Quercus pollen grains were the most prominent at the study site. These results reflect the vegetation of the region, in which Pinus and Quercus communities are dominant (Choi et al. 2011). That a particularly high Pinus pollen concentration was recorded is probably attributable to pollen grain morphology―Pinus pollen has two air sacs that can assist pollen scatter. The lower Humulus pollen concentration when compared to the tree pollen (Pinus, Quercus, and Alnus) might be due to the distribution of Humulus in Ulsan. Humulus populations have limited distribution because these plants tend to inhabit bare land or dry grassland within the urbanized area.

    Among the collected airborne pollens in Ulsan, the start date and peak date of Quercus, Ulmus+Zelkova, Carpinus, Alnus, Cupressaceae, Humulus and Gramineae were clearly identified. These species had strong correlation to meteorological parameters, particularly temperature parameters. However Ulmus+Zelkova, Carpinus, Cupressaceae, Gramineae that had low concentration in less than 3 % had not significant relationship between their seasonal pollen concentration and meteorological parameters. Falagiani (1990) also discussed that high temperature and dry air (with low humidity) were the factors having the greatest affect the pollen concentration. The pollen concentration and season is generally correlated with plant phenology (flowering, fruiting, and seed dispersion). Plant phenology is influenced by climatic conditions, particularly rainfall in the spring of the previous year and temperature in the spring of the current year. Murayama and Tonouchi (2007) emphasized the importance of climate conditions in the previous year. High precipitation in the previous year negatively affected flowering. In contrast, high temperature in the spring of the current year advanced the flowering and seed dispersion date. The effects of relative humidity varied between tree pollen and herbaceous pollen. High relative humidity reduced the tree pollen concentration but increased the herbaceous pollen concentration. This pattern is associated with the differences in pollen season between tree pollen (Pinus, Quercus, and Alnus) and herbaceous pollen (Humulus) (Knox 1979). During the tree pollen season (from early spring to early summer), rainfall and humidity are relatively higher than in the herbaceous pollen season (autumn), which is the dry season in South Korea.

    Pinus, Quercus, Alnus, and Humulus pollen, which are the most prominent pollen types in Ulsan, are the main pollens types associated with pollenosis in several cities in South Korea (Oh et al. 2009). In addition, the concentration of pollen in Ulsan is relatively higher than in other cities such as Gwangju and Gangneung (Oh 2009). The ability to forecast pollen concentration might be useful in developing methods for preventing pollenosis. In order to forecast pollen concentration, various modeling methods should be adopted based on local pollen data (pollen type, size, concentration, and vegetation type) and their relationship with metrological parameters (Jose et al. 2007, Robert and Joseph 2005). Specifically, metrological parameters associated with wind (wind direction, speed, seasonal wind, etc.) might be most the important factors affecting pollen dispersion and local pollen concentration (Athanasios 2005, Jane and Jean 1991, Silva 2000), although this study did not detect a significant relationship between pollen concentration and wind parameters.

참고문헌
  • 1. Anderson JH. 1985 Allergenic airborne pollen and spores in Anchorage, Alaska. [Ann allergy] Vol.5 P.390-399 google
  • 2. Athanasios D, Dimitrios G, Chariklia L, Christos B, Despina V. 2005 Transport of airborne pollen in to the city of Thessaloniki; the effect of wind direction, speed and persistence. [Int J Biometeorol] Vol.49 P.139145 google
  • 3. Boral D, Chatterjee S, Bhattacharya K. 2004 The occurrence and allergising potential of airborne pollen In West Bengal, INDIA. [Ann AgricEnbiron Med] Vol.11 P.45-52 google
  • 4. Chang NK, Kim NI. 1985 A Study on the Airborne Pollen Calendar in Mt. Kwanak. [Korean J Ecol] Vol.8 P.39-48 google
  • 5. Choi KR. 2009 Natural environment surveys and make an ecological zooming mapin in Ulsan Ⅲ. P.65-92 google
  • 6. Choi SH, Jung IY, Kim DY, Kim YH, Lee JH, Oh IB, Choi KR. 2011 Seasonal distribution of airborne pollen in Ulsan, Korea in 2009-2010. [J. Ecol. Field Biol.] Vol.34 P.371-379 google
  • 7. D’Amato G, Cecchi L, Bonini S, Nunes C, Annesi-Maesano I, Behrendt H, Liccardi G, Popov T, van Cauwenberge P. 2007 Allergenic pollen and pollen allergy in Europe. [Allergy] Vol.62 P.976-990 google
  • 8. Dimitrios G, Christos B, Athanasios D, Despoina P, George G, Dimitrios P. 2004 Fifteen years’ record of airborne allergenic pollen and meteorological parameters in Thessaloniki, Greece. [Int J Biometeorol] Vol.48 P.128-136 google
  • 9. Durham OC. 1946 The volumetric incidence of airborne allergens.Ⅳ. A proposed standard method of gravity sampling, counting and volumetric interpolation of results. [J. Allergy] Vol.17 P.79-86 google
  • 10. Falagiani P. 1990 POLLINOSIS. CRC Press, Boca Raton, FL, pp 3-18.Garcia MH, Galan C, Aira MJ, Belmonte J, Diaz de la Guardia C, Fernandez D, Gutierrez AM, Rodriguez FJ, Trigo MM, Dominguez-Vilches E. 2002. Modelling start of oak pollen season in different climatic zone in Spain. [Agricultural and Forest Meteorology] Vol.110 P.247-257 google
  • 11. Jane NH, Jane E. 1991 Diurnal variation of pollen concentration in the air of north-central London. [Grana] Vol.30 P.229-234 google
  • 12. Jose LAM, Jose MBS, Diego NL, Concepcion LF, Consuelo DG, Francisca AS. 2007 Forecastion airborne pollen concentration time series with neural and neuro-fuzzy models. [Grana] Vol.30 P.437-445 google
  • 13. Knox RB. 1979 Pollen and Allergy. P.45-48 google
  • 14. 2011 Resources Database. google
  • 15. McDonald Maurice S. 1980 Correlation of Air-Borne Grass Pollen Levels with Meteorological Data. [Grana] Vol.19 P.53-56 google
  • 16. Murayama K, Tonouchi M. 2007 Relationship between Pollen Disease and Meteorological Factors in Japan. [Global Environmental Research] Vol.11 P.65-71 google
  • 17. Lewis Walter H, Vinay Prathibha, Zenger, Bincent E. 1983 Airborne and allergenic pollen if North America. P.243-247 google
  • 18. Maurice S Mc D. 1980 Correlation of air-borne grass pollen levels with meteorological data. [Grana] Vol.19 P.53-56 google
  • 19. Ogden EC, Raynor GS, Hayes JV, Lewis DM, Haines JH. 1974 Manual for sampling airborne pollen. P.49-51 google
  • 20. Oh JW. 2009 Development of Pollen Concentration Prediction Models. [J Korean Med Assoc] Vol.52 P.579-591 google
  • 21. Oh YC, Kim HA, Kang IJ, Cheong JT, Kim SW, Kook MH, Kim BS, Lee HB, Oh JW. 2009 Evaluation of the Relationship between Pollen Count and the Outbreak of Allergic Disease. Pediatr Allergy Respir Dis 19: 354-364.Prentice IC. 1985. Pollen representation, source area, and basin size: Toward a unified theory of pollen analysis. [Quaternary Research] Vol.23 P.76-86 google
  • 22. Robert P, Joseph A Pietrowicz. 2005 Using dispersion and mesoscale meteorological models to forecast pollen concentrations. [Atmospheric Environment] Vol.39 P.7689-7701 google
  • 23. Sahashi N, Kishikawa R, Sankei N, Nishima S, Nagano H. 1993 Standardization of procedures for atmospheric pollen counts and pollen forecast in Japan. [Jpn J Palynol] Vol.39 P.129-134 google
  • 24. Silva P, Tormo M, Munoz R. 2000 Influence of wind direction on pollen concentration in the atmosphere. [Int J Biometeorol] Vol.44 P.128-133 google
  • 25. Stella MG, Jose M.A, Bellen ER, Javier B, Jose M, Joaquin MC. 2000 Effects of meteorological parameters and plant distribution on Chenopodiacedae-Amaranthaceae, Qeurcus and Olia airborne pollen concentrations in the atmosphere of Cartagena (Spain). [Aerobiologia] Vol.16 P.17-20 google
OAK XML 통계
이미지 / 테이블
  • [ Fig. 1. ]  Sampling station (Myeong chon elementary school), Meteorological station and vegetation of Ulsan.
    Sampling station (Myeong chon elementary school), Meteorological station and vegetation of Ulsan.
  • [ Fig. 2. ]  Meteorological parameters during the study period: ⓐ maximum/ minimum temperature, ⓑ sunshine/wind speed, ⓒ precipitation/ mean temperature and ⓓ relative humidity.
    Meteorological parameters during the study period: ⓐ maximum/ minimum temperature, ⓑ sunshine/wind speed, ⓒ precipitation/ mean temperature and ⓓ relative humidity.
  • [ Fig. 3. ]  Percentage contribution of pollen grains by genus for 2010 and 2011.
    Percentage contribution of pollen grains by genus for 2010 and 2011.
  • [ Table 1. ]  Deposition time, peak time, and amount of pollen
    Deposition time, peak time, and amount of pollen
  • [ Table 2. ]  Significant correlation coefficients (Spearman's R) for daily pollen concentration and meteorological parameters
    Significant correlation coefficients (Spearman's R) for daily pollen concentration and meteorological parameters
  • [ Fig. 4. ]  Start and Peak dates for Pinus and the relationship between meteorological parameters (S: start date, P: peak date, Ss: sunshine, Rh: Relative humidity, MeanT: mean temperature).
    Start and Peak dates for Pinus and the relationship between meteorological parameters (S: start date, P: peak date, Ss: sunshine, Rh: Relative humidity, MeanT: mean temperature).
  • [ Fig. 5. ]  Start and Peak dates for Quercus and the relationship between meteorological parameters (S: start date, P: peak date, Rh: Relative humidity, MaxT: maximum temperature, MeanT: mean temperature).
    Start and Peak dates for Quercus and the relationship between meteorological parameters (S: start date, P: peak date, Rh: Relative humidity, MaxT: maximum temperature, MeanT: mean temperature).
  • [ Fig. 6. ]  Start and Peak dates for Alnus and the relationship between meteorological parameters (S: start date, P: peak date, MaxT: maximum temperature, Ss: sunshine, MinT: minimum temperature).
    Start and Peak dates for Alnus and the relationship between meteorological parameters (S: start date, P: peak date, MaxT: maximum temperature, Ss: sunshine, MinT: minimum temperature).
  • [ Fig. 7. ]  Start and Peak dates for Humulus and the relationship between meteorological parameters(S: start date, P: peak date, MeanT: mean temperature, MaxT: maximum temperature).
    Start and Peak dates for Humulus and the relationship between meteorological parameters(S: start date, P: peak date, MeanT: mean temperature, MaxT: maximum temperature).
(우)06579 서울시 서초구 반포대로 201(반포동)
Tel. 02-537-6389 | Fax. 02-590-0571 | 문의 : oak2014@korea.kr
Copyright(c) National Library of Korea. All rights reserved.