Cicuta virosa L. (water hemlock) is a perennial herb native to northern and central Europe, northern Asia, and northwestern North America (Mulligan and Munro 1980, Lee 2003). Its population size has decreased in Korea which is a southern marginal area of distribution. C. virosa has been designated an endangered species by the Natural Environment Conservation Law and as a rare plant by the national arboretum in Korea (Korean Environment Institute 2005, National Arboretum 2009). C. virosa is also listed in 17 of 47 Japanese prefectural red lists (Japanese Wildlife Research Association 2012). In Hungary where almost all fens had been destroyed, C.virosa was a protected species (Tatar 2010). Few studies have investigated the specific properties of endangered plants to plan counter-measures for conservation in Korea (Suh et al. 2001). A few surveys of wild and rare plants in Korea have been carried out in the last decade due to urgency (e.g., Yoo et al. 2004, Jang et al. 2009, Song et al. 2010) and a series of studies on the conservation strategy for endangered and reserved plants based on the ecological and genetic characteristics has been performed by the National Institute of Environmental Research. However, C. virosa has not been a target species.
The water hemlock produces a lateral tuber before the root system dies in the fall and initiates a new plant the following spring (Kingsbury 1964). The plants persist by producing several new rootstocks from buds around the perimeter of the old rootstock (Mulligan and Munro 1980). The roots and tubers of C. virosa are toxic (Panter et al. 1988), and most studies on C. virosa have concentrated on its toxicology and pharmacology (e.g., Sarreveld 1975, Panter et al. 1988, Strauß et al. 1996). Water hemlock grows in a very wet substrate and is usually found growing in streams, ditches, lakes, rivers, or marshy areas. This high water requirement limits its range (Panter et al. 1988). Other environmental characteristics have not been studied well, even though basic ecological information is necessary to conserve C. virosa.
The primary goal of this study was to understand the environmental characteristics of C. virosa habitats. The specific objectives were to identify the major factors determining C. virosa distribution and the reason that the C. virosa population has decreased by comparing the water and soil environmental characteristics of C. virosa habitats. The water regime is a major determinant of plant community development and patterns in wetlands (Spence 1967, Casanova et al. 2000, Heegaard et al. 2001) and soil variable gradients are also important in determining plant community composition (Fitter 1982, Keddy 1984, Nilsson et al. 1989). An optimal environmental range of distribution for specific species has been proposed for several hydrophytes (Kwon et al. 2006, Lee et al. 2007, Yoon et al. 2011). Our study could be a method to understand the reason of decrease in population size of C. virosa and to seek a management strategy for conservation and restoration of the C. virosa habitat, an endangered plant.
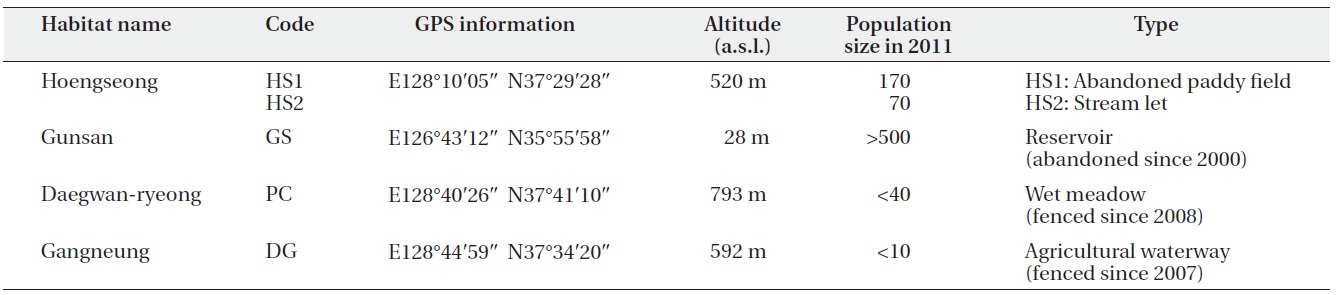
Only four habitats of C. virosa are known in South Korea, and we studied these four habitats (Table 1). The Hoengseong habitat (HS1 and HS2) was located between a grazing land and low hills at 520 m a.s.l. The distance between HS 1 and HS2 was about 700 m. HS1 was a 12 year
old abandoned paddy field. HS2 was a narrow streamlet, and water depth and vegetation were different between them. The Gunsan habitat (GS) is an abandoned reservoir that supplied water to a rice paddy at 28 m a.s.l. and is 2° south of HS. Water flows into the reservoir from farming land through an agricultural irrigation system in May and June and flows out during the rainy season in July. The Pyeongchang habitat (PC) was the highest at 793 m a.s.l. and the most northern among the four sites. This site has been protected by fences since 2008. The waterway has been altered by road construction and this resulted in drying at this site in the spring. We verified that there has been a marked decrease in the C. virosa population since an earlier informal survey was performed in 2008. The Gangneung habitat (DG) was recorded for the first time as a C. virosa habitat in South Korea. Although it is a private agricultural waterway, it has been fenced and protected since 2007 with agreement by the owner. Water at this site became dependent on an artificial supply in 2011, and the C. virosa population size decreased to < 10 individuals.
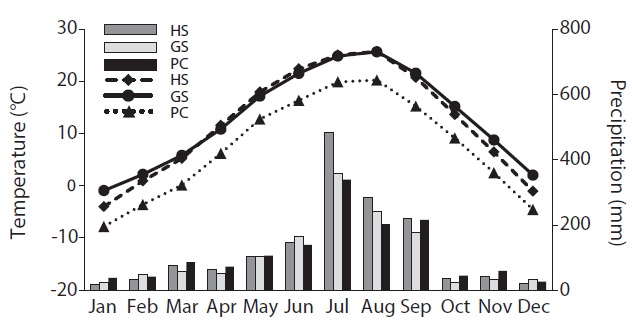
PC was the coldest with a heavy snowfall in winter (Fig. 1). HS and GS showed similar temperatures during the summer. However, HS was colder than GS during the winter. GS maintained above freezing temperatures except in January and HS received abundant rain in summer.
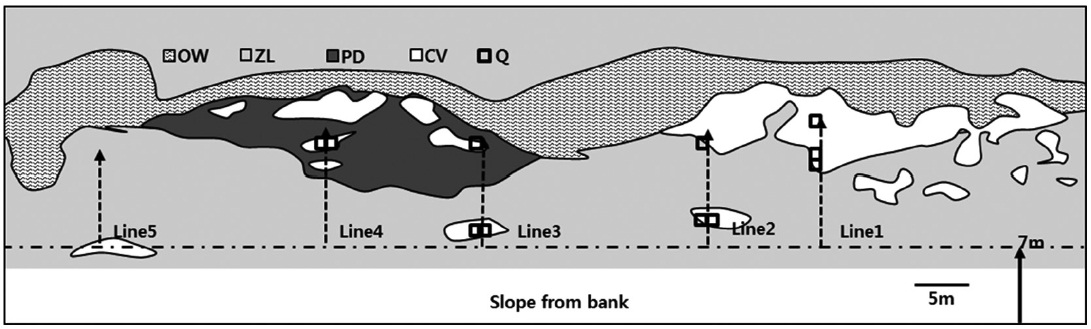
We established nine 1 m × 1 m permanent quadrats at HS1, five at HS2, 11 at GS, and three at PC according to C. virosa population size and investigated the cover, density, and height monthly during growing season in 2011, based on a modification of the Braun?Blanquet plant sociological method (Mueller-Dombois and Ellenberg 2003, Kim et al. 2004). A water gradient from the bank to the floating mat was observed at GS, where sizable C. virosa monopopulations were distributed. To determine the topography and the C. virosa community structure covering C. virosa mono-populations, we established five fixed line transects at representative locations at GS, and investigated vegetation distribution at each transect using the line intercept method (Canfield 1941). The 11 quadrats at GS were placed on those transects (Fig. 2).
We measured water level at each quadrat and fixed places comprised of major accompanying species monopopulations of every study site with a 1 m stick ruler. Water level was defined as the distance from substrate surface that C. virosa rooted in such as a floating mat or mound of plant roots. It was positive when the surface was below the water table and negative when the surface was above the water table. Water temperature and dissolved oxygen (DO) were measured with a DO meter (model PDO-520; UKAS, Taipei, Taiwan). Conductivity (EC) was measured with a Corning Checkmate II (model 311; Corning, Lowell, MA, USA), and pH was measured with a pH meter (model AP 63; Fisher, Pittsburgh, PA, USA) in the field. We collected water samples at each quadrat and fixed places comprised of major accompanying species mono-populations in 125 ml HDPE bottles once every month and brought them in a cool box to the laboratory and filtered them with a 0.45 μm membrane filter. We also took free water samples around the mat near permanent quadrats and interstitial mat water by squeezing the mat around C. virosa roots at a depth of 0?15 cm in each quadrat at GS. Those samples were collected twice before and after inundation of the mat on April 30 and June 20, 2012. NO3-N, NH4-N, and PO4-P were analyzed by the hydrazine method (Kamphake et al. 1967), indo-phenol method (Murphy and Riley 1962), and ascorbic acid reduction method (Solorzano 1969), respectively. The content of cations such as K+, Ca2+, Na+, and Mg2+ was measured using an atomic absorption spectrometer (Model AA240FS; Varian, Palo Alto, CA, USA). We used SPSS 19.0 software (SPSS, Inc., Chicago, IL, USA), a one-way analysis of variance (ANOVA), and Duncan’s post hoc test or a t-test at a 5% significance level for analyses.
Soil was collected once at a depth of 0?10 cm in a 20 × 20 cm area at each quadrat and fixed locations of major accompanying species mono-populations at every study site with a soil hand auger, and gravel and organic debris were removed. Particularly at GS, the mat around the C. virosa roots at a depth of 0?15 cm was collected in April and June. The soil and mat were then sealed in plastic bags and transported to the laboratory. We passed the soil samples through a 2 mm sieve and determined soil texture using the hydrometer analysis method and a texture triangle (Sheldrick and Wang 1993). We measured pH and conductivity using a soil solution prepared by mixing wet soil and distilled water at a mass ratio of 1:5. The total volume of water in wet soil was measured as freshwater moisture immediately after passing it through a sieve, and the amount of soil particle moisture was measured as airdried moisture in air dried soil by oven drying at 105℃ for ≥ 24 hours. Oven dried mat samples were milled to pass
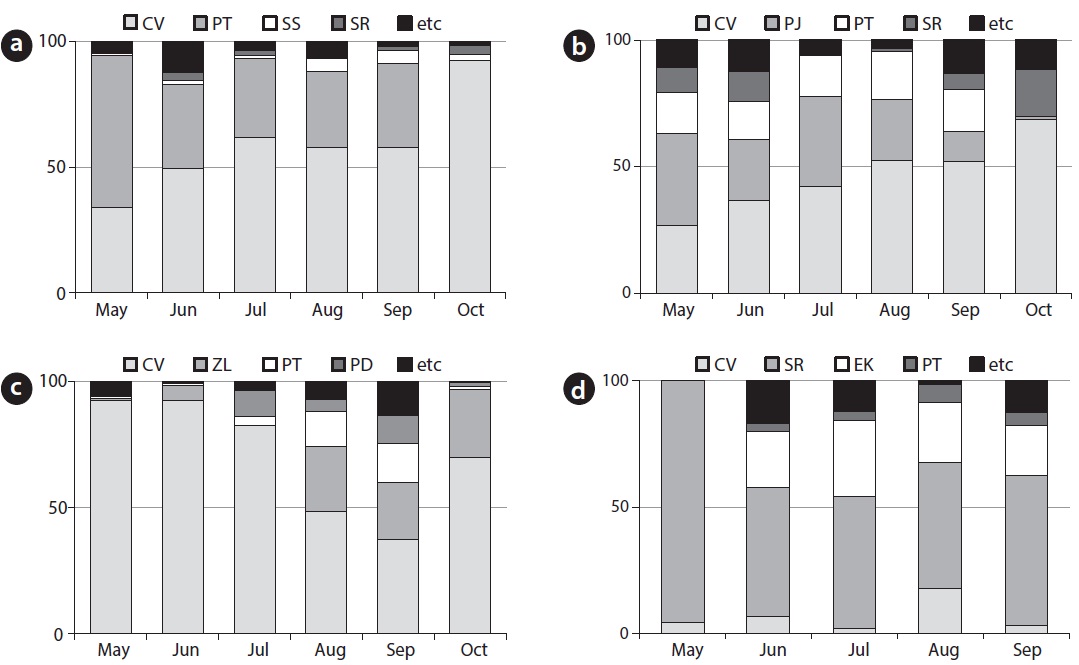
[Fig. 3] Species composition and relative coverage of C. virosa community at HS1 (a), HS2 (b), GS (c) and PC (d), CV: Cicuta virosa, PT: Persicaria thunbergii, SR: Scirpus radicans, SS: Sium suave, PJ: Phragmites japonica, ZL: Zizania latifolia, PD: Paspalum distichum, EK: Eleocharis kuroguwai
through a 1 mm mesh screen (Sasser et al. 1991). Soil and mat organic matter contents were analyzed by the loss on ignition method (Boyle 2004). NO3-N and NH4-N were extracted with 2 M KCl solutions (Kim et al. 2004) and measured using the hydrazine (Kamphake et al. 1967) and indophenol methods (Murphy and Riley 1962), respectively. PO4-P was extracted with Bray No. 1 solution (Bray and Kurtz 1945) and measured using the ascorbic acid reduction method (Solorzano 1969). K+, Ca2+, Na+, and Mg2+ were extracted with 1 N ammonium acetate solution (Allen et al. 1974) and measured using an atomic absorption spectrometer. We used a one-way ANOVA and Duncan’s post hoc test at the 5% significance level for analyses.
Major accompanying species at HS1 (Fig. 3a), were P. thunbergii (coverage of 30?60%) and Sium suave (coverage of 1?5%). The coverage of P. thunbergii decreased with growth of C. virosa (coverage of 33?92%). Major accompanying species at HS2 (Fig. 3b) were Phragmites japonica (coverage of 0?36%) and P. thunbergii (coverage of 14? 19%). Relative coverage of C. virosa (coverage of 29?69%) after the growing season increased due to wilt of companion species.
Major accompanying species at GS (Fig. 3c) were Zizania latifolia (coverage of 0?27.0%) and P. thunbergii (coverage of 0.5?15.5%). C. virosa (coverage of 37.1?92.2%) dominated on the mat in May and June, and Z. latifolia fell down by heavy rain in July, whereas the C. virosa population located on the floating mat was relatively safe. In the case of PC (Fig. 3d), Scirpus radicans (coverage of 51?96%) dominated a broad area inside the fence, and a few C. virosa (coverage of 2?18%) were distributed sparsely. C. virosa population size was very small at DG even though it has been protected and managed with an artificial water supply. S. radicans (coverage of > 90%), dropwort, and several C. virosa were found at the DG site in June.
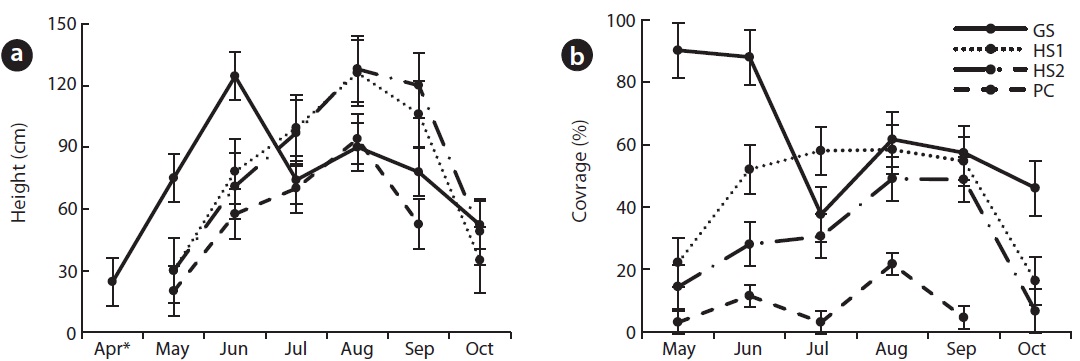
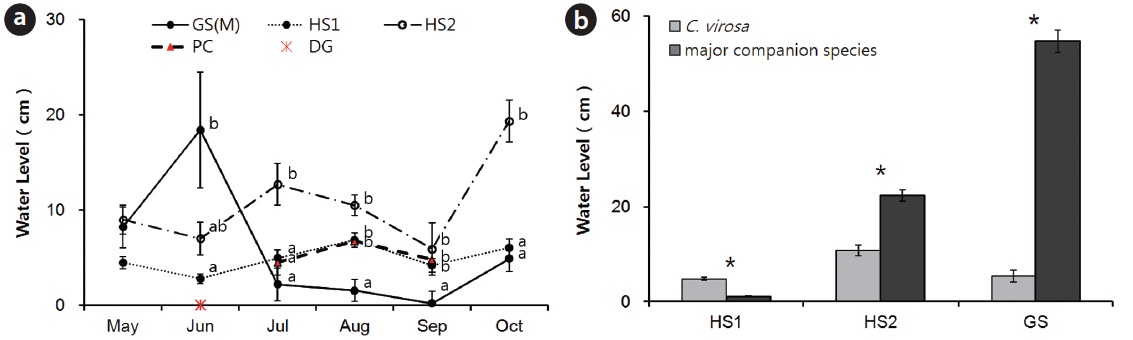
C. virosa flowered in June at GS, in July at PC and in August at HS1, 2. During the blooming season, average height was 125 ± 9.6 cm at GS, 126 ± 22 cm at HS1, 128 ± 21.8 cm at HS2 and 70 ± 7.1 cm at PC (Fig. 4a). HS2, where tall P. japonica co-occurred, showed the greatest height. Particularly at GS, flowering adults fell down in June and juveniles grew up to an average height of 90 cm and showed a second growth peak in August. Blooming and withering at PC, where temperature was low and altitude was high, occurred 1 month earlier than those at HS. A few flower stalks were broken in July at PC; thus, we could not exactly measure height and coverage.
Coverage increased with growth and decreased after flowering (Fig. 4b). GS, where the climate was mild, showed earlier shoot sprouting than that of other species, so coverage in spring was up to 90%.
Seasonal changes and a significant difference among habitats in water level from substrate C.virosa rooted in were observed except in May (Fig. 5a) because of a high volume inflow at GS in June and heavy rain at HS in summer. We could not measure water level or collect water samples at PC in May and June due to the low subsurface water level. The water level at the C. virosa population was significantly different from that at the major companion species mono-population sites (P. thunbergii at HS1, P. japonica at HS2, and Z. latifolia at GS) in each habitat (Fig. 5b).
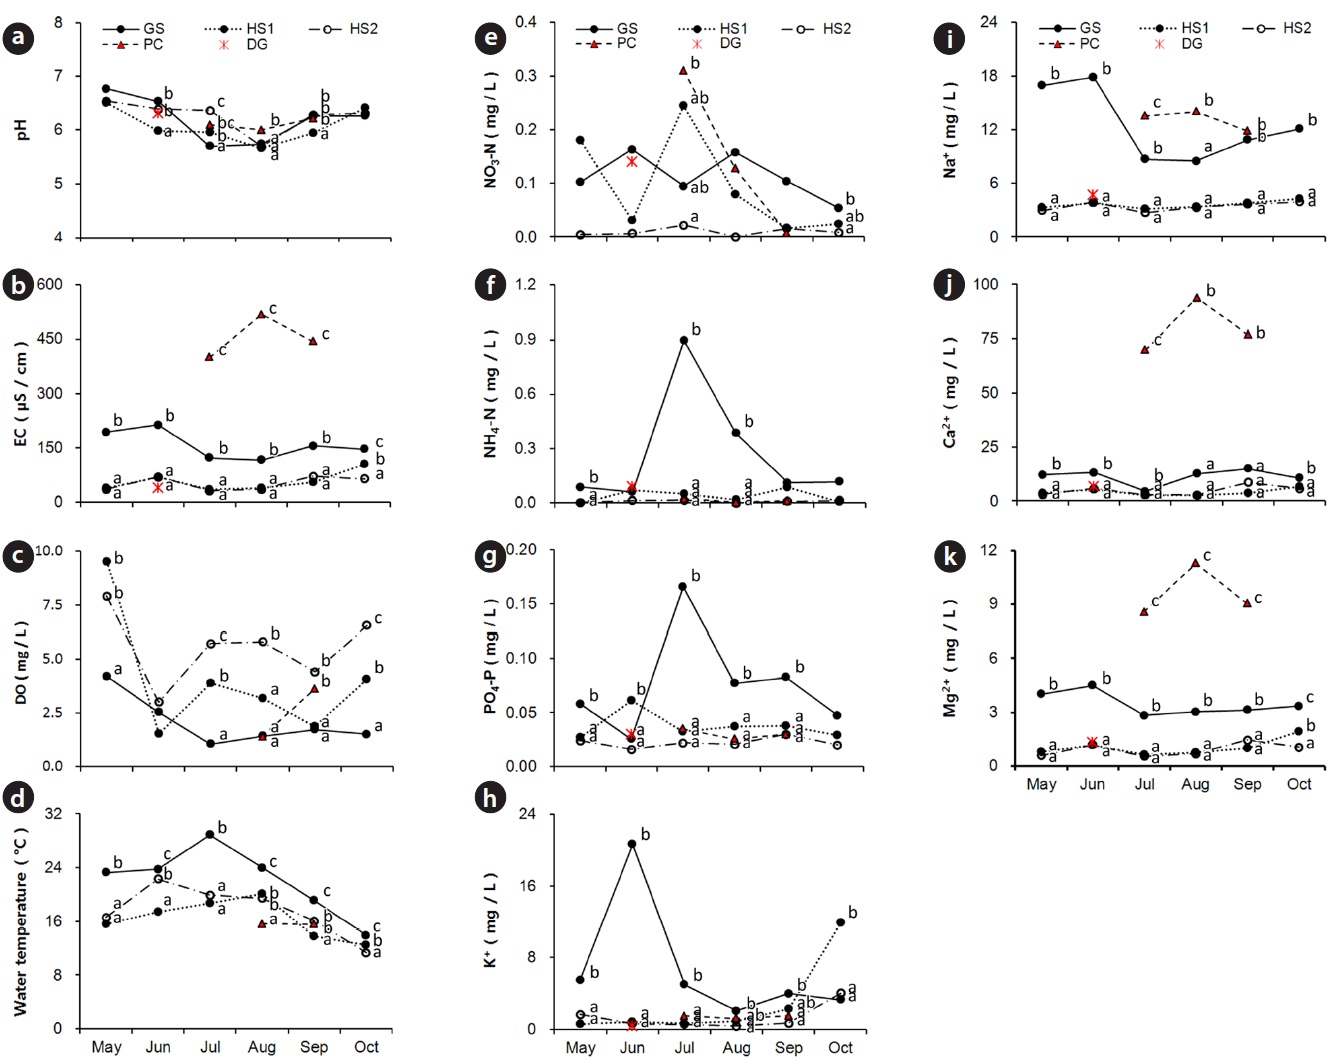
The water in all habitats was neutral or slightly acidic and mean pH was very similar (Fig. 6a). The EC range at HS1, 2 and GS was very wide from 23.4 to 250.0 μS/cm and higher in spring and fall (dry season) than that in summer (Fig. 6b). But the EC values at PC (279.0?764.0 μS/cm) were far higher than those at other sites. The dissolved oxygen concentration in water was highest at HS2 in lotic water with a mean value of 5.7 mg/kg (Fig. 6c). In contrast, water temperature was lowest at HS2, and its year-round range was narrow. The highest water temperature was recorded at GS with low DO values (Fig. 6d).
The NO3-N, NH4-N, and PO4-P contents were low at HS throughout the entire growing season (Fig. 6e?g). The seasonal pattern of change in NO3-N, NH4-N, and PO4-P contents at GS was different from that at the other sites. K+ and Na+ concentrations were highest at GS with wide seasonal variations (Fig. 6h, i). But, the concentration of divalent cations at PC was excessively high such as the EC values (Fig. 6j, k). NO3-N, NH4-N, and PO4-P contents at DG were similar to the levels at GS, and cation concentrations and EC values at DG were similar to those at HS in June. Water environmental properties at the major companion species mono-populations were within the C. virosa population range at each site except water level.
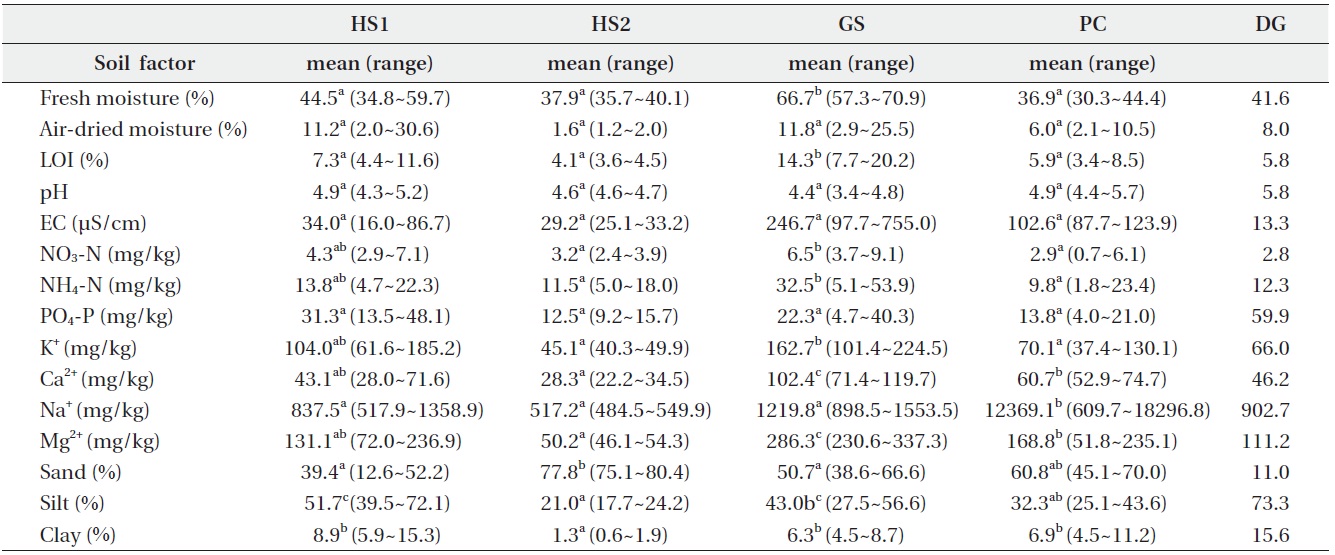
The common soil textures were silty loam and sandy loam. Soil was mostly sandy at HS2 and mostly silty at HS1 (Table 2). Average fresh moisture and air-dried moisture contents were 50.2 ± 13.9% and 10.7 ± 8.5%, respectively. Fresh moisture content was significantly higher at GS than that at the other sites. The soil was acidic with a mean pH of 4.7. Organic matter content, EC, and PO4-P concentration were similar at the four sites. However, soil at DG was less acidic and had a lower EC value and higher PO4-P concentrations than those at the other sites. Concentrations of NO3-N, NH4-N, K+, Ca2+ and Mg2+ at GS were significantly higher than those at the other sites, but the concentration of Na+ at PC was ten times higher than that at GS. Soil properties at major companion species mono-populations were within the C. virosa population range at each site.
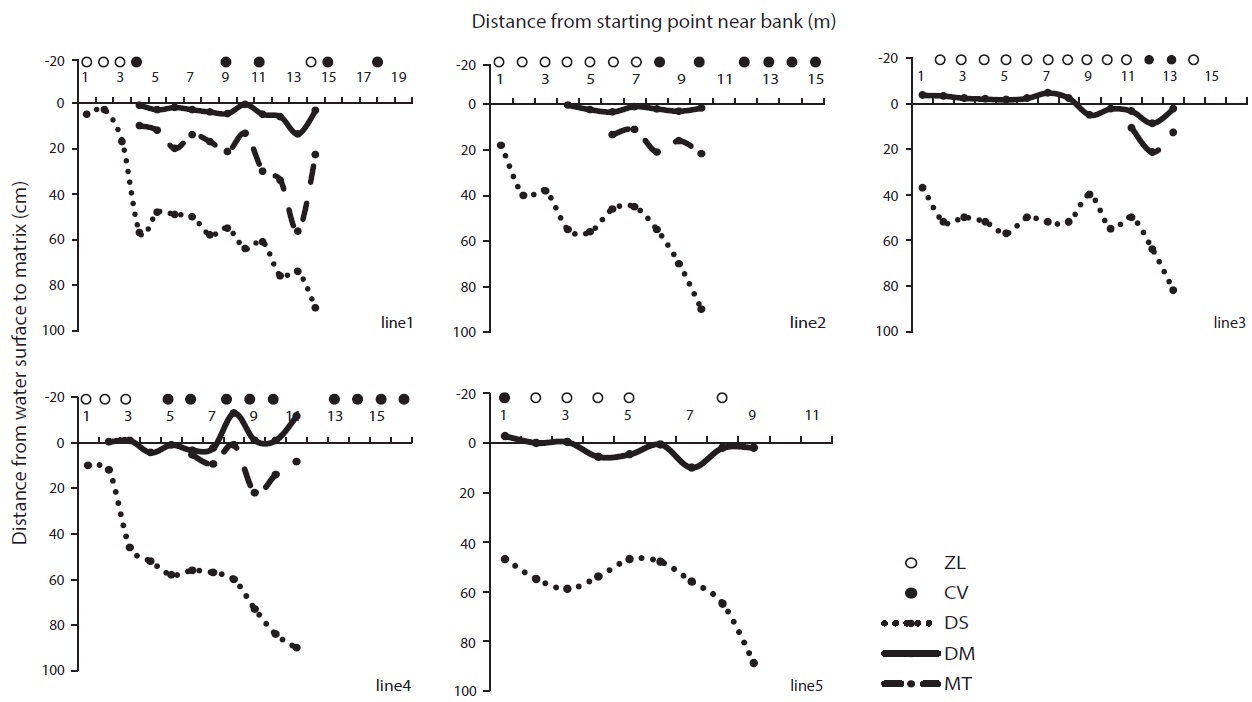
Because GS is a deep reservoir and C. virosa was growing on floating mats, we made additional water depth profiles at intervals of 1 m on line transects from a start point near the bank to 1 m of water depth (Fig. 7). C. virosa was mainly distributed on the floating mat and extended to an inaccessible region that was deeper than 1 m, whereas Z. latifolia did not. There was loose and sunken mat on the fifth line; hence, water-hemlock was distributed only in the shallow water region near the bank.
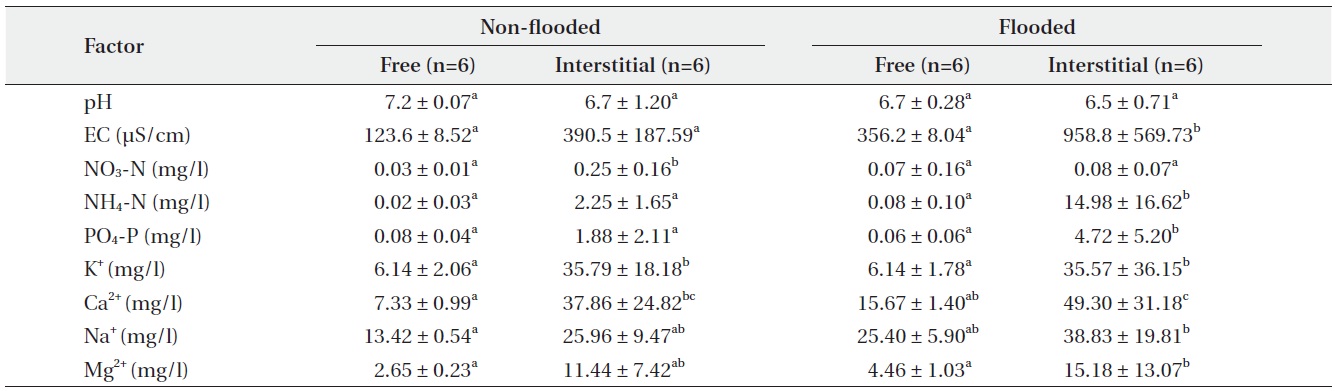
Organic matter content of the mat, as a C. virosa substrate at GS, was 86.8 ± 9.2% under a non-flooded condition on April 30 and 77.9 ± 5.1% under inundation on June 20. Interstitial mat water had a significantly higher EC value and concentrations of NO3-N, NH4-N, PO4-P, K+, Na+, Ca2+, and Mg2+ than free water around the mat. All values in June were higher than those in April except NO3-N content (Table 3). NO3-N content was highest in the interstitial mat water in April. pH values were slightly lower in interstitial mat water, but the difference was not significant.
Based on the water chemistry of some typical natural wetlands (Kadlec and Knight 1996), water chemical properties in C. virosa habitats were general level except two factors. First, the range and seasonal change of NH4-N
and PO4-P contents at GS were abnormal. This may have resulted from stream-flow input from a surrounding rice field and a rubbish heap and mat decomposition under high temperature. Second, concentration of divalent cations at PC also deviated from typical value. PC area included a pasture near a road and received a great amount of snowfall every winter. CaCl2 salt could have caused the high Ca2+ content in water at PC.
Soil was a little acidic and similar at four habitats except at DG. C. virosa primarily lives on grey-wooded and podzolic soils with peat in northern Canada (Mulligan and Munro 1980). Our results support these observations, but an evaluation of the effect of the excessive Na+ concentration in soil and the high Ca2+ content in water at PC to C. virosa distribution is needed additionally.
In mat system of GS, almost all ion concentrations in the interstitial mat water were higher than those in the free surface water in July than those in April. But, NO3-N content was higher in April under the non-flooded condition than that in July, because the redox potential decreased under the flooded condition (Haraguchi 1991). Water chemistry and redox potential of a floating mat is affected by water regime (Haraguchi 2004).
Synthetically, total distribution ranges of water and soil chemical environment for C. virosa were wide and overlapped with the optimal environmental range of distribution for typical hydrophytes such as Z. latifolia, Typha augustifolia (Kwonet al. 2006), Scirpus tabernaemontani (Lee et al. 2007), and Juncus effuses (Yoon et al. 2011). Water and soil chemical properties at C. virosa population were not different from those at major companion species mono-populations at each site.
The distribution of adult wetland plants can be determined by a single environmental gradient such as water depth (Spence 1982, Coops et al. 2004, Lee et al. 2005), because changes in water depth are associated with changes in a variety of environmental factors (e.g., light, soil nutrients, soil particle size, gas exchange rates) that physiologically constrain species distribution (Spence 1982, Keddy 1983). In addition, each species can be expected to have its own water depth tolerance (Spence 1967, Seabloom et al. 1998) and plant communities are more likely to respond to the history of water level than the water level at a particular time of a survey (Roberts 1994, Tabacchi 1995). This means that water level and competitive interactions with accompanying species under seasonal changes in water depth are important factors for the distribution and population size of hydrophytes.
We determined that there were meaningful differences between water levels of C. virosa populations and major accompanying species mono-populations (P. thunbergii at HS1, P. japonica at HS2, Z. latifolia at GS) (Fig. 5b). A mound shaped surface that was modified by P. japonica may change its micro-environment and affect reproductive success of other species (Byun et al. 2008, Hong et al. 2012). The P. japonica hummock offered a low water level for C. virosa at HS2, which consisted of a 30 cm deep streamlet. Floating mats rise and fall with changes in local water level and support stands of emergent vascular vegetation (Sasser et al. 1991). Mat made of live and dead roots and non-decomposing parts of plants like P. distichum and Z. latifolia provided shallow water level at GS, a 1m depth reservoir and shelter from strong competition with a prolific accompanying species, Z. latifolia and disturbance by flooding in summer. Water depth for the distribution of adult C. virosa was defined as 7 ± 3.5 cm, which was the mean water depth value at three habitats (HS1, HS2, and GS) through the entire growing season. A study reported that C. virosa lives on sand in 0?20 cm water levels with light over 12,000 lux on Mt. Baekdu in China (Kim and Lee 2003).
The abundance of C. virosa within its native range has been diminished where water courses and marshes have been diverted, filled, or drained (Mulligan and Munro 1980, this study). Vegetation studies have often revealed significant declines in area and/or species richness of shore vegetation after water regime alterations (Nilsson and Keddy 1988, Shay et al. 1999, Nishihiro et al. 2004, this study). In Japan, the major reason for the extinction of wild plants and decreases in their number is exploitation of wetlands (Jeon 1999). The population size of C. virosa was diminished at PC and DG where the water regime was changed due to fragmentation by road construction and isolation by a protection fence. There was a water shortage in May and June at PC and a need for an artificial water supply from the near mountain at DG. Monthly water levels from substrate C.virosa rooted in changed and were significantly different at the four sites because of different water regime. But, water levels in May were not different among habitats where C. virosa population sizes were large, and average water level was 7.2 ± 2.4 cm (Fig. 5a). The spring season is a very important period for regeneration and distribution of C. virosa considering its life history (Fig. 4). C. virosa sprouted earlier than other plants and flowered in July at PC.
Dispersal strategy of water hemlock is floating and spreading through water flooding in spring (Mulligan and Munro 1980, Panter et al. 1988); hence, sufficient water level could be a factor determining C. virosa distribution. Water hemlock forms overwintering rootstocks from buds around the base of the current year’s rootstock in the fall. These may keep the plant afloat and serve to spread plants during spring flooding. The seeds, which are surrounded by a spongy fruit coat, are also buoyant (Mulligan and Munro 1980).
As a result, proper water level is a very important factor determining C. virosa distribution and dispersal, and the low water level in spring was considered a reason that the C. virosa population has decreased at PC and DG. We could propose connecting with corridor that C. virosa could use to disperse through and maintaining a high water level to preserve and restore C. virosa habitats. Here, the GS habitat could be a good model for C. virosa conservation in a warm temperate region.
C. virosa habitats were distinguished by comparison based on climate, wetland type, community structure, water and substrate properties and water regime. HS1 had a 0?5 cm water depth abandoned rice field in high montane areas with emerging P. thunbergii, and its ion concentrations and EC were in the midrange and relatively constant. HS2 had a 10?15 cm water depth streamlet in high montane areas with P. japonica and its ion concentrations and EC were relatively poor and constant. GS was 0?10 cm water depth (to mat surface) a deep reservoir where floating mat developed at low altitudes and in a warm area. The main companion species was Z. latifolia and its ion concentrations and EC were relatively rich and seasonally highly variable. PC was dominated by S. radicans and has excessive high EC value in water and high Na+ contents in soil with the low water level in spring in high montane area.
The total distribution ranges of the water and soil chemical environments for C. virosa were wide and overlapped with the optimal environmental range of distribution for accompanying species. However, the optimal water level range for C. virosa distribution and dispersal could be defined. This optimum water level was adjusted by substrate structure such as a mound of P. japonica and a floating mat comprised of accompanying species. A floating mat at GS was an aid to maintain an optimal and stable water level in deep or fluctuating water and to prevent strong competition with prolific macrophytes. The GS, which had floating mats, could be a good model for C. virosa conservation in a warm temperate region, whereas the PC, which experienced a water shortage in spring, provided a clue about the decline in C. virosa population size.