Isotropic pitch fibers were stabilized and carbonized for preparing carbon fibers. To optimize the duration and temperature during the stabilization process, a thermogravimetric analysis was conducted. Stabilized fibers were carbonized at 1000, 1500, and 2000℃ in a furnace under a nitrogen atmosphere. An elemental analysis confirmed that the carbon content increased with an increase in the carbonization temperature. Although short graphitic-like layers were observed with carbon fibers heat-treated at 1500 and 2000℃, Raman spectroscopy and X-ray diffraction revealed no significant effect of the carbonization temperature on the crystalline structure of the carbon fibers, indicating the limit of developing an ordered structure of isotropic pitch-based carbon fibers. The electrical conductivity of the carbonized fiber reached 3.9 × 10⁴ S/m with the carbonization temperature increasing to 2000℃ using a four-point method.
Carbon fiber (CF) is considered to be a useful reinforcement for composites due to its excellent properties, such as its high modulus, dimensional stability, and excellent thermal and electrical conductivities [1-5]. Therefore, CF has received a considerable amount of attention in variety of specialized applications in the fields of sporting goods, aircraft, aerospace, wind energy, and in the automotive industry [6]. CF can be classified into three types depending on the precursor: polyacrylonitrile-based CF, rayon-based CF and pitch-based CF. Pitch-based CFs can be further classified into two types. One is high-performance CF from mesophase pitch, which exhibits liquid crystalline behavior and requires a process which converts coal tar or petroleum residue oil to mesophase-grade pitch. The processes described in the literature for obtaining mesophase pitch include the polymerization of aromatic hydrocarbons using aluminum chloride as a catalyst [7], the supercritical fluid extraction of petroleum pitch [8], and high-temperature centrifugation [9]. The other type is general purpose CF from isotropic pitch, which shows more modest properties [10,11]. However, isotropic pitch is an attractive precursor for CF, as it can be manufactured at a reasonable cost.
It is well known that the stabilization process plays an extremely important role in manufacturing CF [12]. As-spun pitch fibers require an additional treatment to make them suitable for subsequent carbonization. Isotropic pitch has a lower degree of condensation, a high hydrogen content and a lower softening point, all of which result in more time needed to form an oxygen bridge structure via oxidation, dehydrogenation, cross-linking and cyclization during a stabilization process, where small molecules such as H2O, CO, and CO2 can be evaporated [12,13]. However, over-oxidation will produce a brittle product with poor tensile properties due to the formation of quinones, which can produce CO during the heat treatment [13].
In this work, stabilization and carbonization of melt-spun isotropic pitch fibers are studied. The thermal behavior of pitch fibers during the stabilization process is observed by thermal gravimetric analysis (TGA). Subsequently, stabilized fibers are carbonized at temperatures of 1000, 1500, and 2000℃. After the carbonization step, Raman spectroscopy, X-ray diffraction (XRD), and transmission electron microscopy (TEM) are used to observe the effect of the carbonization temperature on the structural evolution of CFs.
Synthesized pitch was prepared from naphtha cracking bottom oil by a halogen-derived polymerization procedure consisting of the bromination of raw material, debrominated condensation and subsequent thermal treatment/distillation [14]. A thermal treatment with distillation was adjusted until the desired softening point was reached (~268℃). Pitch fibers were prepared using the resulting isotropic pitch as a precursor. The pitch was melt-spun in a stainless steel barrel, and the diameters of the spinneret and winder were 500 μm and 260 mm, respectively. The spinning temperatures were 300 to 310℃, which were 30 to 40℃ above the softening point of the pitch. Once the spinning temperature was optimized, extrusion pressure of 5 bar with nitrogen at a winding speed of 300 rpm was used to obtain pitch fibers.
2.2. Preparation of the pitch-based CF
The as-spun fibers were stabilized at 270℃ for 2 h under an air atmosphere in a convection oven. After stabilization, the fibers were carbonized at 1000, 1500, and 2000℃ under a nitrogen atmosphere at a heating rate of 5℃ /min in a furnace. The heat-treated fibers naturally cooled down to room temperature after they reached the maximum temperature.
TGA was used to obtain the optimum stabilization temperature and time in an air atmosphere with a heating rate of 5℃ /min using a TGA Q50 (TA instruments, USA). After reaching a certain temperature, samples were held at least 8 h. The weight of each sample used for the test was approximately 10 mg.
Raman spectroscopy was performed using a Raman spectrometer with a power of 16 mW and a 633 nm diode laser (Horiba Jobin Yvon, France). Spectra were obtained with a range from 500 to 3500 cm-1 in continuous scanning mode. The XRD patterns of all samples were obtained using a X-ray diffractometer (D/MAX 2500, Rigaku) with Cu Kα radiation (λ = 0.15418 nm) to analyze the crystalline structure of the CFs and calculate the interlayer spacing. XRD was operated at a voltage of 40 kV and an emission current of 50 mA with a scanning speed 2°/min. The interlayer spacing (
d 002 = λ / 2sinθ,
where λ is the wavelength of the radiation,
TEM (JEM2200FS, USA) was carried out at an accelerating voltage of 200 kV to observe the graphitic structure of the CFs. The CFs were embedded in epoxy resin and then microtomed with a thickness of less than 100 nm. Samples were collected on a carbon grid to be observed by TEM. Field-emission scanning electron microcopy (FE-SEM, Hitachi S-4700) was performed at an acceleration voltage of 10 kV to examine the cross-sections of the samples. An average diameter of the CFs was obtained from at least twenty SEM micrographs. Elemental analysis (Flash EA 1112 series, Thermo Fisher Scientific) was carried out in order to determine the effect of the carbonization temperature on the amounts of C, H, N, O and S. A four-probe point method was used to measure the electrical conductivity of a single fiber with a resistivity meter (FPP-RS8, Dasol Eng., Korea). The average taken from five samples was reported, and T-300, a commercial PAN-based CF, was utilized as a reference to confirm the accuracy of the measurement.
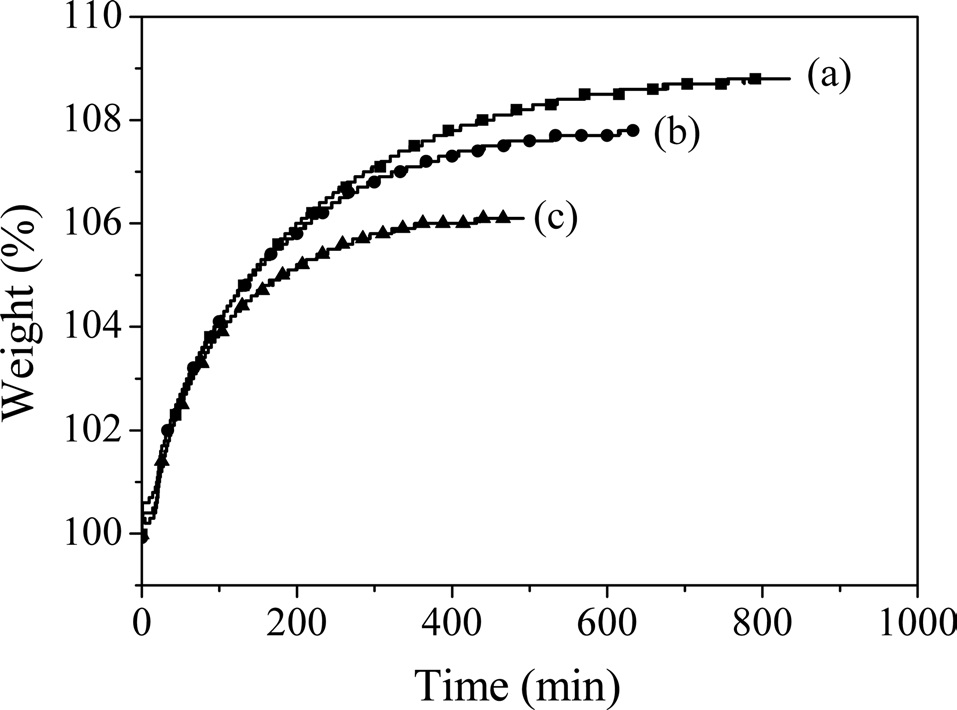
Fig. 1 shows TGA thermograms of the as-spun fibers at various holding temperatures. The weight of the samples increased with an increase in the heating time, and a temperature of 270℃ led to the highest weight gain (~8.8 wt%) due to oxidation. This crosslinking reaction helped the fibers maintain their shape, allowing them to be carbonized in the following process
without inter-filament fusing. From Fig. 1, the rates of increase of the weight of the as-spun fibers stabilized at 280 and 290 were lower than those at 270℃ due to differences between the amount of oxygen uptake and the evaporation of materials with low boiling points. Therefore, the weights gained by fibers tested at 280 or 290℃ for the given times were lower than the gains by the fibers tested at 270℃. Because stabilization is one of the most costly steps when producing CF, it is necessary to reduce the time for stabilization [16]. As noted by Stevens and Diefendrof [17], a typical mesophase fiber requires an increase of 6% in its mass for adequate stabilization. Therefore, from the TGA results, the as-spun fibers were stabilized in a convection oven at 270℃ for 2 h. The resulting fibers were carbonized at 1000, 1500, and 2000℃ in a furnace under a N2 atmosphere.
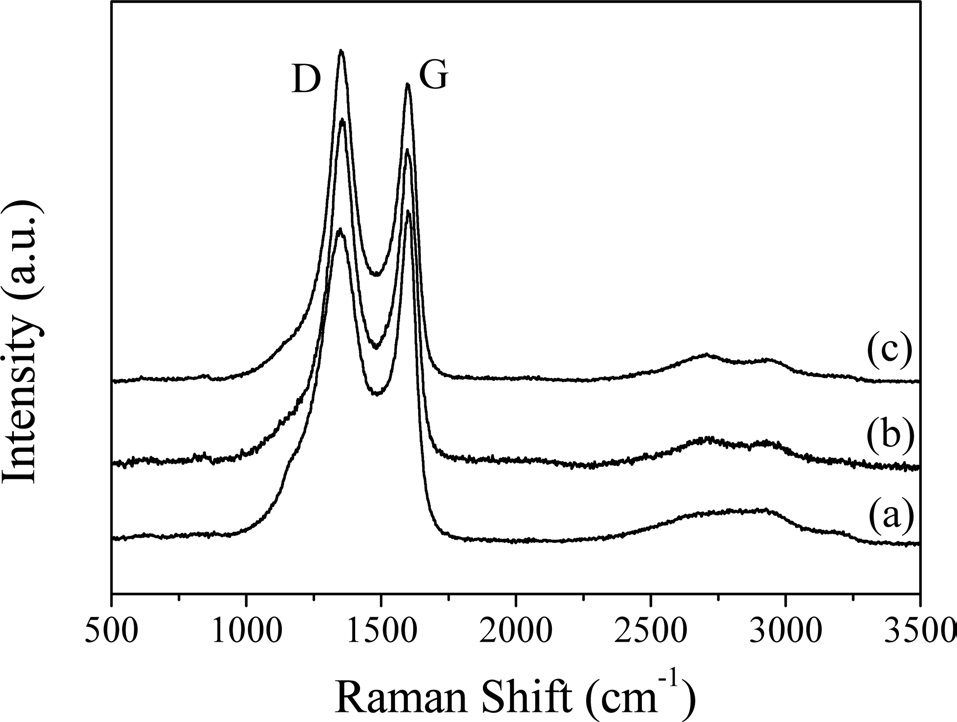
Raman spectroscopy has been confirmed to be a powerful method for characterizing carbonaceous materials [18-20]. The Raman spectra of CFs with various carbonization temperatures are shown in Fig. 2. For all CFs, the spectra showed two characteristic bands around 1356 and 1599 cm-1, termed the D and G band, respectively. The D band stems from the disordered structures or defects in the carbon, and the G band is associated with tangential stretching vibrations of the C-C bonds [21,22]. Even with CF heat-treated at 2000℃, a broad D band was distinct, indicating that the CF had a disordered structure, which could also be observed from the XRD diffractograms.
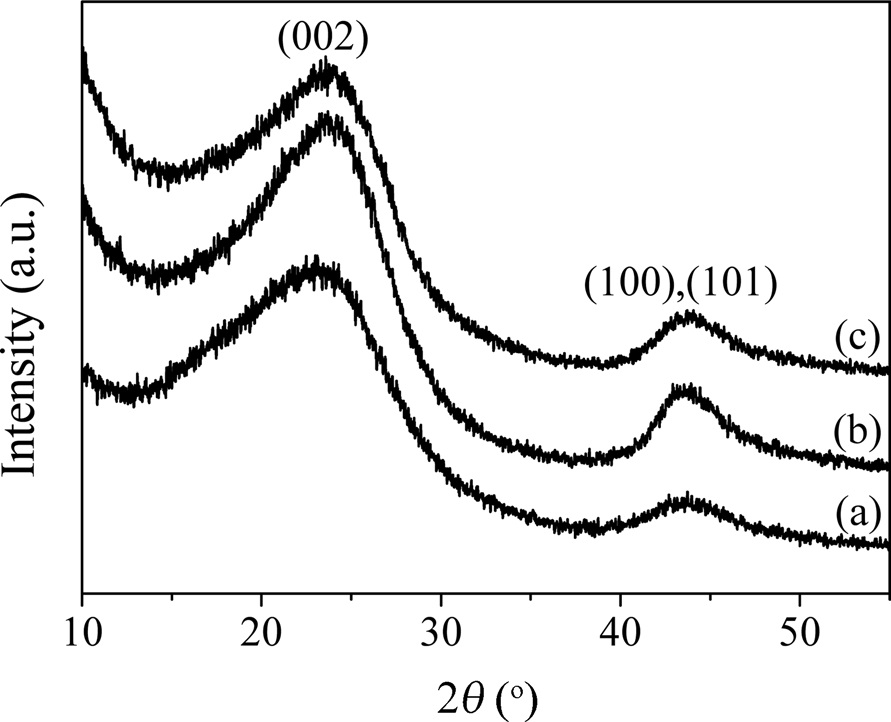
Fig. 3 shows XRD diffractograms of CFs at different temperatures. Two peaks were obvious regardless of the carbonization temperature. The former diffraction peak corresponded to the (002) reflection of the pseudo-graphite structure. According to Bragg’s law, the interlayer spacing of CFs, whose 2
0.373 nm due to the structural development. However, there was no further change as the carbonization temperature increased to 2000℃, which is related to the low degree of crystallinity of the CFs. The latter one showed a combination of (100) and (101) planes, which are usually assigned to the turbostratic bands of disordered carbon materials [23].
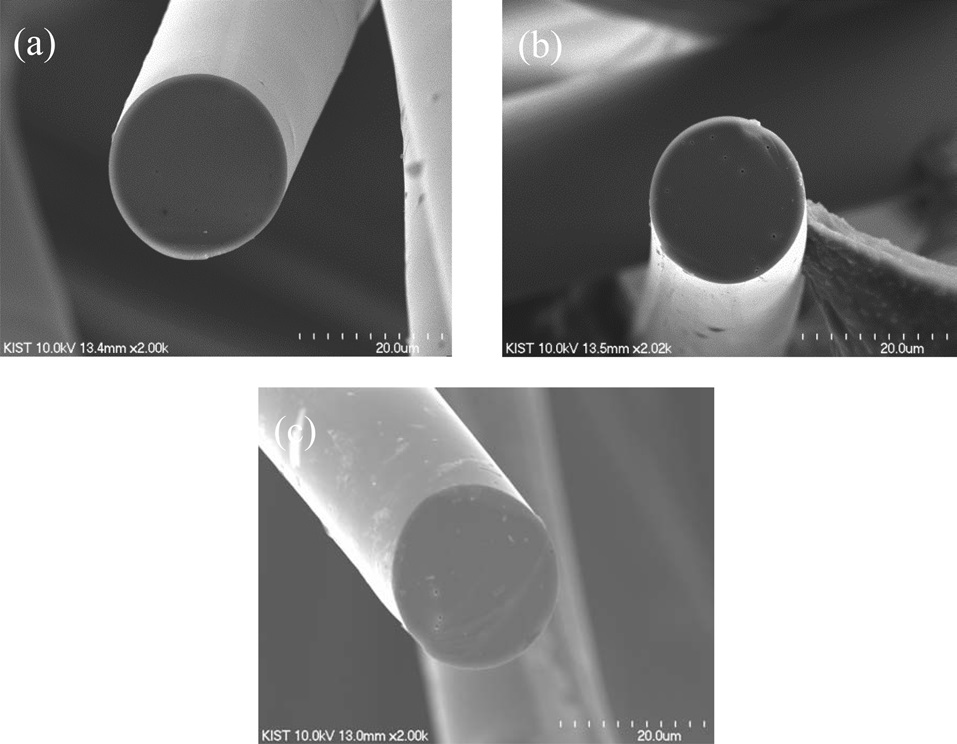
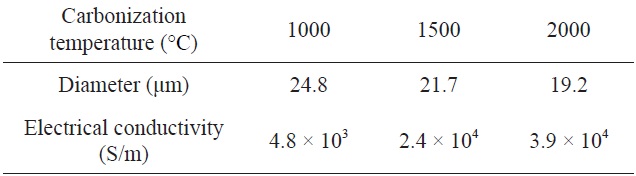
SEM images of CFs are shown in Fig. 4. Each shows a smooth texture, which differs from the typical radial texture of anisotropic pitch-based CFs [24]. The diameter of each CF is summarized in Table 1. As expected, diameters of the CFs decreased with an increase in the carbonization temperature. The diameters of the CFs decreased from 24.8 to 19.2 μm as the carbonization temperature increased from 1000 to 2000℃ because hetero-atoms of H, N, and O were released and because structure was developed during the carbonization process [25]. However, a significant microstructure was not observed in the SEM images of the CFs independent of the carbonization conditions.

Diameters and electrical conductivities of carbon fibers at various carbonization temperatures
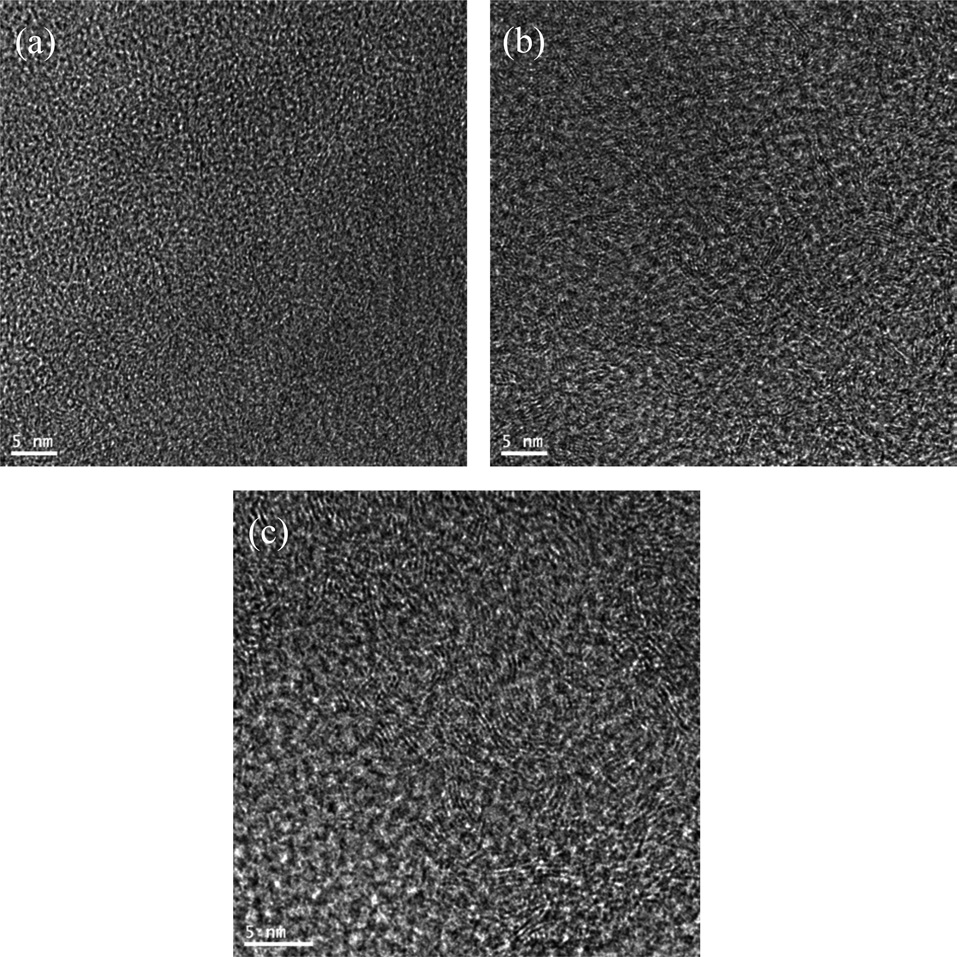
TEM micrographs of CFs processed at a carbonization temperature of 1000, 1500, and 2000℃ are displayed in Figs. 5a-c, respectively, to observe their structures. Upon a heat-treatment temperature at 1000℃, two to three layers of distorted columns approximately 2 nm long are shown in Fig. 5a. In Fig. 5b, the number of the layers is increased to nearly 10 and the length of the column increased to 10 nm with a heat-treatment temperature of 1500℃ as they became more aligned [26,27]. However, there was no clear change in the structure when the heat-treatment temperature of 2000℃ due to the structural development limit. This was in good agreement with the Raman and XRD results.
The electrical conductivities of the CFs are displayed in Table 1. As shown in Table 1, there was no notable difference between the measurement value of T-300 (Toray, Japan) and the value provided by the manufacturer, which confirmed the accuracy of the measurement. The conductivity of CF increased from 4.8 × 10³ to 2.4 × 10⁴ S/m with an increase in the carbonization temperature from 1000 to 1500℃ due to the development of
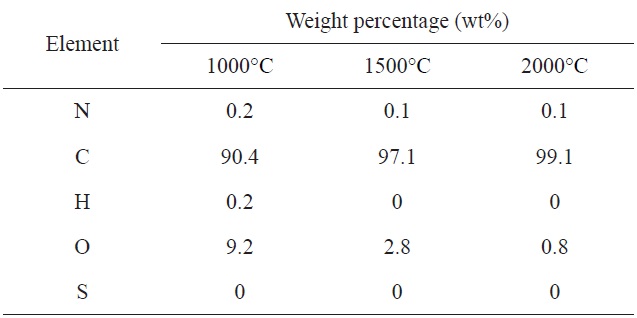
[Table 2.] Element analysis of carbon fibers at various carbonization temperatures

Element analysis of carbon fibers at various carbonization temperatures
the structure to facilitate the movement of electrons, as also observed in the TEM images. The electrical conductivity of the sample carbonized at a high temperature of 2000℃ was 3.9 × 10⁴ S/m, which was similar to the result at 1500℃ owing to the structural development limit.
The results of the element analysis corresponding to different carbonization temperatures are shown in Table 2. It was obvious that the concentrations of oxygen, nitrogen and hydrogen decreased with an increase in the carbonization temperature, as hetero-atoms were continuously released to form a turbostratic structure [28]. There was already no sulfur left when the carbonization temperature was 1000℃, indicating that sulfur may be removed in the form of SO2 at an early stage of carbonization [13]. Hydrogen and nitrogen were assumed to be removed primarily in the forms of N2, H2O, H2 and low-molecular alkanes during the carbonization process [13,29]. The concentration of oxygen significantly decreased from 9.2 to 2.8 wt% when the heat-treatment temperature increased to 1500℃ due to the continuous evaporation of H2O, CO2, and CO. Over 1500℃, it was assumed that oxygen was also released in the form of O2 in addition to the above cases [13]. Finally, the carbon concentration reached 99.1 wt% when the carbonization temperature reached 2000℃.
Isotropic pitch-based CFs were obtained via a stabilization and carbonization process. TGA was used to observe weight changes during the stabilization of the as-spun fibers. The graphitic- like structure of CFs was studied by Raman spectroscopy and XRD. In the Raman spectra, broad D and G bands were observed regardless of the carbonization temperature. (002), (100), and (101) diffraction peaks in the XRD diffractograms were assigned to the turbostratic disordered structure. The (002) peak was broad with CF heat-treated at 2000℃ due to the low degree of crystallinity. The electrical conductivities of the CFs increased with an increase in the carbonization temperature. The values were found to range from 4.8 × 10³ to 2.4 × 10⁴ S/m at carbonization temperatures of 1000 to 1500℃. However, there was no significant difference in the electrical conductivity with a further increase in the carbonization temperature due to structural development limits, as observed by TEM.