There is widespread interest, discussion, and exploration globally regarding school improvement in one form or another. One of the often cited reasons for educational change is the need to prepare the young for participation in new economic and work environments, where the basis of employment is more flexible and the required skills tend to be higher order, more diverse, and continually changing. Today it is seen that academic skills and intelligences alone are not sufficient to cope up with the global competition. In the field of Library and Information Science (LIS), the possession of skills and competencies are needed which demand that students shall behave properly in their learning and working environments. It has been established that LIS professionals should possess a quality of psychological aspects as a built in capability of the profession. Hence multiple intelligences become mandatory coupled with proper behaviour, which in turn refers to behavioral psychology. Behaviour is a manner of behaving or conducting oneself. Condi-tioning, reinforcement, and punishment are key concepts used by behaviorists.
The profiles of behavioral traits are as follows (Friedman and Rosenman, 1959; McAdams, 1996; Vazquez-Carrasco and Foxall, 2006; Wright, 1996):
* Accommodating - concern for group accountability
* Assertiveness - a measure of generalized self acceptance and confidence
* Attitude - related to stability and poise
* Decisiveness - associated with taking control as well as self - acceptance
* Energy Level - a tendency toward restlessness, activity, and drive
* Independence - individual preference rather than being directed by others
* Manageability - social responsibility and stability
* Objective Judgment - a sense of rational competence and objectivity
* Sociability - a measure of social presence and self-confidence
Stogdill (1948) and Mann (1959) reported that many earlier studies on traits attempted to identify personality characteristics that appear to differentiate one from the other. More recently people have tried looking at what combinations of traits might be good for a particular situation. There is some mileage in this. It appears possible to link clusters of personality traits to success in different situations (Wright, 1996).
McAdams (1996) suggests that personality traits, which deal with temporal and situationally invariant personal characteristics, distinguish different individuals and lead to consistencies in behavior across situations and over time. The service industries are always associated with direct personal contact such as personality, temperament, and other internal factors (Feng and Zhang, 2009).
There are no studies reported in the context of LIS students and hence this study bridges the gap. In this paper an attempt has been made to study the behavioral traits of Library and Information Science (LIS) students and to categorize them based on ‘Work environment,’ ‘Natural environment,’ and ‘Social environment.’ The study has been carried out with the following objectives:
* To identify the Behavioral traits of ‘Work Environment,’ ‘Natural Environment,’ and ‘Social Environment’ among Library and Information Science students in South India.
* To identify the differences in behavioral traits between male and female Students in Library and Information Science.
* To compare the behavioral traits of the students of Library and Information Science in different geographical environments.
This study sought views on behavioural traits of master’s degree students in Library and Information Science in various universities of Southern India. For this purpose a structured questionnaire was administrated among all 400 LIS students (Population) of LIS schools spread through four southern States namely Tamil Nadu, Andhra Pradesh, Karnataka, Kerala, and one Union Territory, Pondicherry. The survey is based on the census method. There are about 400 master’s students studying in the states of Southern India and the survey has been given to the entire population. Out of 400 questionnaires distributed, 367 have responded and the response rate is 91.75%.
The data collected from the respondents were analysed using the SPSS software package. The background information of the respondents is presented in Table 1.
Out of 367 respondents, 58.04% are male and 41.96% are female. 71.39% of respondents are in the age group of below 25 years, 24.52% are in the age group of between 25 and 29 years and 4.09% are above 29 years. The largest number of respondents is from Karnataka (36.51%), followed by Andhra Pradesh (27.79%), Tamil Nadu (23.71%), and Kerala (10.64%). The lowest number of respondents (1.36%) belong to Pondicherry since there are only 5 PG students
[Table 1.] Demographic Background Information about the Respondents
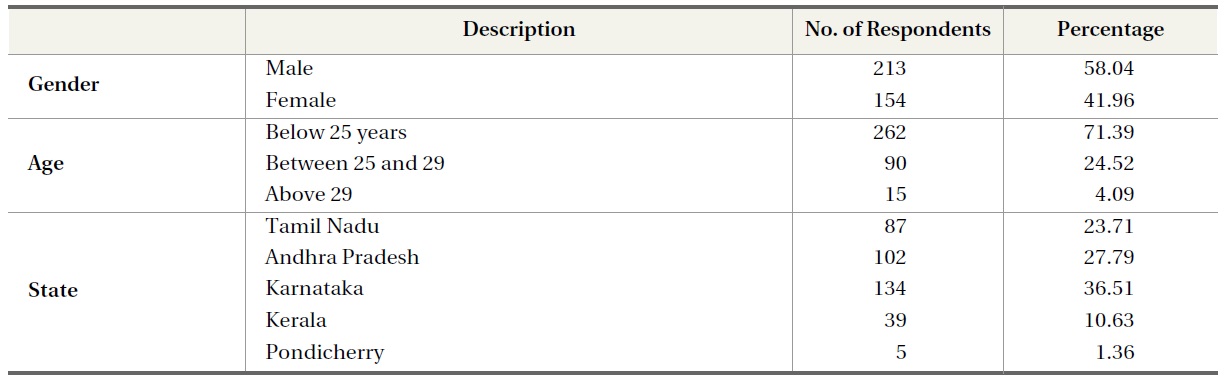
Demographic Background Information about the Respondents
[Table 2.] University-wise Distribution of Respondents
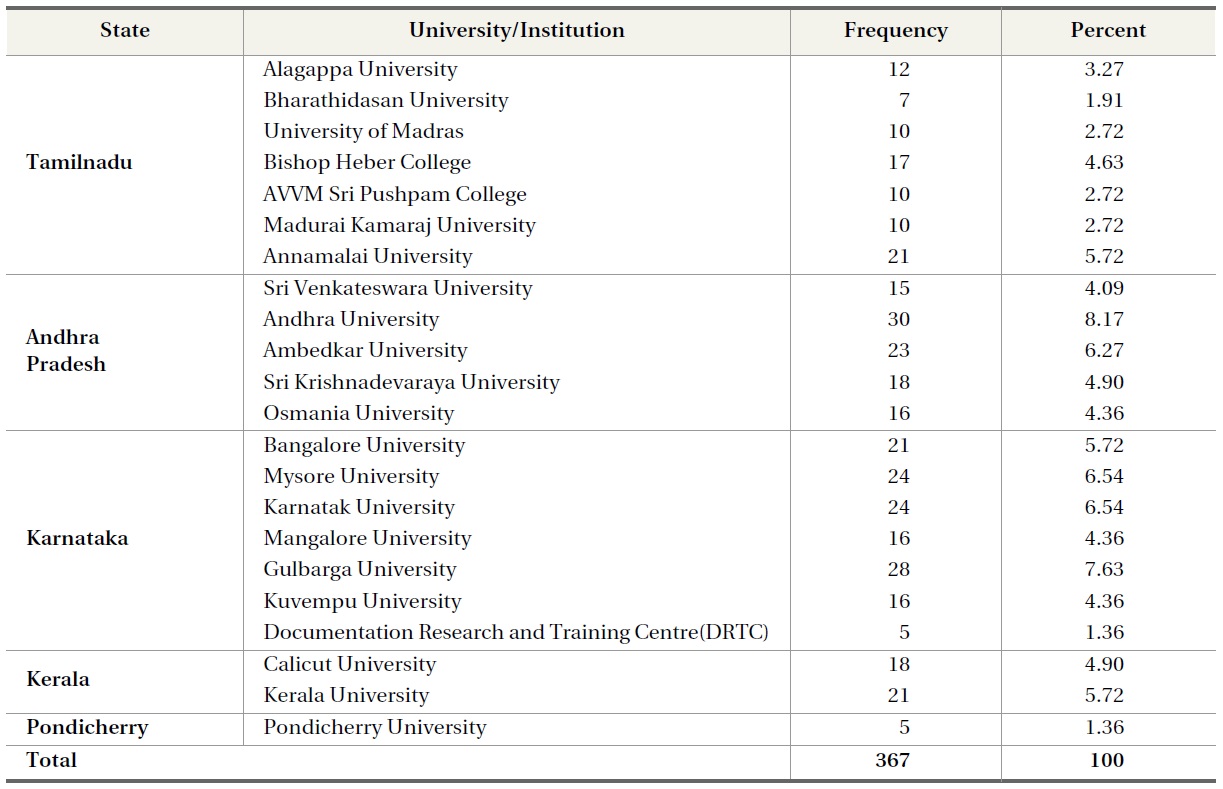
University-wise Distribution of Respondents
studying in that university at the time of the survey.
The university-wise distribution of respondents is shown in Table 2.
A total of 22 LIS Schools are listed in four southern states, including one Union Territory. Out of these there are 7 each in Tamil Nadu and Karnataka, followed by 5 in Andhra Pradesh.
3. RESEARCH ANALYSIS: BEHAVIOR TRAITS OF LIS STUDENTS
Friedman and Rosenman (1959) first propounded the A/B type of behavioural pattern to describe certain kinds of individuals who, they believed, tended to be overrepresented as clients in their clinical practice. Based on their study, this paper examined the behavioral traits of LIS students in South India and categorized them under three different environments, namely ‘work environment,’ ‘nature environment,’ and ‘social environment.’ The work environment group has been described as working in the office, the nature environment is described as naturally/habitually showing attitudes irrespective of the environment, and the social environment is described in regard to attitudes toward the society.
In this study the behaviour traits of the LIS students has been examined in three environments stated above and the number of variables taken up under each are:
* Work Environment - 16 variables
* Natural Environment - 16 variables
* Social Environment - 27 variables
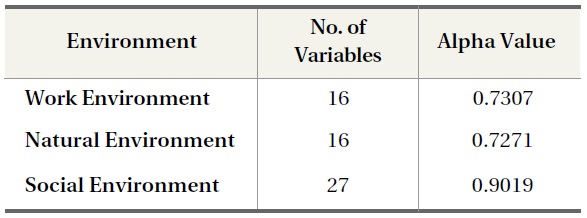
Reliability is concerned with the consistency of a variable. There are two identifiable aspects of this issue: external and internal reliability. Nowadays, the most common method of estimating internal reliability is Cronbach’s alpha (
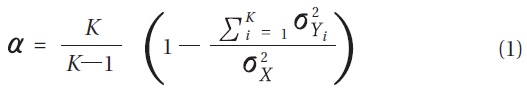
Here K is the number of items; Σ
Commonly accepted rules for describing internal consistency using Cronbach’s alpha (Cronbach, Lee J., and Shavelson R J, 2004) are
Therefore Cronbach’s alpha value has been calculated for the variables taken up for three groups and the same is shown in Table 3.
Reliability Test
The Cronbach alpha value indicates that of all the variables taken up for the study are acceptable.
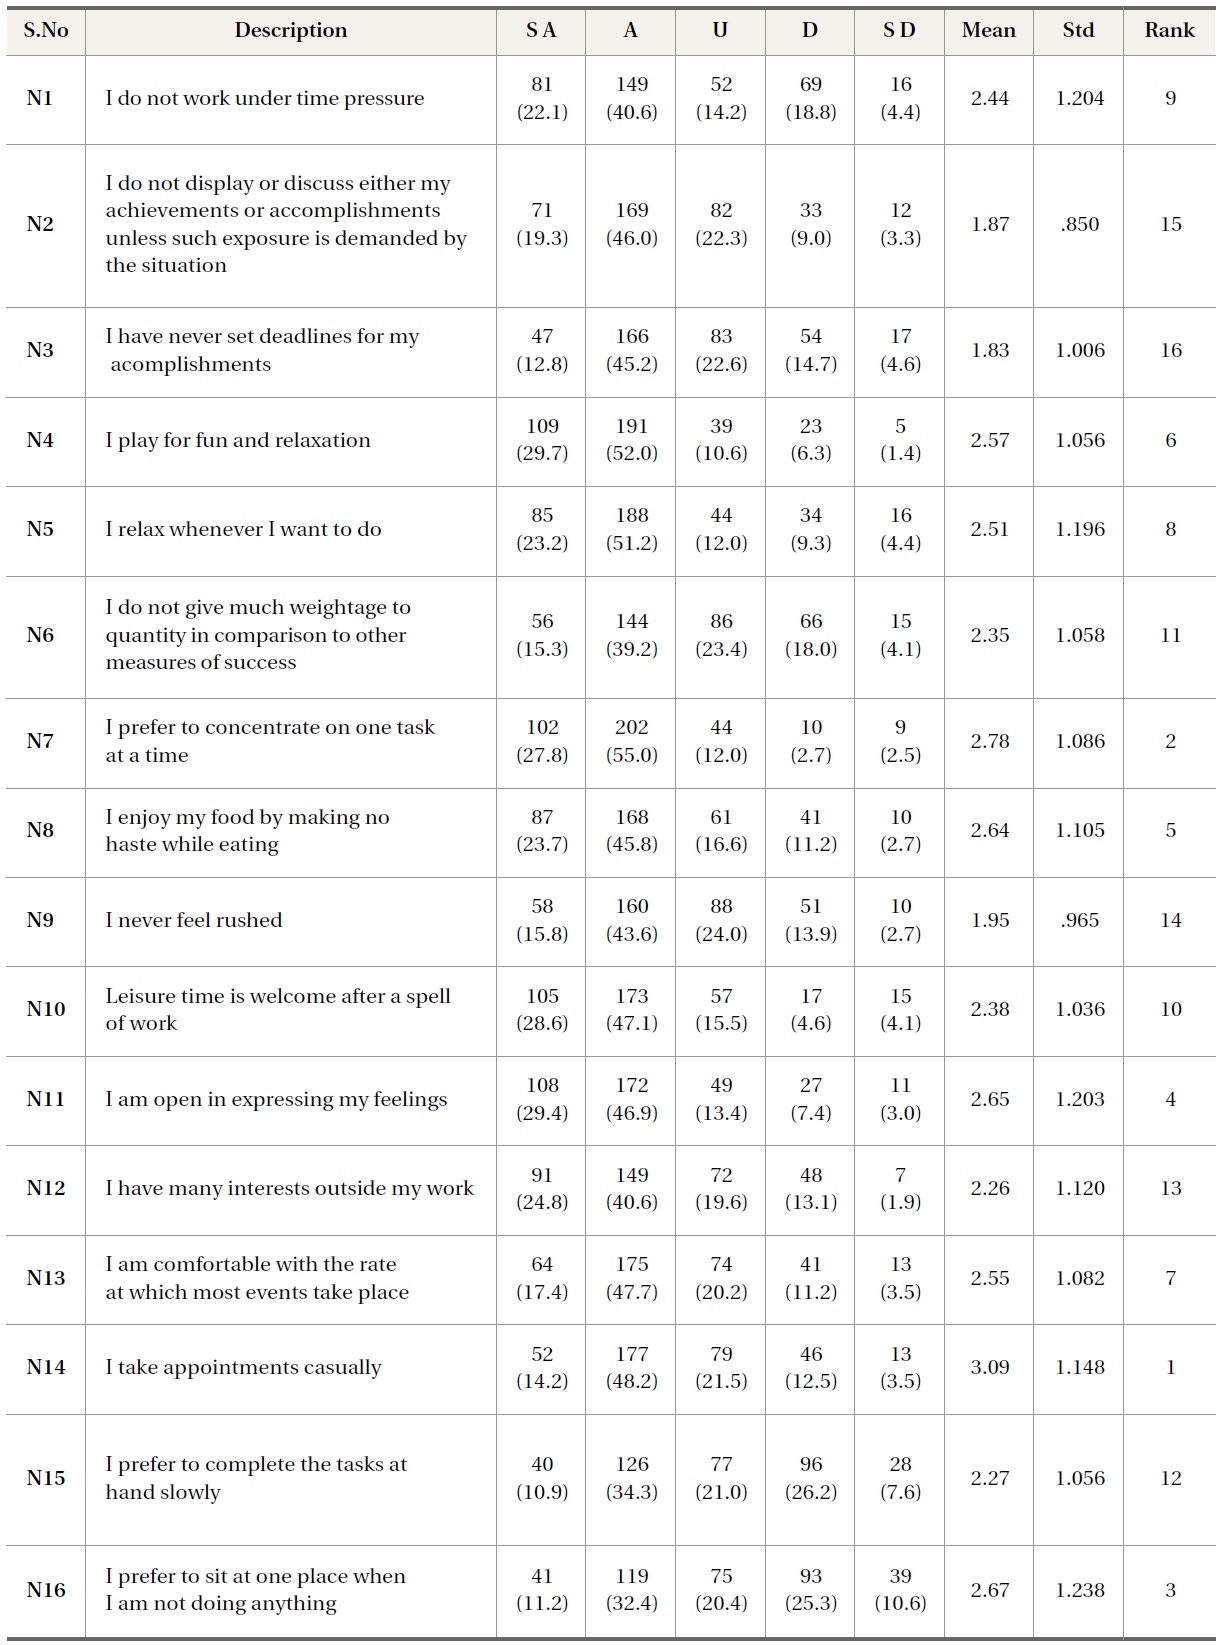
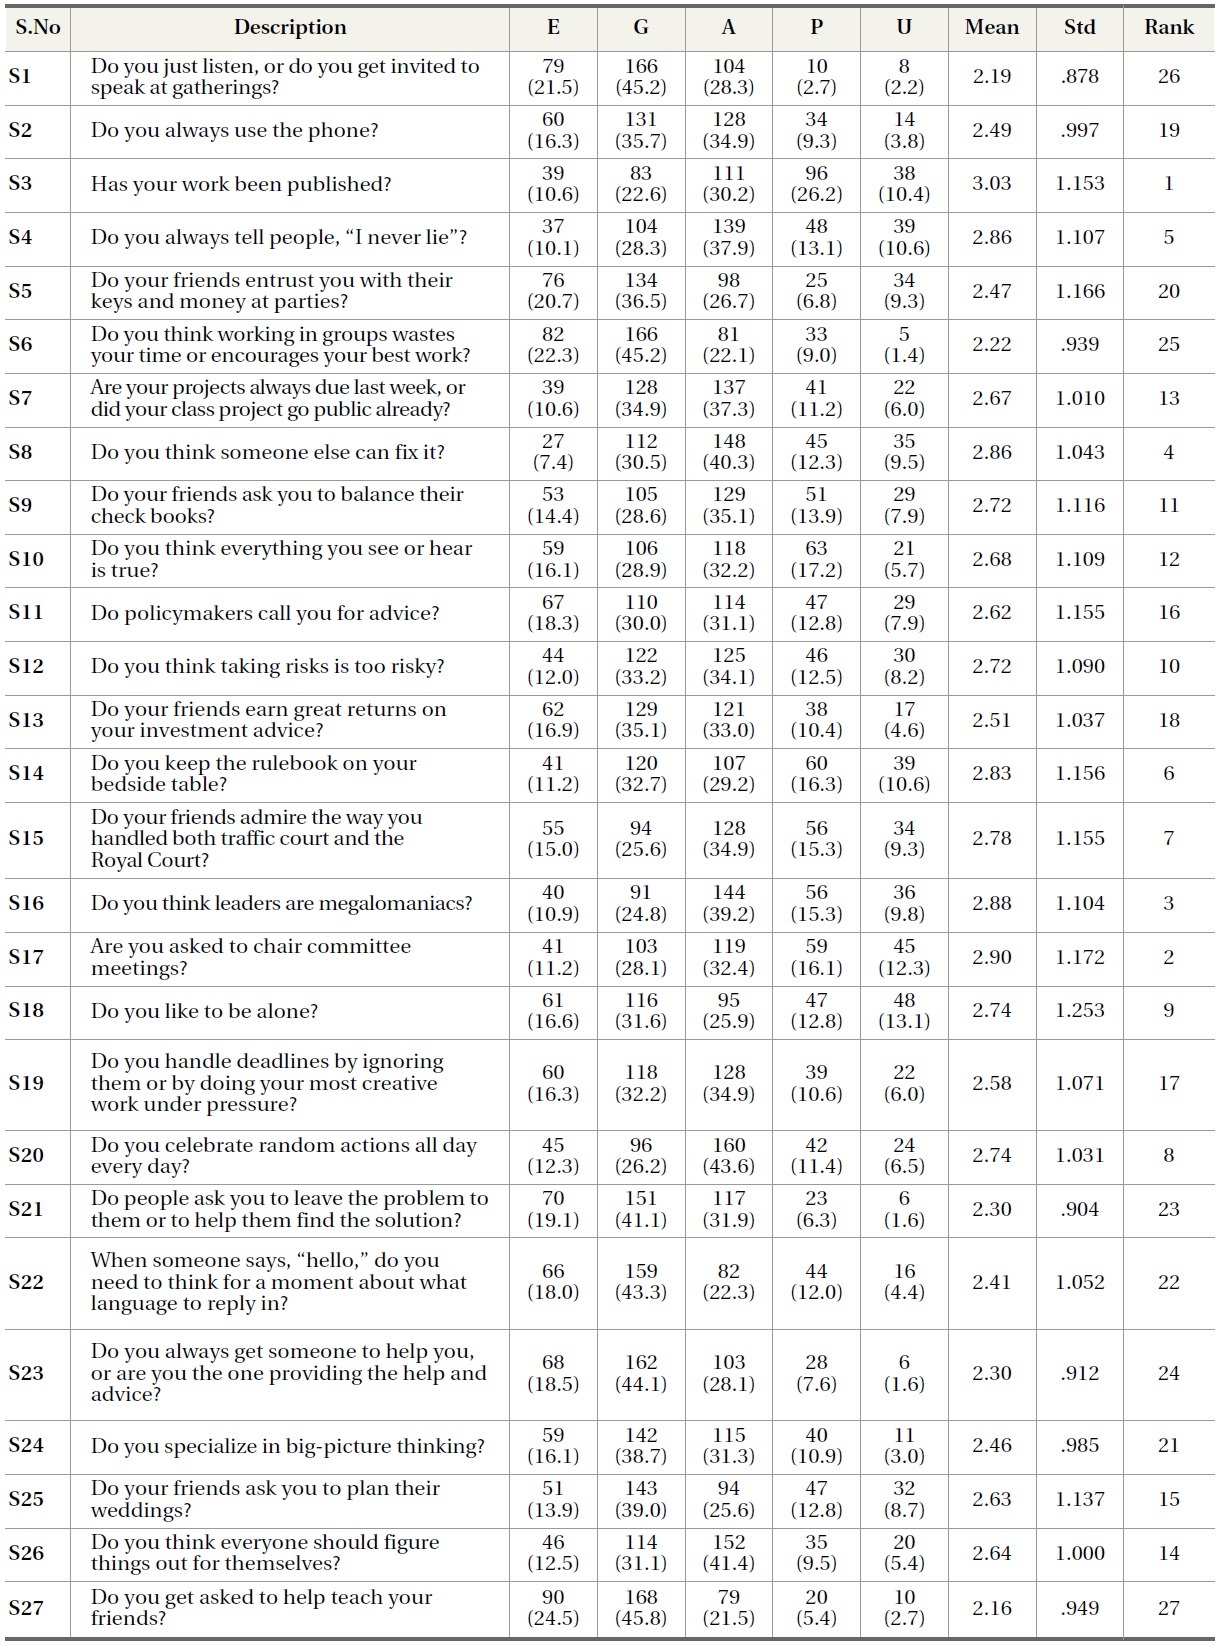
The nature of behaviour is time-bound in the case of work environment. Opinions on 16 variables were taken up in a five point scale such as “strongly agree,” “Agree,” “No opinion,” “Disagree,” and “Strongly Disagree.” The mean and standard deviation were calculated based on the opinions. Further ranks were assigned. The opinions, mean, standard deviation, and rank are shown in Table 4.
The mean value in Table 4 shows that the highest value (4.14) is for “
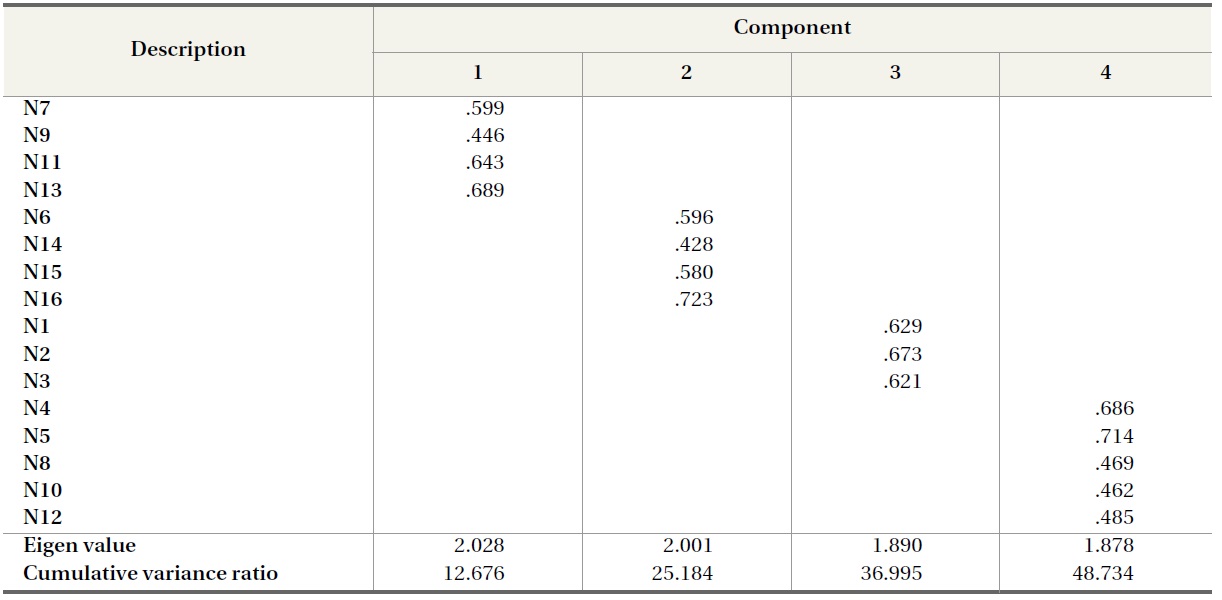
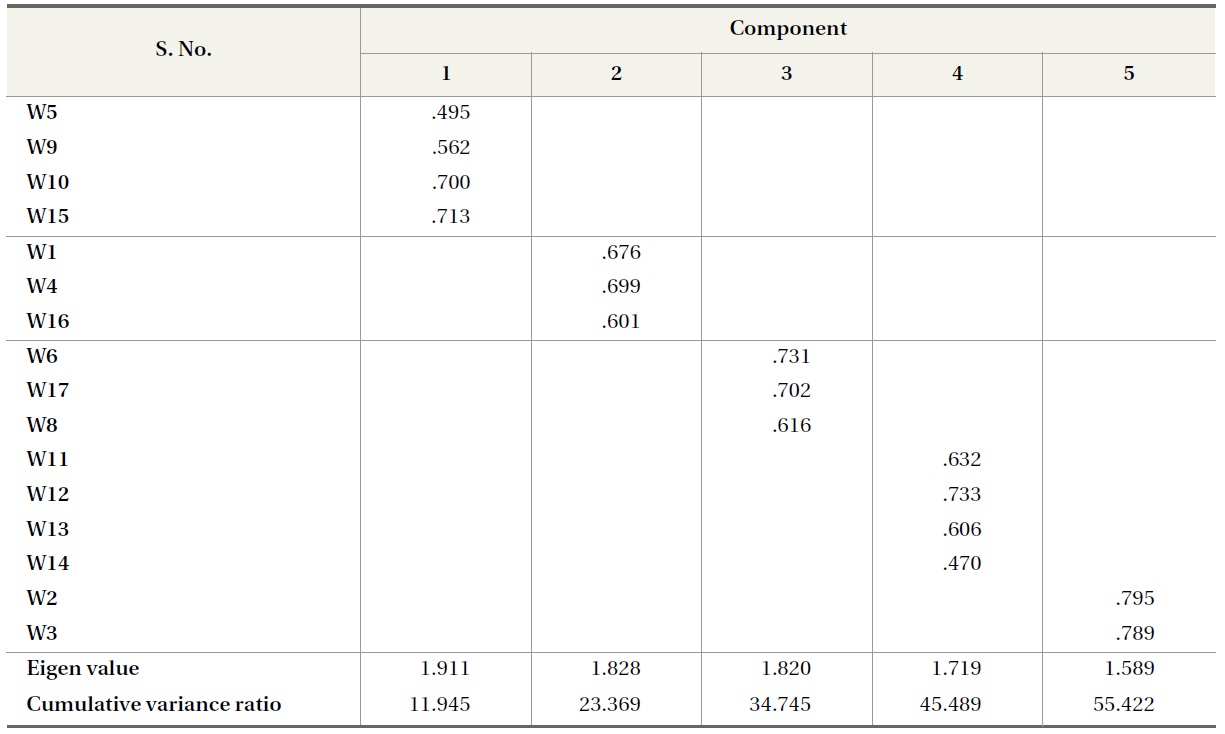
Based on the responses from 367 LIS students for the 16 variables, component factors were administrated. The scores obtained were subjected to factor analysis and five factors have emerged (Table 5).
As can be seen from the table, the variables are grouped into five components. Further Eigen values
[Table 4.] Frequency Data on Behavioural Nature of the Respondents

Frequency Data on Behavioural Nature of the Respondents
for the same have been carried out. It can be seen that only the first five factors have Eigen values greater than 1. ‘1’ was the criterion for retention of a factor, which indicates that only the first five factors are to be extracted. It can be seen that the variances were more evenly distributed in the rotated sum of the squared loading (11.945%, 11.424%, 11.376%, 10.744% and 9.933% respectively; Cumulative variance ratio 55.422%). This indicates that five factors are interpretable.
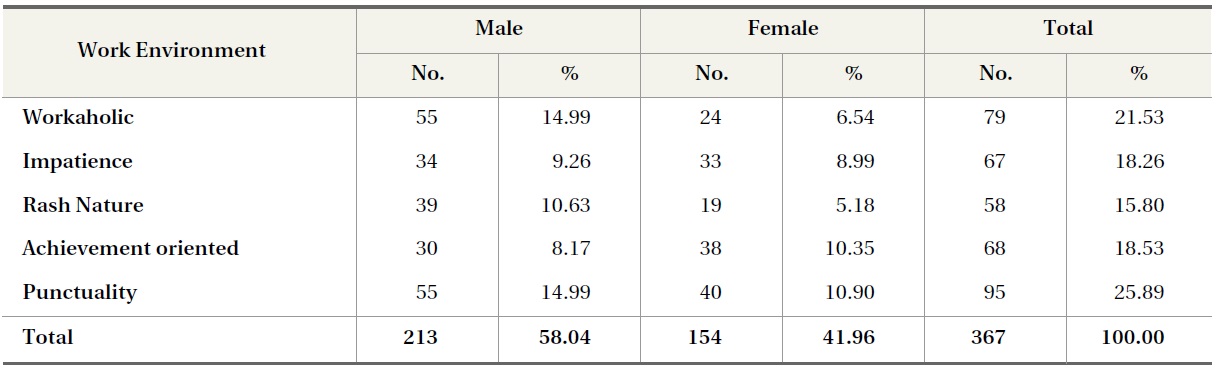
The components were named based on the variable under each component such as Workaholic, Impa-tience, Rash nature, Achievement oriented, and dominating nature. Further, the number of persons and the gender under each component has been identified and the same is shown in Table 6.
[Table 5.] Result of Factor Analysis of Work Environment Variables
Result of Factor Analysis of Work Environment Variables
[Table 6.] Work Environment vs. Gender

Work Environment vs. Gender
It can be seen from Table 6 that the “
From Table 6 it can be observed that ‘
[Table 7.] Work Environment vs. State of Respondents
Work Environment vs. State of Respondents
The state-wise distribution of respondents under work environment is shown in Table 7.
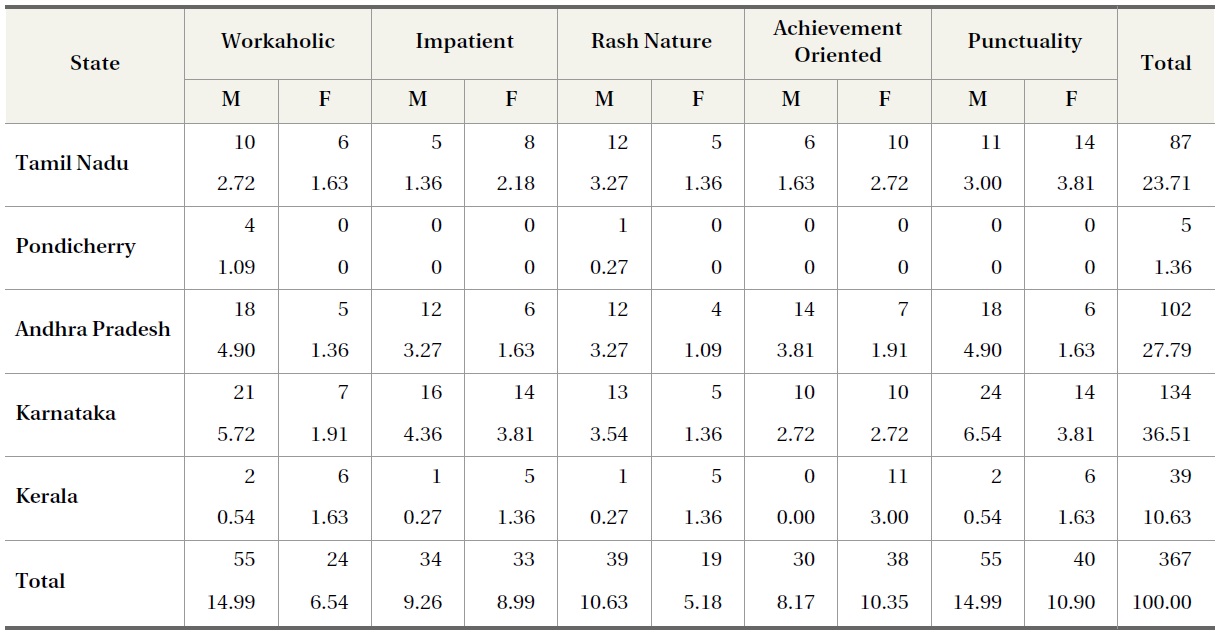
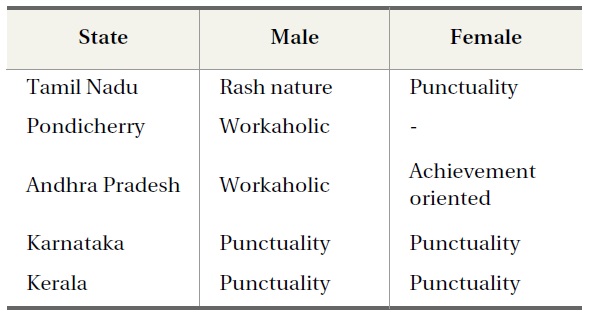
The following skills have been identified as distinguished between genders:
1. In Tamil Nadu, ‘Rash nature’ followed by ‘Punctuality’ are more frequent in males whereas ‘Punctuality’ followed by ‘Achievement oriented’ are priorities among females.
2. In Pondicherry all the respondents are male and all favoured the category of ‘Workaholic’ (1.09%) and ‘Rash nature’ (0.27%).
3. In Andhra Pradesh the male group dominates on ‘Workaholic’ and ‘Punctuality’ (4.9%) equally, followed by ‘Achievement oriented’ (3.81%). However, in females ‘Achievement oriented’ (1.91%) dominates, followed by ‘Punctuality’ (1.63%).
4. In Karnataka males fall under the category of ‘Punctuality’ (6.54%), followed by ‘Workaholic’ (5.72%), whereas ‘Punctuality’ and ‘Impatience’ (3.81%) are equally found among females.
5. In Kerala, the male group falls under ‘Workaholic’ and ‘Punctuality’ (0.54%), followed by ‘Impa-tience’ and ‘Rash nature’ (0.27%), whereas females have ‘Workaholic’ and ‘Punctuality’ (1.63%), followed by ‘Impatience’ and ‘Rash nature’ (1.36%).
From the data in Table 8, the top priority variables for the students can be presented in Table 8.
The sixteen variables thus selected to ascertain the natural environment behavioural traits among LIS professionals has been evaluated. From the factor analysis of obtained scores, four factors emerged and the result is shown in Table 9.
[Table 8.] Work Environment - Top Priority Skills of Students in States vs. Gender
Work Environment - Top Priority Skills of Students in States vs. Gender
[Table 9.] Natural Environment

Natural Environment
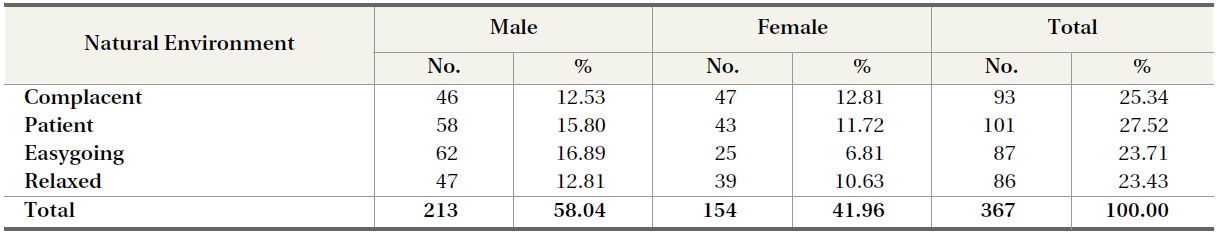
As can be seen from the table, the variables are grouped into four components. Eigen values were calculated for the same variables. The first four factors have Eigen values greater than 1. ‘1’ was the criterion for retention of a factor, which indicates that only the first four factors are to be extracted. It can be seen that the variances were more evenly distributed in the rotated sum of the squared loading (12.676%, 12.508%, 11.811%, and 11.739% respectively; Cumulative variance ratio 48.734%), which shows that the four factors are interpretable. The four components have been extracted and named as Complacent, Patience, Easygoing and Relaxed.
Moreover, the number of respondents and the gender under each component is shown in Table 11. It is seen that individuals under each group are
[Table 10.] Result of Factor Analysis of Natural Environment

Result of Factor Analysis of Natural Environment
[Table 11.] Natural Environment Components vs. Gender
Natural Environment Components vs. Gender
almost evenly distributed ranging from 23.43% to 27.52%. Further, it can be seen that ‘
From Table 11 it can be seen that
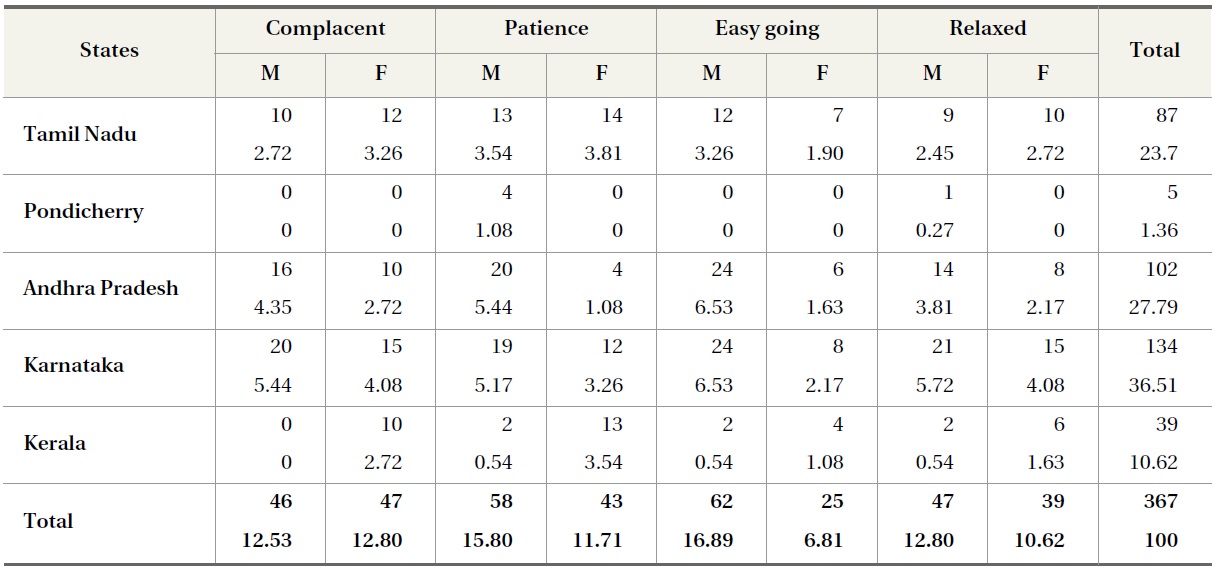
Regarding the skills relating to Natural Environment, the following have been identified among states and gender of the respondents:
1. In Tamil Nadu, “Patience” (3.54%) is followed by “Easygoing” (3.26%) for males. Patient (3.81%) followed by Complacent (3.26%) are strongest among females.
2. In Pondicherry all the respondents are male and all favoured the category of Patience (1.08%) and Relaxed (0.27%).
3. In Andhra Pradesh the male group dominates on Easygoing (6.53%) and Patient (5.44%). This is followed by Complacent (4.35%). Whereas, in females Relaxed (3.81%) is dominant, followed by Complacent (2.72%).
4. In Karnataka males fall under the category of
[Table 12.] Skills on Natural Environment vs. State
Skills on Natural Environment vs. State
[Table 13.] Natural Environment - Top Priority among States vs. Gender

Natural Environment - Top Priority among States vs. Gender
Easygoing (6.53%), followed by Relaxed (5.72%), whereas in females Complacent and Relaxed (4.08%) had equal importance followed by Patience (3.26%).
5. In Kerala the male group falls under the categories of Patience, Easygoing and Relaxed equally (0.54), whereas Patience (3.54%) is strongest, followed by Complacent (2.72%), among females.
From Table 12, the top priority variables of the students are summarised and shown in Table 13.
Similar to that of work environment and natural environment, the behavioural natures of LIS students in the case of Social Environment have been identified by making use of 27 variables (Table 14).
[Table 14.] Social Environment
Social Environment
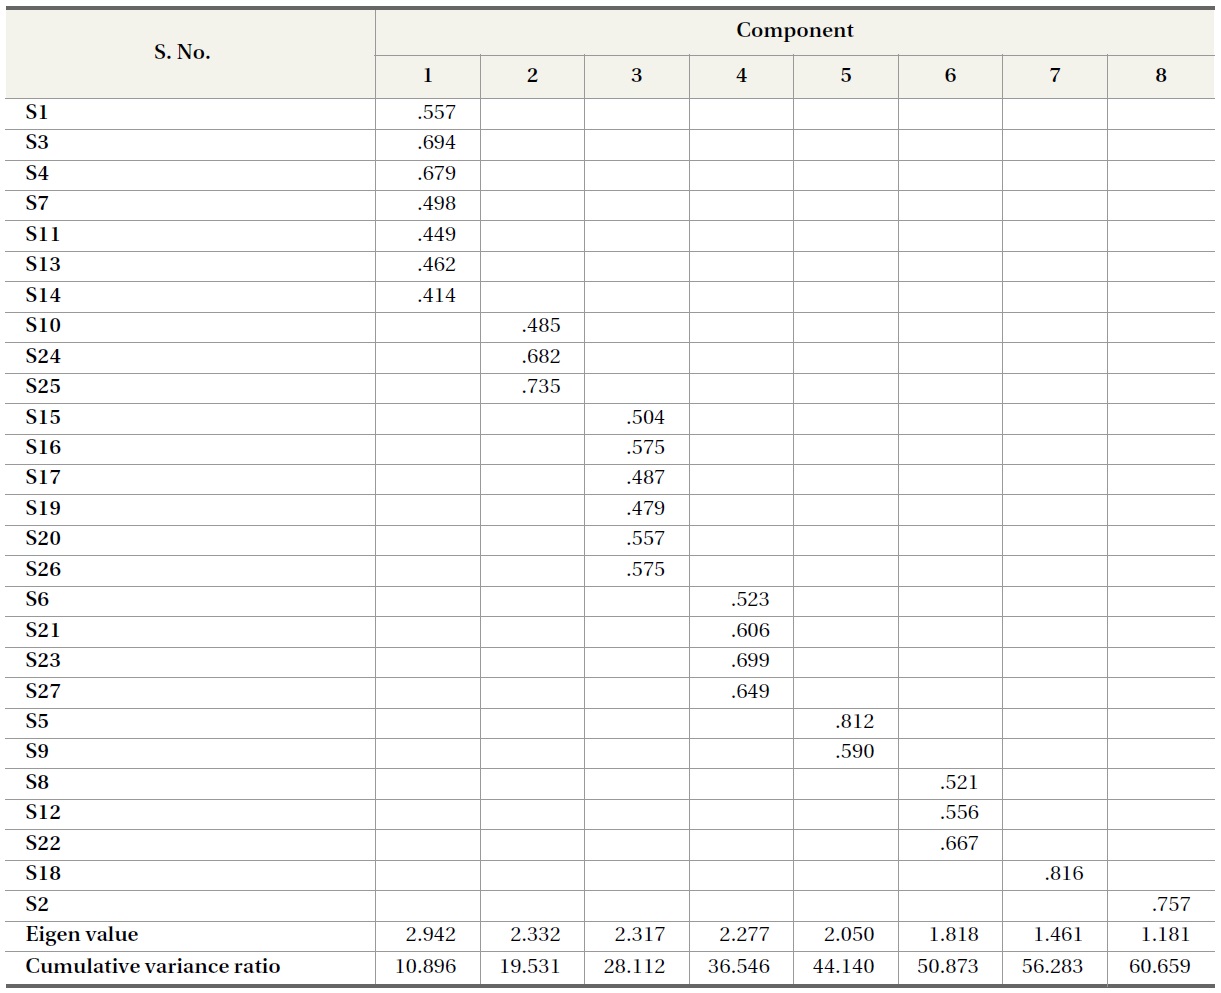
The factor analyses of obtained scores for social environment under a rotated component matrix and eight components which emerged are presented in Table 15.
The Eigen values thus calculated for the above variables are shown in Table 15. It can be seen that only the first eight factors have Eigen values greater than 1. ‘1’ was the criterion for retention of a factor, which indicates that only the first five factors are to be extracted. Even though the variances were not evenly distributed in the rotated sum of the squared loading (percentages ranges between 4.376% and 10.896%; cumulative variance ratio 60.659%), the Eigen values are in ranges between 1.181 and 2.942.
[Table 15.] Result of Factor Analysis of Social Environment
Result of Factor Analysis of Social Environment
This indicates that the eight factors are interpretable.
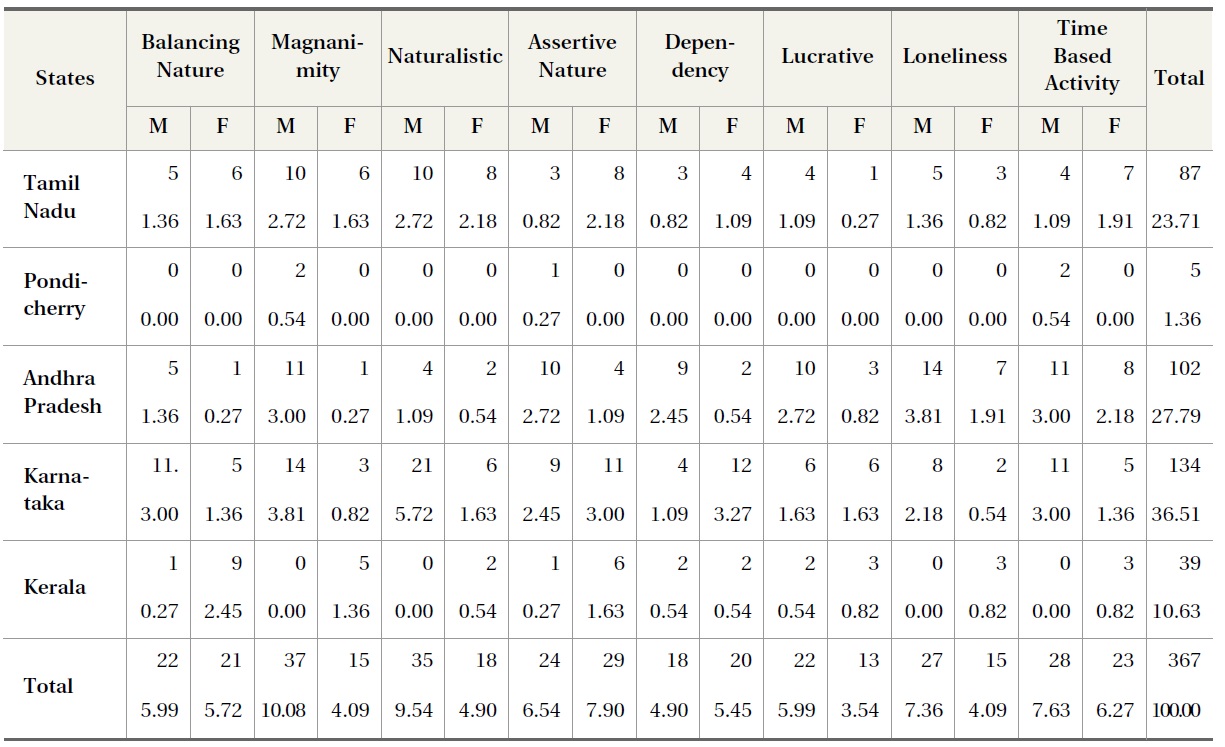
The variables grouped into eight components are Balancing nature, Magnanimity, Naturalistic, Assertive nature, Dependency, Lucrative, Loneliness, and Time Based activity.
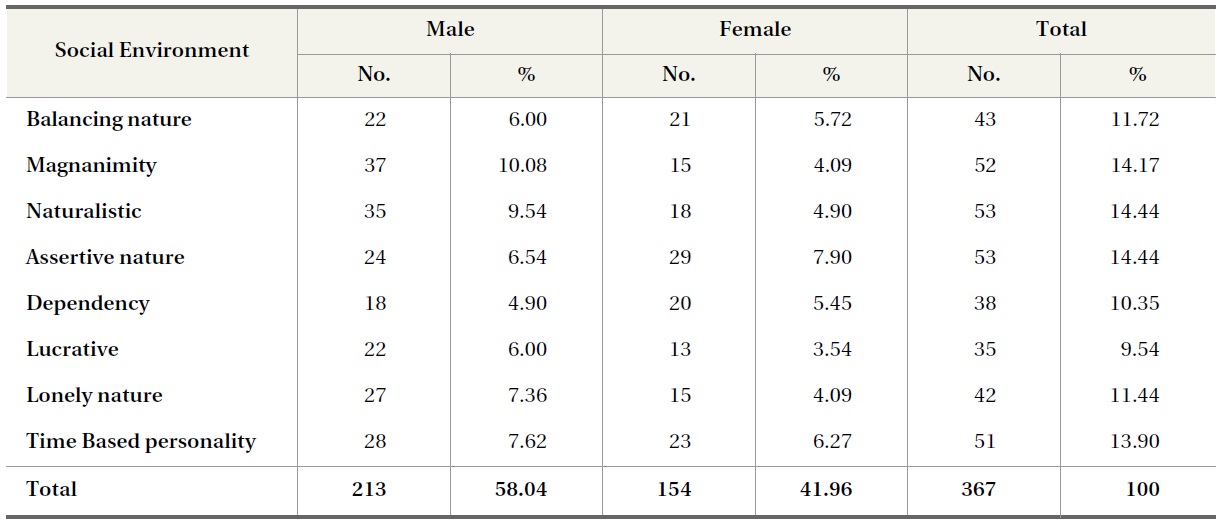
The number of respondents and the gender under each component is shown in Table 16. It can be seen that persons under each group are evenly distributed ranging from 9.54% to 14.442%. Further, it can be seen that ‘Naturalistic’ and ‘Assertive nature’ (14.44%) were equally given importance in the Social environment, followed by the ‘Time based’ personality group (13.9%).
[Table 16.] Social Environment Components vs. Gender
Social Environment Components vs. Gender
From the table, it can be seen that Magnanimity (10.08%) and Naturalistic (9.54%) respectively were prominent among the males, whereas Assertive nature (7.9%) and Time Based personality (6.27%) were given importance among the females. In males this was followed by Lonely nature (7.36%) and Time Based personality (7.62%), where in females it was ‘Balancing nature’ (5.72%) and ‘Dependency’ (5.45%). In general there is contraction in the case of Magnanimity-more in males and less in females. Similarly the case of ‘Naturalistic’ features more in males and less in females.
The skills of the respondents have been identified among states and sex as follows:
1. In Tamil Nadu, ‘Magnanimity’ and ‘Naturalistic’ (2.72%) are equally considered among male students, followed by ‘Balancing nature’ and ‘Lonely nature’ (1.36%) in equal rank as well. ‘Assertive nature’ and ‘Naturalistic’ (2.18%) are equal among female respondents followed by ‘Balancing nature’ and ‘Magnanimity’ (1.63%), also in equal rank.
2. In Pondicherry, all of the respondents are male and all favoured the category of ‘Magnanimity’ and ‘Time Based’ personality (0.54%) equally, followed by ‘Assertive nature’ (0.27%).
3. In Andhra Pradesh, the male group dominates on ‘Lonely nature’ (3.81%), followed by ‘Magnanimity’ and ‘Time Based’ personality (both 3.00%) These are followed by ‘Assertive nature’ and ‘Lucrative’ (2.72%) equally. Whereas, for females ‘Time based’ personality (2.18%) is followed by ‘Assertive nature’ (1.09%).
4. In Karnataka, males fall under the category of ‘Naturalistic’ (5.72%) followed by ‘Balancing nature’ and ‘Time based’ personality (3%), whereas for females ‘Dependency’ (3.27%) and ‘Assertive nature’ (3%) dominate, followed by ‘Naturalistic’ and ‘Lucrative’ (both 1.63%).
5. In Kerala, the male group falls under the categories of ‘Dependency’ and ‘Lucrative’ (0.54%) equally whereas among females ‘Balancing nature’ (2.45%) is followed by ‘Assertive nature’ (1.63%).
From Table 17, the top priority variables for the students are identified and the same results are presented in Table 18.
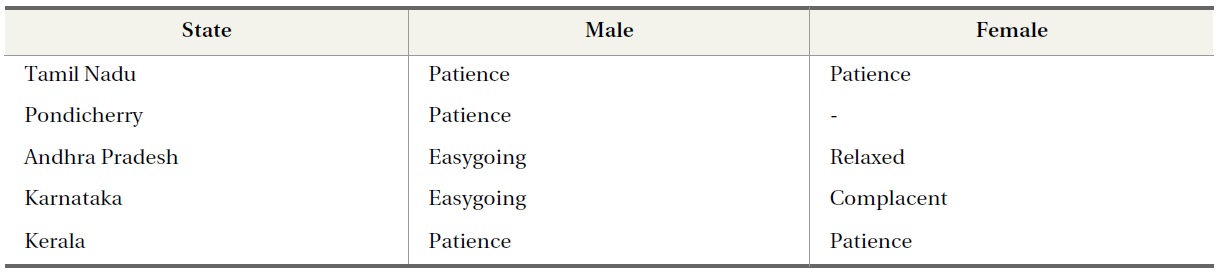
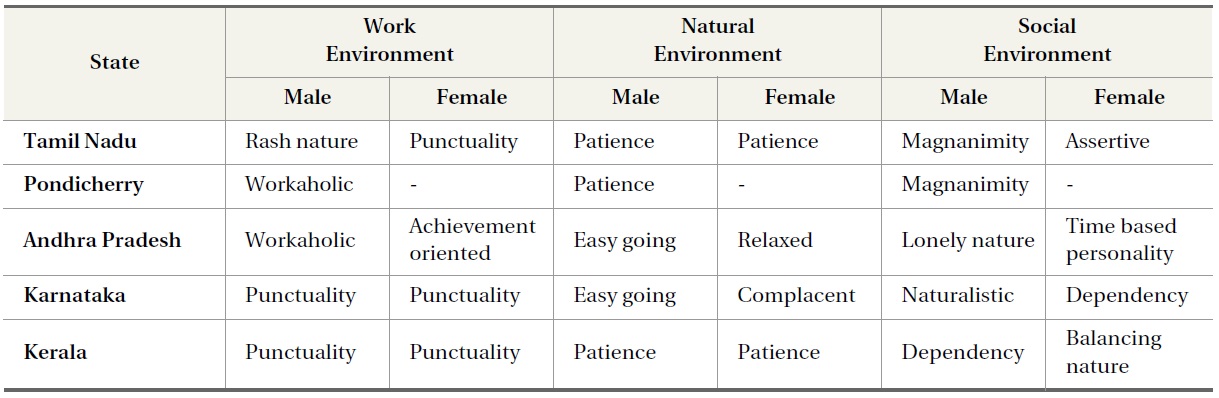
In order to identify the overall view of the three environments such as Work Environment, Natural Environment, and Social Environment, their relationship to states of south India and gender is shown in Table 19.
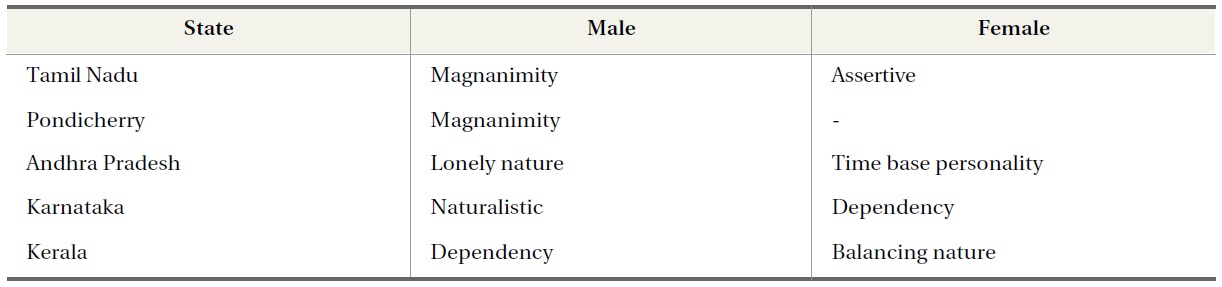
Rash nature, Workaholic, Punctuality, Patience, Easygoing, Magnanimity, Lonely Nature, Naturalistic, and Dependency are some of the behavioral traits thus existing among male LIS professionals. Similarly Punctuality, Achievement oriented, Patience, Relaxed, Complacent, Assertive, Time
[Table 17.] Social Environment Components vs. States vs. Gender

Social Environment Components vs. States vs. Gender
[Table 18.] Top Priority Variables in Social Environment among States vs. Gender

Top Priority Variables in Social Environment among States vs. Gender
[Table 19.] Comparison of Top Priority Variables in Three Environment among States vs. Gender
Comparison of Top Priority Variables in Three Environment among States vs. Gender
based, Dependency and Balancing nature exist among female LIS students.
It is often said that people’s behaviour is purely based on the environment and differs from one profession to another and from person to person. Further, it depends on culture, sex, and state of mind. This study helped to identify the behavioral psychology of LIS students in South India. Attitude is of outmost importance as it can make or mar the li-brary professional par excellence. The importance of optimism, enthusiasm, courage, confidence, sense of humor, empathy, sympathy, patience, altruism, and intellectual curiosity should be the focus of library professionals. Their qualities in fact should be a combination of knowledge, skills, and attitudes that these authors also seek from the new breed of librarians. The respondents exhibit a sense of values and standards, a public service orientation, and above all the commitment to the fundamental values of access to information. This study also demonstrates that LIS students shall need to possess these qualities, including risk taking, adaptability, assertiveness, and willingness to embrace approaches from outside the library world.
This study discusses research results on the behavioral traits of Indian LIS students using descriptive inferential statistics. Future studies can replicate its methods in various nations and/or regions with various groups of users in various types of libraries. Further studies and inferential analysis on the relationships between behavioral traits and customer satisfaction and loyalty can suggest much more beneficial information for library management as well.