In traffic environments, traffic sign recognition (TSR) is used to identify traffic signs, warn the driver, and command or prohibit certain actions. A fast real-time and robust automatic traffic sign detection and recognition system can support and disburden the driver, and thus, significantly increase driving safety and comfort. Generally, traffic signs provide the driver various types of information for safe and efficient navigation. Automatic recognition of traffic signs is, therefore, important for automated intelligent driving vehicles or driver assistance systems. However, identification of traffic signs with respect to various natural background viewing conditions still remains a challenging task. TSR systems usually have been developed in two specific phases [1,2]. The first is normally related to the detection of traffic signs in a video sequence or image using image processing. The second one is related to recognition of these detected signs. The detection algorithms are normally based on shape or color segmentation. The segmented potential regions are extracted to be input in the recognition stage. The efficiency and speed of the detection play an important role in the system. To recognize traffic signs, various methods for automatic traffic sign identification have been developed and have shown promising results.
In recent studies, the detection and recognition of traffic signs has been under development in many research centers. A vision system for TSR and an integrated autonomous vehicle was developed as part of the European research project PROMETHEUS at Daimler-Benz Research Center [3-6]. Moreover, many techniques have been developed for road sign recognition; for example, Pacheco et al. [7] used special colored barcodes under road signs to detect the road signs in a vision-based system.
A tough problem in classifying traffic signs is image degradation. However, it is difficult and unrealistic to collect all the training data under various conditions, so Ishida et al. [8] proposed a generative learning method to automatically generate the training data in accordance with the actual degradation through the estimation of the generative parameters.
Nunn et al. [9] proposed a novel region of interest concept that was based on the known real world positions of traffic signs in different driving situations.
In [10], Escalera et al. developed a model that represented a sign at a fixed distance, perpendicular to the optical axis, located at the centre of the image.
Fleyeh et al. [11] developed a fuzzy-based approach to recognizing traffic signs combining color and shape information.
The majority of recently published sign detection approaches make use of color information [7,12-15]. They share a common two-step strategy. First, pre-segmentation is employed by a thresholding operation on the individual authors’ favorite color representation. Some authors perform this directly in RGB space; others apply linear or nonlinear transformations of it. Subsequently, a final detection decision is obtained from shape-based features, applied only to the pre-segmented regions.
This paper proposes developing segmentation techniques such as line segmentation and single sign segmentation for the efficiency and speed of the system. In the detection phase, the acquisition image is processed, enhanced, and finally segmented according to the color and shape properties of the sign. The segmentation accuracy depends on the number of correct segments obtained and the number of correct segments expected. In single sign segmentation, the segmentation accuracy is almost 99.04%. Therefore, automatic road sign recognizer systems can easily detect traffic sign images from a complex background.
The remainder of this paper is organized as follows: In Section II, we present a system overview. In Section III, we give detailed description of the image processing stages. The descriptions of line segmentation and single sign segmentation are given in Sections IV and V, respectively. In Section VI and VII, we present the representative experimental results and conclusion, respectively.
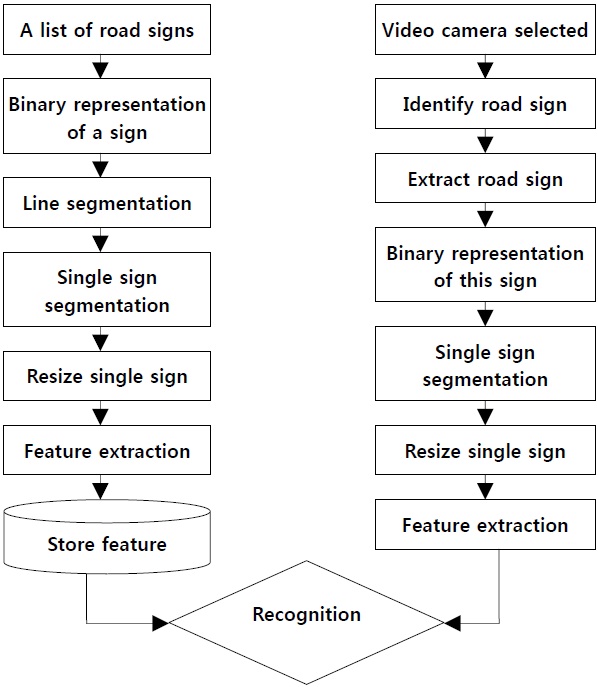
The overall system contains two major parts: image segmentation and object recognition [13,16], as shown in Fig. 1. We perform the overall task in four phases. In the first phase, a list of traffic signs are processed and stored in the database.
In the second phase, detection of the location of the sign in the image is performed, and the image extracted by a video camera. In the third phase, the images are preprocessed through an image processing technique such as the threshold technique. In the fourth phase, recognition of the sign takes place. Recognition of the traffic road sign patterns uses concavity measurement techniques.
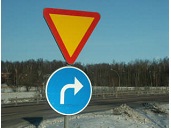
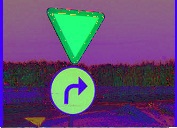
Two types of image processing are discussed in this paper. In the first type, video camera will select image processing with which a list of road signs is processed and then the selected image is processed through several steps. The image input from the video sequence containing the natural background with a view of the image is fed into the system, as shown in Fig. 2.
Steps:
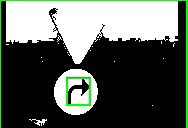
Grayscale conversion is one of the simplest image enhancement techniques. Grayscale conversion can be performed using the following function as given below:

where
Linear conversion is given as

where
A contrast stretch is further performed by linear conversion such that we have
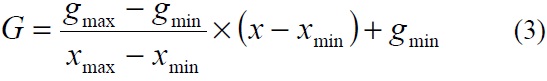
where
When there are many such pixels, we choose the pixel with the smallest column number, as shown in Fig. 3.
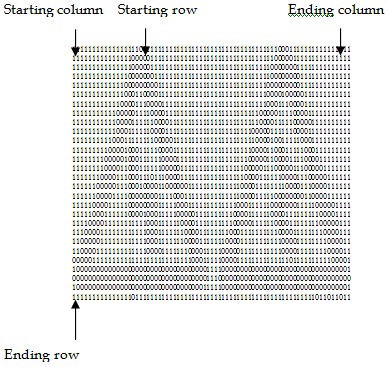
In searching for the beginning of a line, the system searches for the occurrence of a 0 in the bitmap. If one or more 0 are found in the row in consideration, then this row is accepted as the starting row of the line. The process is continued through the consecutive rows in this way until it has been found that there are no 0s in a row and the row immediately before this row is considered to be the ending row of the line, as shown in Fig. 6.
To search for the starting column of the line, the system scans the binary file vertically beginning from the starting row and ending at the ending row of the line. In this case, the scanning process will start from the starting column of the binary file and continue through the consecutive columns. If the system finds the occurrence of one or more 0’s in a column, this column is considered to be the starting column of the line.
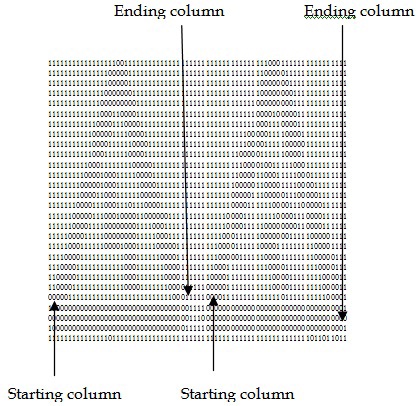
Single sign segmentation is performed by scanning vertically, column-by-column. If a column contains one or more 0’s, this column is considered to be the starting column position of the sign. The process is continued through the consecutive columns in this way until it has been found that there are no 0s in a column and the column immediately before this column is considered to be the ending column of each sign. Fig. 7 shows the starting column and ending column of each sign.
In our experiments, the developed system was tested against a collection of 200 sign images. The objective of the section is to study the segmentation and recognition performance of the system as like [17].
Each type of traffic sign is consisted of an original and a binary image with a specific pattern. If the original image of the traffic sign is effectively extracted, it can provide a stable basis for traffic sign recognition. Within detection of the traffic sign region in the original image, the binary image of the traffic sign can be effectively extracted by line and single sign segmentation. The formulas of image segmentation for extraction of the binary image are given as follows:
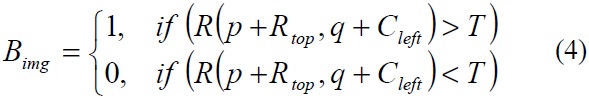

where
The results of different modules of our system are below: The percentage of accuracy of single sign segmentation
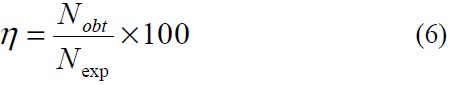
where
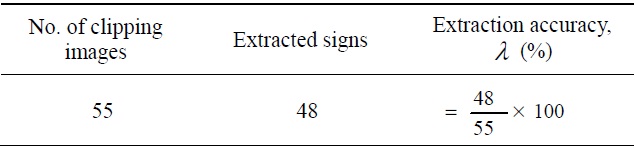
The percentage of accuracy of the extracted sign
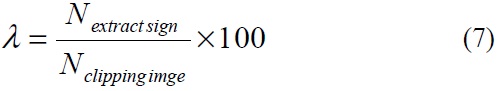
where
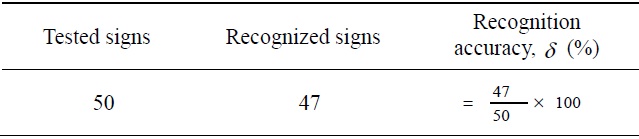
The percentage of accuracy of recognition
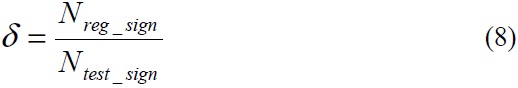
where
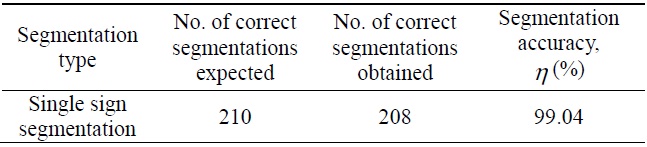
[Table 1.] Single segmentation accuracy results

Single segmentation accuracy results
[Table 2.] Sign extraction accuracy result

Sign extraction accuracy result
[Table 3.] Recognition accuracy results

Recognition accuracy results
Road signs are deliberately designed and positioned to make it easy for humans to detect them and recognize what they mean. It is still a challenge to enable a computer to perform as well as humans, especially over the full range of possible signs. While sign detection methods are robust and accurate, sign recognition suffers because the extracted sign regions are small and often blurred. In the paper, we have implemented the proposed scheme and obtained numerical results. Firstly, we have taken a list of traffic sign, processed the signs, and stored them in a database. If the two signs are closely related, the segmentation process is not accurate because overlap may occur. In single sign segmentation, the segmentation accuracy is almost 99.04%. Traffic signs are extracted accurately from the selected image from the camera. Therefore, automatic road sign recognizer systems easily detect traffic sign images from a complex background.