For several years, wireless sensor networks (WSNs) have been widely adopted for monitoring conditions over large areas [1-3]. These physical and environmental properties include temperature, pressure, motion, luminosity, vibration, water acidity, and even toxicity levels. Some very popular examples of WSNs are those found in habitat monitoring, volcano monitoring, permafrost monitoring, and radiation monitoring.
Sensor nodes are usually deployed in large groups involving hundreds to even thousands of sensor devices. These nodes are tightly constrained in terms of energy, processing, and storage capacities. Replacing energy sources after batteries have been worn out remains a difficult and often impossible task, especially in sensor networks that will be deployed in harsh environments or out-of-reach areas. These nodes are left unattended for long durations ? years and even decades. In order to prolong the network lifetime, it is necessary to minimize the consumption of energy by individual nodes.
The design of an effective battery-powered WSN is very important because the lifetime and utility of the systems are limited by the capacity of the batteries to sustain the network. The dependability of the data produced by the sensor network deteriorates with the decreasing energy and number of nodes in the network.
Energy is the limiting factor in achieving extreme systemwide lifetime. Fortunately, a promising technique to forestall this network energy crisis is emerging ? environmental energy harvesting [1]. Unlike power sources that are fundamentally energy reservoirs, energy harvesting (also known as “energy scavenging”) is a means of powering wireless sensor nodes by harvesting various low grade ambient energy sources such as environmental vibrations, human power, thermal sources, solar, and wind energy, and their conversion into useable electrical energy [4].
Using the energy harvested from the environment will eliminate the problem of replacing the batteries of the sensors when they run down. The process simply replenishes the energy of the nodes and lengthens the lifetime of the network. Combining low-power electronics, capacitors, and energy harvesting devices, we can extend the lifetime of the network without relying on either the harvested energy or the batteries alone [5].
Simulations for energy harvesting WSNs require a simulator with a flexible energy model that can be modified easily and outputs the readings on the nodes’ total energy, as well as energy usage while sleeping, idling, and energy received and transmitted.
ns-2 is the most popular and widely used simulation platform for WSNs as well as other wired network simulations [6].
Although it is very flexible and has been updated with an energy model that can output the readings for the nodes’ energy consumption, it does not have a built-in energy harvesting algorithm that can be used to simulate WSNs that can harvest energy from the environment. In this paper, a simple energy harvesting algorithm has been implemented, which will serve as the first step in developing a more advanced energy model for the ns-2 simulation platform.
In Section II, the related work and proposal will be discussed. A brief background about the energy harvesting structure will also be discussed in Section II-A. In Section III, the energy model, energy harvesting algorithm, and workload model will be discussed. Section IV contains all of the information regarding the simulation model, and the results and discussion. Finally, we conclude in Section V.
The following section discusses the energy model, the energy harvesting algorithm, and the workload models that are used for this study. The energy harvesting algorithm describes the simple algorithm that was attached to the energy model of the ns-2 to simulate energy harvesting in WSNs.
[Table 1.] Power densities of different energy

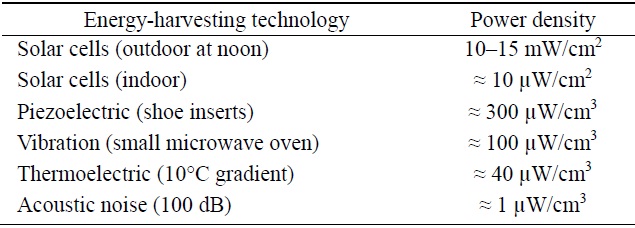
Power densities of different energy
We assume that the sensors are equipped with solar panels. The available environmental energy may vary at a single node. At the same time, there may be variations of the harvested energy for different nodes. This is because the harvested solar energy supply is highly time varying and may not always be sufficient to power the whole network. Another reason could be the placement of the sensors in the deployment environment, for example, some sensors will be in the shade, solar panels could be tilted toward the sun at a suboptimal angle, etc.
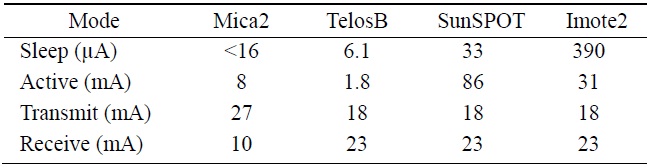
Photovoltaics (solar cells) can be used to power sensor nodes. The available power depends on whether nodes are used outdoors or indoors, and on the time of day. Different technologies are best suited for either outdoor or indoor usage. The resulting power is somewhere between 10 μW/cm2 indoors and 15 mW/cm2 outdoors [7]. These levels are not sufficient to power a sensor device. Hence, solar cells are usually used to recharge secondary batteries. Table 1 [8] shows the different power densities of some of the most widely used energy harvesting technologies. The capabilities and operating characteristics of a range of WSN platforms are shown in Table 2 [8].
In this paper, we focus on spatial variations of environmental energy and assume that each node u has an individual harvesting power rate
>
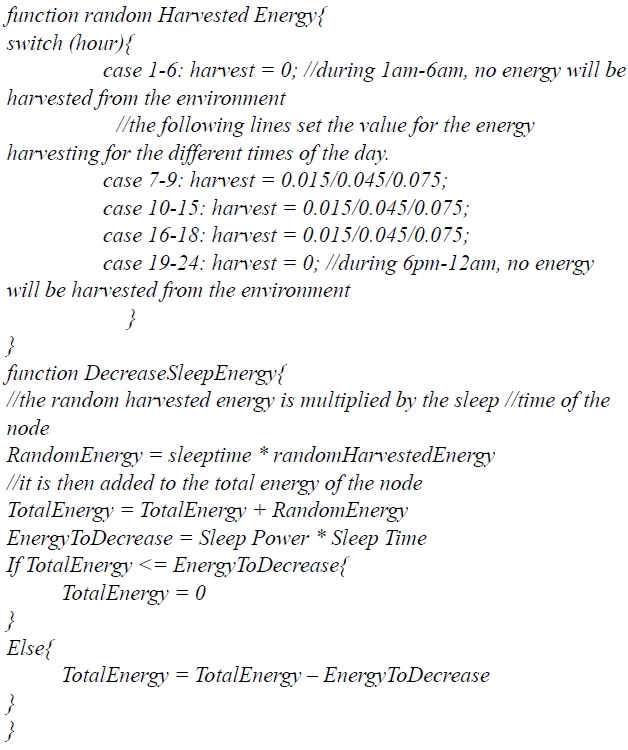
B. Energy Harvesting Algorithm
The energy harvesting model for this simulation shown in Fig. 1 was attached to the energy model module of ns-2. The simple algorithm determines the time of day (not the actual time) every time the function is being called. Based on the time of the day, a specific amount of energy will be added to the total energy in the energy model.
[Table 2.] Features and characteristics of a selection of popular wireless sensor nodes

Features and characteristics of a selection of popular wireless sensor nodes
This algorithm is implemented in the function of the ns- 2’s energy model, where the energy is decreased during sleep. This is done to enable the node to replenish its energy when it is in sleep mode.
We assume that no data compression or in-network aggregation is performed. Although in-network processing is critical to the sensor network lifetime, such a process will not be applied here. All packets are forwarded to the base station for processing.
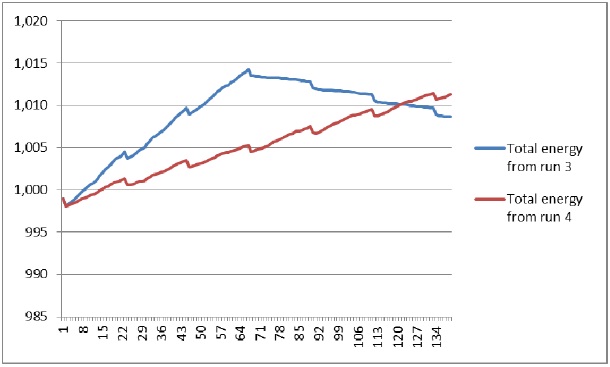
The packet size was set to 512 bytes sent at intervals of 10 seconds (simulation time). Random seeding for constant bit rate (CBR) was also set to one. Later on, this resulted in different line graph shapes after the simulation. These outputs are shown in Figs. 4 and 5, where the energy harvesting
[Table 3.] Harvested energy values

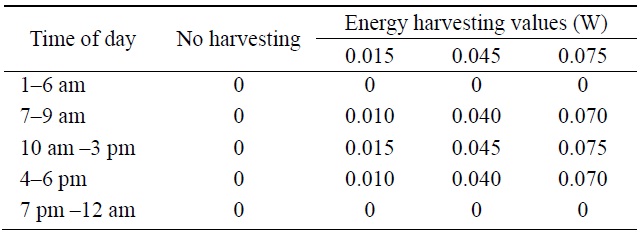
Harvested energy values
rates were the same for both runs of the simulation but gave different outputs. The maximum packets to be transmitted were also set to 50,000.
In order to simplify the experiment, the following will be assumed:
1. Each sensor node has a capacitor and a battery. The rate of solar energy harvesting will be based on Table 2.
2. The sensor devices are homogeneous. The sensor network is comprised of identical devices with the same capabilities in terms of computing, sensing, communication, and power.
3. All nodes are stationary.
4. Random energy harvesting rates are set for each node, simulating the way sensor nodes are going to actually harvest solar energy from the environment.
1. An initial energy of 1,000 J is set for each node. A variable is also set to store the total harvested energy but this is not shown in the trace file.
2. We assumed that the amount of energy harvested from the sun is constant during specific times of the day. This is determined in the energy harvesting algorithm in the energy model of ns-2 and is shown in Table 3.
3. In the second column of Table 3, the energy harvesting algorithm is not applied; therefore, energy is not replenished for the nodes. Column 3 shows the most realistic values of the most common energy harvesting devices in the industry as of the writing of this paper. Columns 4 and 5 show the minimum recommended value for energy harvesting so that a sensor node could efficiently replenish its energy and result in a WSN with a longer lifetime.
4. The nodes were randomly distributed and simulated in an 800 × 800 flat grid. The simulation time was set to 2,000 seconds and the duty cycle for SMAC was set to 10.
5. We also set the values in Table 4 in the tool command language (TCL) script for the simulation. The power usage in idle, receive, and transmit modes was set to 0.06 J. The power usage for sleep was set to 0.00006 J. The transition time is the time it takes for the node to switch from a sleep state to an idle state, and it consumes a power of 0.12 J.
[Table 4.] Energy usage of sensor nodes
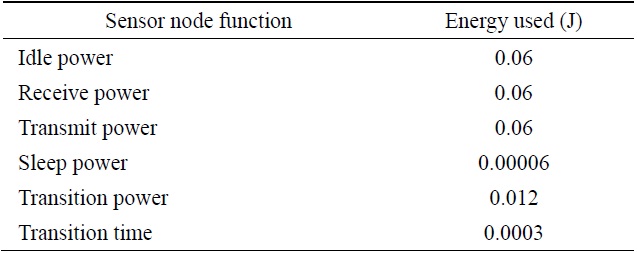
Energy usage of sensor nodes
[Table 5.] Sample energy traces (J)

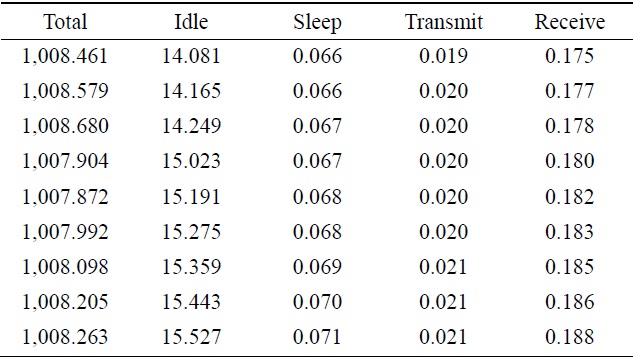
Sample energy traces (J)
In this section, we compare the results of the simulations using the energy harvesting algorithm with one that does not use the algorithm. The simple energy harvesting algorithm developed for ns-2 was designed to vary the harvested energy to represent close, if not actual, energy harvesting values of a standard solar cell during specific times of the day (Table 1).
Table 5 shows a part of the ns-2’s trace file that shows the energy traces of a node. Here, we can see that the total energy replenishes itself after a certain amount of time.
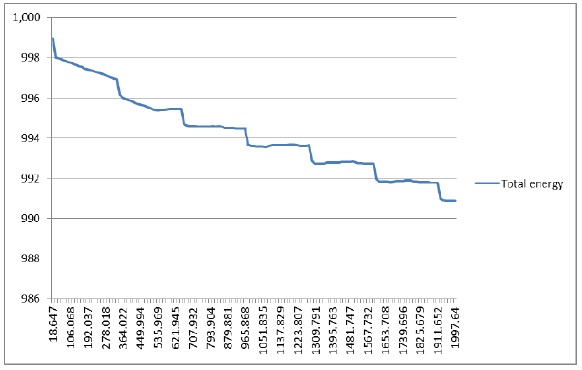
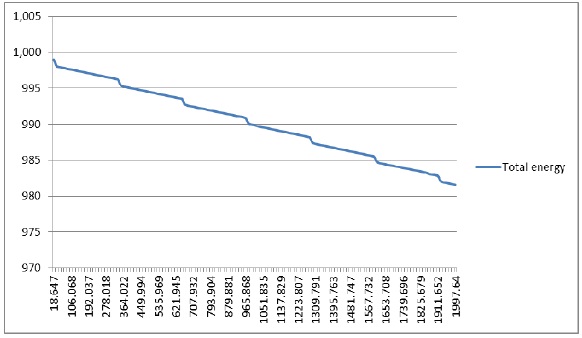
Fig. 2 shows the total energy of one of the nodes in the simulation. The simulation here used a realistic value of 0.015 W for the energy harvesting rate. When the results in Fig. 2 are compared to Fig. 3, which does not use the algorithm, we can see that there is a significant difference in the final total energy of the nodes when the simulation stopped. In Fig. 2 the node has about 990.9 J of energy left while in Fig. 3 the node has only 982 J of energy left at the end of the simulation.
Because of the random seeding of packets, different runs of the simulation produced different results but still showed that indeed the algorithm for energy harvesting was working. The harvested energy values in Fig. 2 have a range of 0.010?0.015 W. It clearly shows that with even a small amount of energy harvested, a sensor node’s lifetime could be significantly extended.
In the next figures, we will show the results of the simulations with slightly increased values so that we could determine what rate we could use or develop in the future in order to make a sensor network last indefinitely.
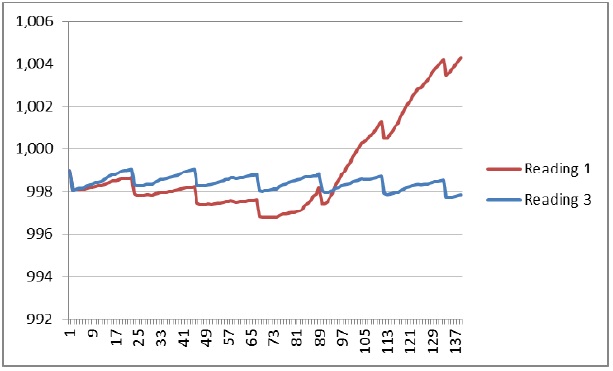
Fig. 4 shows two different versions of the same simulation with the value of 0.010?0.075 for harvesting energy. Further, Fig. 5 shows another two different versions of the same simulation with the value of 0.010?0.045 for harvesting energy.
In Fig. 4, reading 3 is worth noting. It shows that for a simulation time of 2,000 seconds and using an energy harvesting value of 0.075, the energy level of the node did not go below 997 J. This value can be used by solar harvesting device manufacturers as a basis for their product specifications. So that we can ensure a wireless sensor that can last indefinitely, it should be able to harvest approximately 0.075 W/cm3 of solar energy.
In the figures above, we can tell that the nodes can sometimes consume a larger amount of energy due to the transmitting and receiving actions. The slight increase in the node’s energy in Fig. 3 indicates that the node has stopped participating in the overall activity of the network and has thus switched to a longer state of sleep, replenishing its
energy and only using it up whenever it wakes up and switches to an idle state.
Under the conditions given in Section IV, if a node has an energy harvesting rate of 0.075 W/cm3, it is enough to make a sensor node independent of an external power input. The device will be able to sustain itself using the harvested ambient (solar) energy, managing itself, and this can thus lead to years of autonomy for the whole sensor network.
In this study, we showed that given a particular set of conditions for a WSN and a minimum energy harvesting density for the harvesting device, it is possible to efficiently replenish the energy lost by the node in its receive, transmit, and idle modes. This lengthens the life of the node and increases the packets that it transmits through the network, therefore making it more useful. Lengthening the life of one node (or many nodes) could not only lengthen the life of the entire network but also affects other aspects like the total packets transmitted by the network, latency, and accuracy of the data.
The algorithm that we implemented on ns-2 showed some very meaningful results. It is an important step in developing a more advanced energy harvesting algorithm in ns-2. Some results showed that it is possible, with a minimum harvesting energy rate, to increase the lifetime of the network nodes as well as the whole network. It is also possible to make the network last forever, given the right conditions and an efficient energy harvesting structure and device. The results of this study could serve as a basis for developing future devices, especially those that harvest solar energy for WSNs.
Future works in this area of study should include the implementation of a more advanced algorithm for energy harvesting in wireless sensor devices. The next step for this
research is to deploy a certain number of sensor nodes in the environment and observe the effects of a much higher energy harvesting rate compared to the standards in the industry today. Network lifetime should be recorded as well as the latency, total packets transmitted, and the accuracy of the data that traverses the network.