The key to dramatically increasing agricultural production probably lies in increasing the output per unit area, together with the expansion of arable land. Crop variation, as is widely practiced through crop rotation, is a sustainable method of effecting greater output from a given land area. However, the solution may not only involve the mechanized rotation of mono-cultural cropping systems which is currently the standard protocol, crop rotation is not just used in developed countries but may also utilize poly-culture cropping system traditionally used in developing countries such as Africa and Latin America (Francis and Adipala 1994). The main reason for using a multiple cropping system is the fact that it involves integrating crops using space and labor more efficiently (Baldy and Stigter 1997). Biophysical reasons include better utilization of environmental factors, greater yield stability in variable environments, and soil conservation. Socio-economic reasons are essentially based on the mass balance of inputs and outputs, increasing yields, and their contribution to the stabilization of household food supply (Beets 1982).
Intercropping, which is one type of multiple cropping systems has been practiced traditionally by small-scale farmers in developing countries for centuries. In particular, cereal and legume intercropping is recognized as a common cropping system (Ofori and Stern 1987). Typically, cereal crops such as field maize (
Legumes fix atmospheric nitrogen, which may be utilized by the host plant, or may be excreted from the nodules into the soil and be used by other plants growing nearby. The fixed nitrogen may also be released by decomposition of the nodules or leguminous residue after the legume plants die or are ploughed under. The crop residues left on the surface after harvest or incorporated into the soils are not leached by surface run-off in the same manner as liquid and chemical fertilizers can. This means fewer nutrients are lost and more water is available for crop growth. Because of these reasons, intercropping of cereal and legume crops helps to maintain and improve soil fertility (Willey 1979a, 1979b). Also it has been observed that the roots of these intercrops freely intermingle, resulting in complementary interactions between the root systems, such as nitrogen transfer, or complementary use of different nutrients (Natarajan and Willey 1980). On the other hand, the yield effectiveness of an intercrop is valued based on the concept of a land
[Table 1.] Soil properties (0-30 cm) before plant sowing

Soil properties (0-30 cm) before plant sowing
equivalent ratio (LER) which is used to demonstrate the optimal ratio of both crops (Vandermeer 1989).
As the nitrogen supply and different pattern of plant populations are among the basic parameters for cereallegume intercropping, this study was conducted to examine the effects of different bean and maize population patterns, and different nitrogen fertilizer applications on morphological and yield related traits, allowing for optimization of the intercropping system.
>
Experimental design and plant materials
Field experiments were conducted during two consecutive cropping seasons (2010-2011) in the Fars province, South Iran (coordinates: 29°43′ N and 52°35′ W). Soil characteristics of the experimental area are presented in Table 1. Fertilizers were applied with the ratios of 80 kg P/ha and 100 kg K/ha just prior to sowing. Green bean (
Factorial analysis based on Completely Randomized Block Design (RCBD), with three replications of each condition, was used in the study, where the first factor was 7 different ratios of Maize-Bean (Maize sole cropping, Bean sole cropping, intercropping of maize/bean at ratios of 1/3, 1/1, 2/3, 3/2, and 3/1) and the second factor was the application of three levels of nitrogen (N) fertilizer (0, 100, and 200 kg N/ha). The N fertilizer levels were applied before the sowing of crops. Each plot of single maize and bean crops consisted of four rows 60 cm apart and 3 m long. Hand weeding and irrigation were applied based on the needs plants. Different intercropping patterns of maize-bean were planted in a row as follows:
Maize (M)/bean (B);
M1/B1 = 1 seed of maize after 1 seed of bean
M3/B1 = 3 seeds of maize after 1 seed of bean
M1/B3 = 1 seed of maize after 3 seeds of bean
M2/B3 = 2 seeds of maize after 3 seeds of bean
M3/B2 = 3 seeds of maize after 2 seeds of bean
The leaf area for both crops was measured after the flowering stage. Mature beans and maize were harvested about 110 and 190 days from planting, respectively. Plant height, plant dry weight, 100-seed weight, biological yield and grain yield of the two crops were measured at harvest time. Thousand-grain weight was determined from a 100 grain sample randomly taken from the grain of each plot.
In order to measure leaf area, one plant was cut, from each of the three replications, at ground level. Leaf length and maximum leaf width of all leaves on each plant were measured manually, and the leaf area of each leaf was then measured using the Area Measurement System. Leaves were dried to a constant weight at 75℃ for about three days.
One hundred-grain weight was determined from 100 grains sample randomly taken from the grain produced on each plot. Grain yield was recorded by weighing the grains shelled from the ears obtained from the central four rows of each subplot and converted it into kg/ha using the formula:
Grain yield (kg/ha) = {Grain yield (kg)/Area harvested (3 m × 5 m)} × 10,000
Biological yield was also recorded by weighing the sun dried plants, along with the ears, obtained from the central four rows of each subplot. The biological yield thus obtained in each subplot was converted to kg/ha. Also, rows/plant seeds/row, stem diameter, ear diameter, ear height and ear weight for maize and pods/plant and seeds/pod for bean were measured. The LER was used to assess the performance of an intercrop relative to the corresponding sole crop, using following formula of Mead and Willey (1980):
LER = Yi/Yj Total LER = LERm + LERb
, where Yi is the yield of different intercropping patterns in maize or bean and Yj is the yield of the related single crop. Total LER was calculated using a summation of both maize and bean crops.
A test of homogeneity of variance for the combined data of two years was carried out, and after ensuring homogeneity, the combined analysis of variance was performed using a general linear model (GLM) procedure by SAS ver. 12 software (SAS Institute Inc. 2004). The effect of each year was considered as a random factor, while intercropping patterns and nitrogen fertilizer levels were fixed factors in the model. Normality tests for all variables were performed with Minitab14, using residuals and variables which were not normally distributed were converted to a normal distribution by the appropriate transformation. The least significant difference (LSD) method (
>
Leaf area, height and dry weight of maize and bean
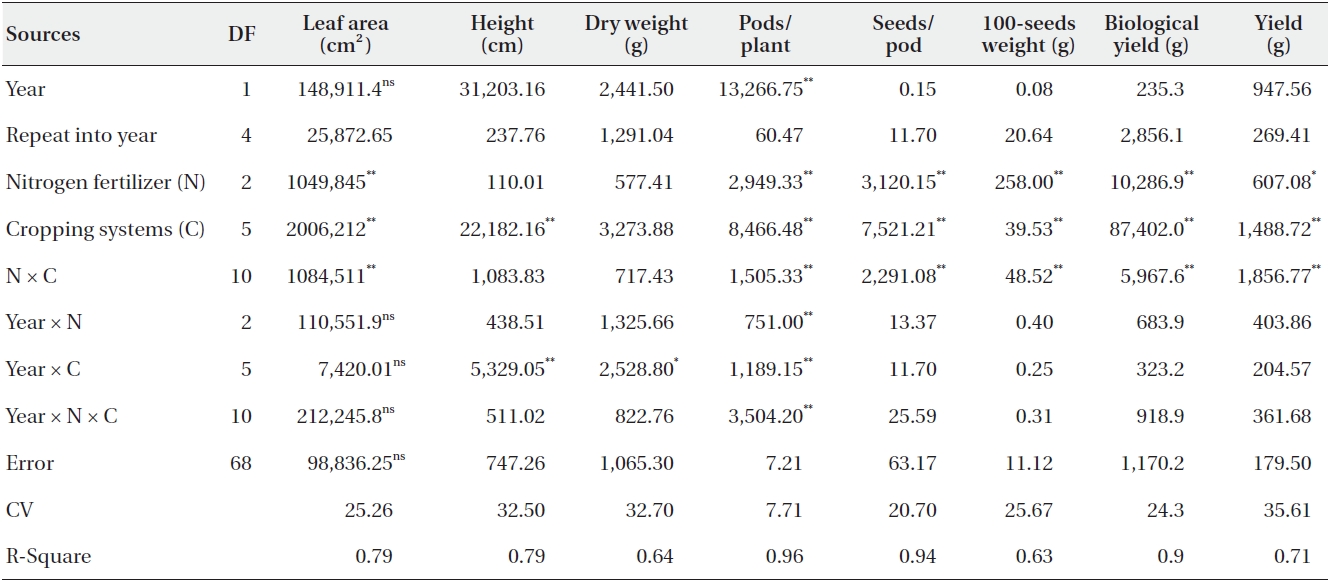
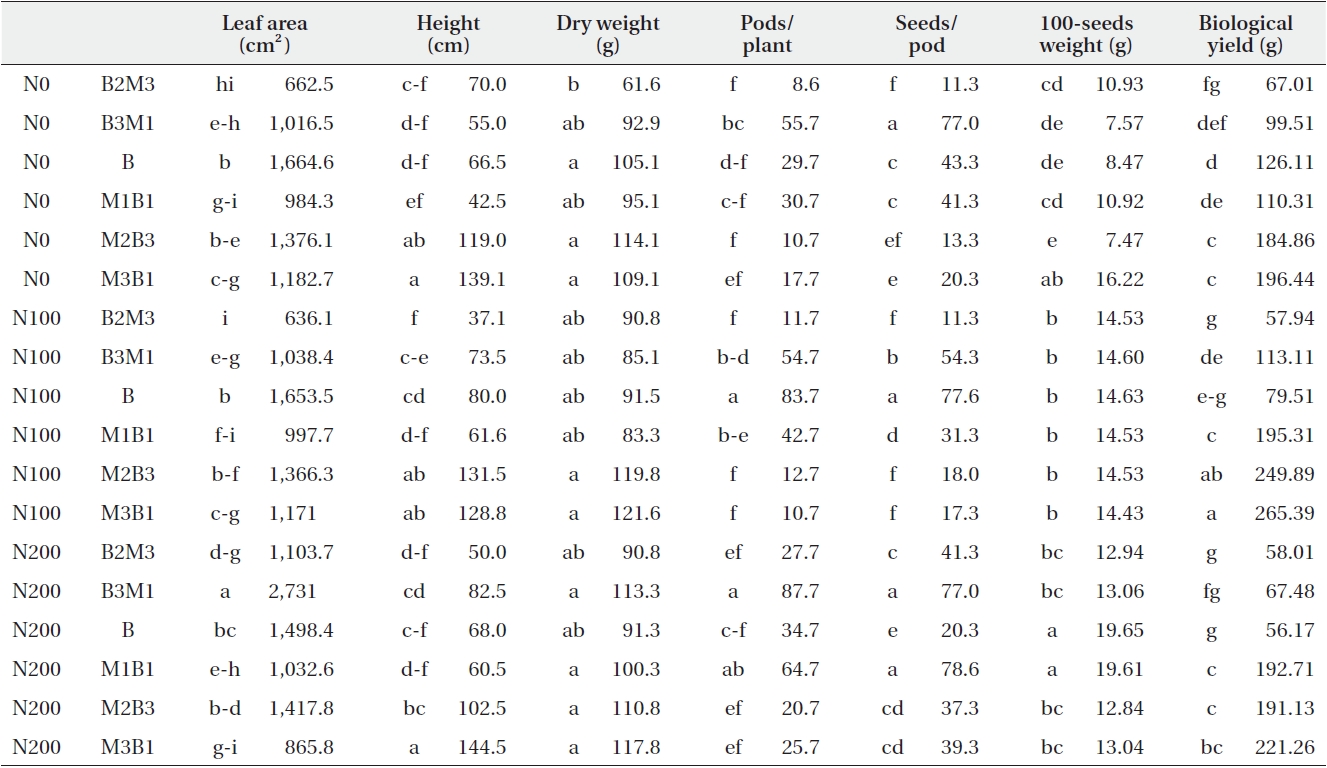
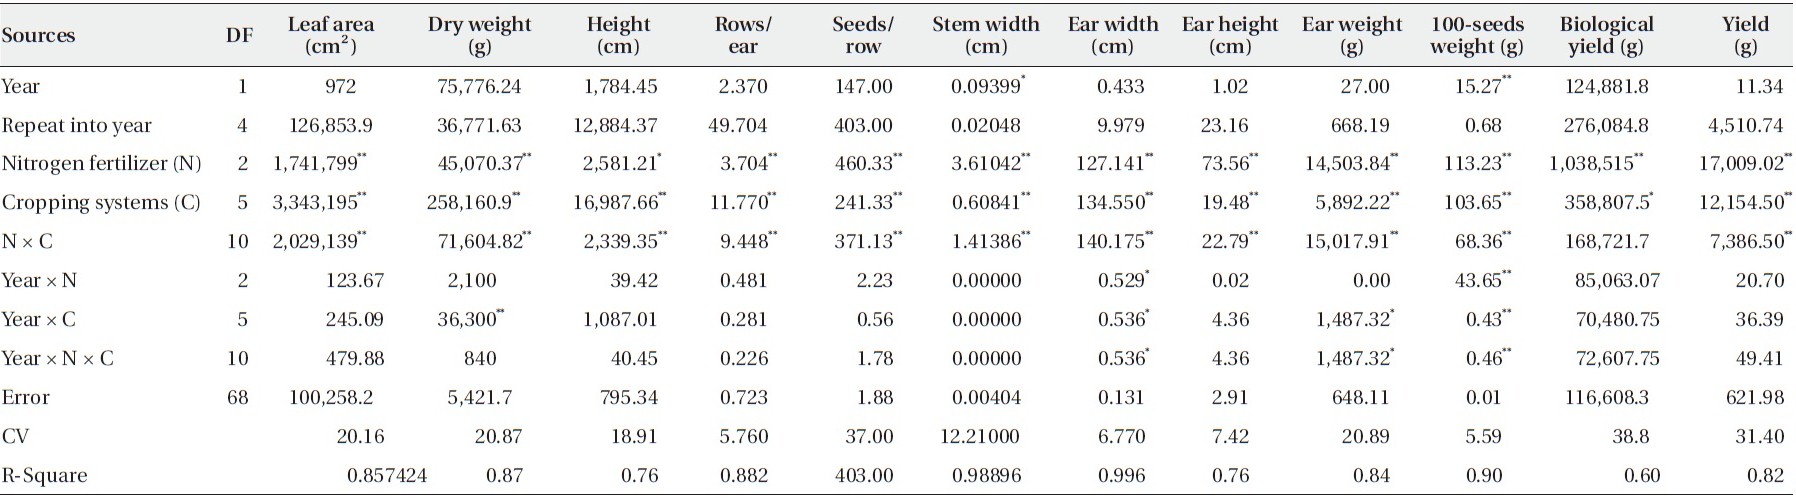
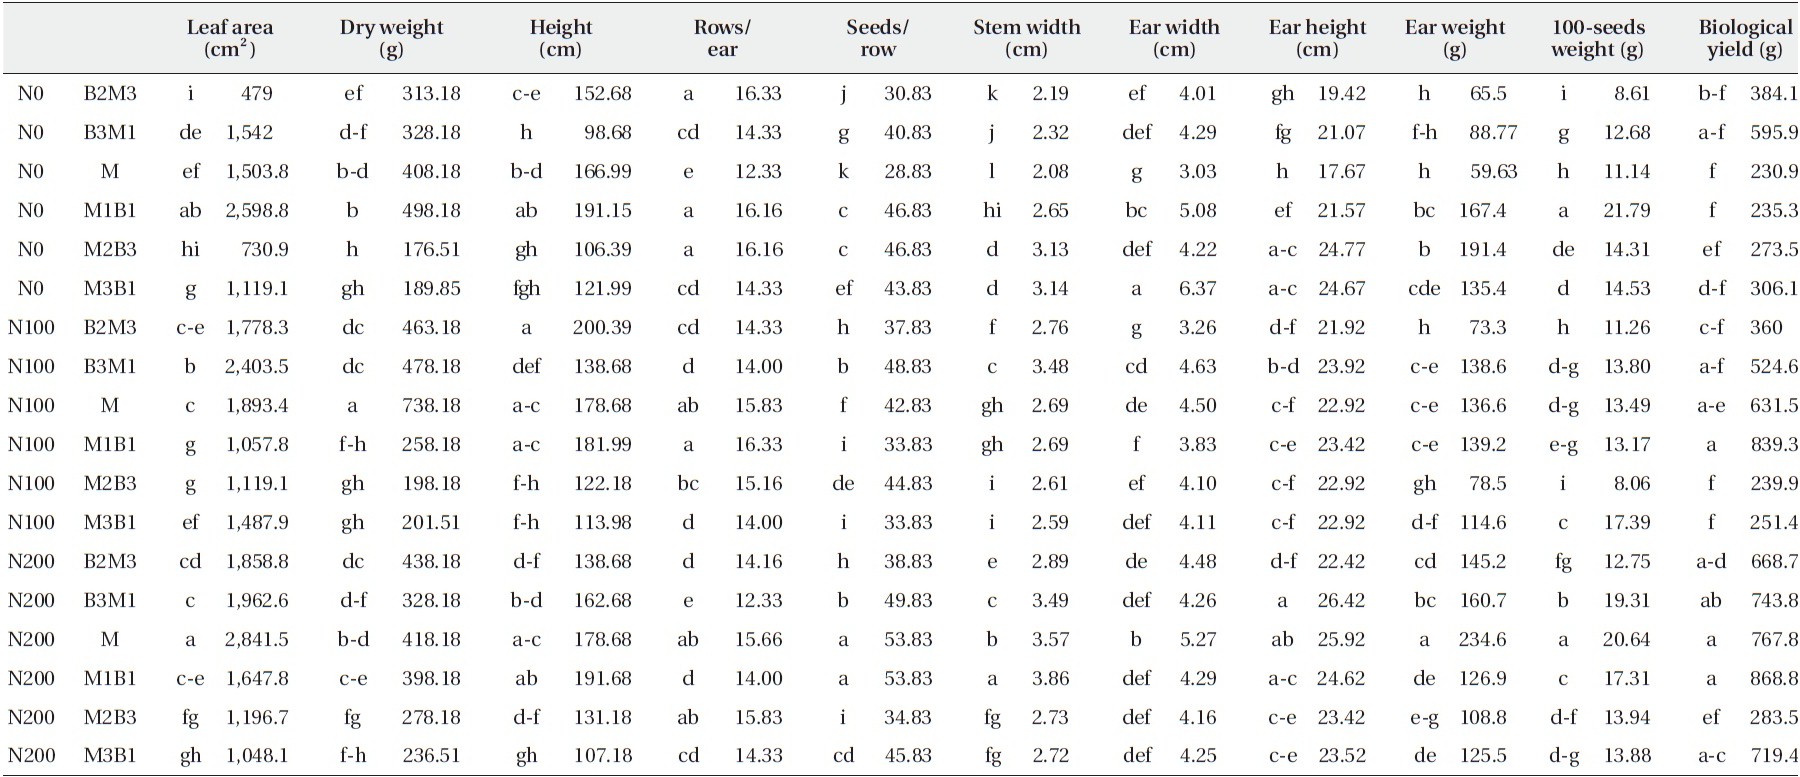
The amount of nitrogen (N) fertilizer, different cropping systems, and their interactions were found to significantly affect bean leaf area, maize leaf area, maize height and maize dry weight, but none of the factors was found to significantly effect bean dry weight production (Tables 2 and 3). The type of cropping system was the only significant effect related to bean height. Highest mean value for bean leaf area, height and dry weight, respectively, were determined for bean sole cropping, M3B1 and M3B1, while the lowest of these were determined for M1B1, M3B2 and M3B2 (Table 2). Maize sole cropping returned the maximum leaf area and dry weight, but the maximum height was observed for M1B1. Minimum mean values for leaf area, dry weight and height of maize were recorded for M2B2, M3B1 and M3B1, respectively (Table 3). B2M3 with 100 kg N/ha resulted in the minimum bean leaf area and bean height, but bean sole cropping with no N fertilizer and M3B1 with 200 kg N/ha had the maximum values for these, respectively (Table 4). No application of N fertilizer interacted with B2M3, M2B3 and B3M1, which showed lowest mean values for maize leaf area, maize height and maize dry weight, respectively, while maize sole cropping in combination with 200 kg N/ha and 100 kg N/ha, resulted in the maximum maize leaf area and dry weight, respectively, whereas B2M3 combined with 100 kg N/ha resulted in maximum maize height.
>
LER, yield and yield components of bean
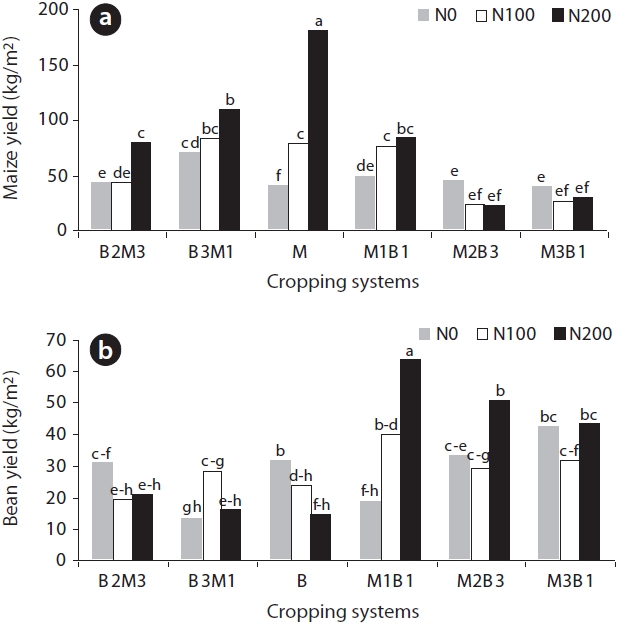
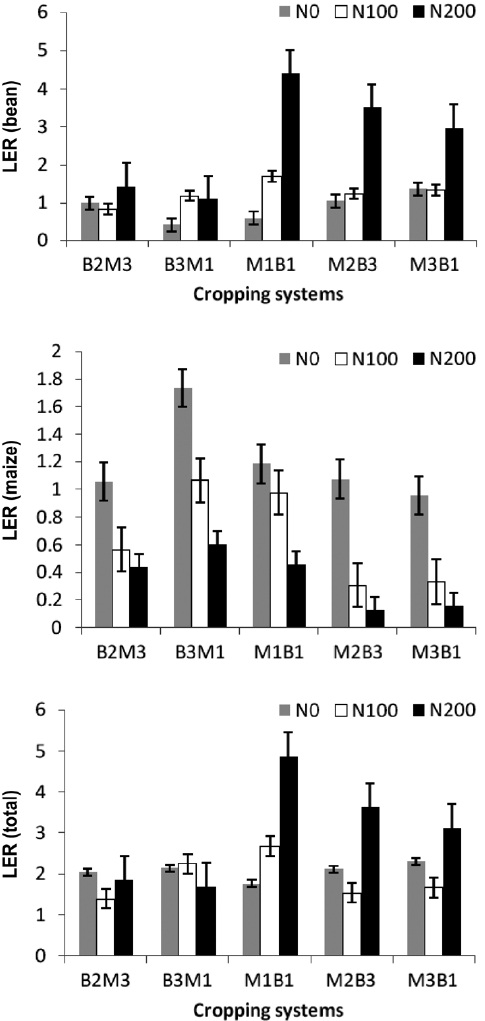
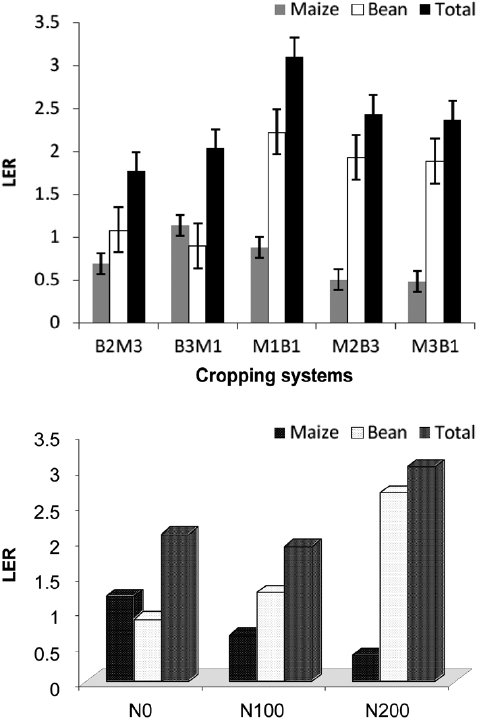
Analysis of variance showed that the effect of nitrogen fertilizer, cropping systems and their interactions are significant on all bean yield related traits (Table 2). The highest pods/plant values resulted from B3M1 with 200 kg N/ha, while the lowest resulted from B2M3 with no N application. M3B1 with no N fertilizer application and bean sole cropping with 200 kg N/ha commonly showed the lowest mean value for seeds/pod, while M1B1 with 200 kg N/ha showed highest values (Table 4). Although there were just slight differences among interactions of cropping systems × N fertilizer which could be related to the 100-seeds weight of beans, M2B3 with no fertilizer showed the lowest value and bean sole cropping and M1B1 with 200 kg N/ha commonly had the maximum value. The effect of N fertilizer, cropping systems and their interactions significantly affected the biological yield of beans. M3B1 with 100 kg N/ha application showed the maximum mean values for biological yield, and were not statistically different from M2B3 with the same application of fertilizer. Bean sole cropping with 200 kg N/ha had the lowest biological yield and also were not statistically different from B2M3 with 200 kg N/ha, or B2M3 with 100 kg N/ha. Among the various cropping systems, B3M1 showed the lowest mean bean yield, and M1B1 showed the maximum yield. Analysis of the interaction of N fertilizer with cropping systems indicated that M1B1 under 200 kg N/ha had a maximum yield while M1B1 under no fertilizer application had a minimum yield (Fig. 1). Similar to bean yields, the highest LER was obtained for B3M1 under 200 kg N/ha application and the lowest one obtained for B3M1 under no fertilizer application (Fig. 2).
[Table 2.] Analysis of variance of cropping systems for bean

Analysis of variance of cropping systems for bean
>
LER, yield and yield components of maize
Barring interactions between cropping systems and N application rates, which showed no significant effect on the biological yield of maize, the effects of cropping systems, N fertilizer, and also their interactions on
all yield related traits of maize were significant (Table 3). Sole cropping of maize under no N fertilizer application showed the lowest mean values for most yield related traits, such as seeds/row, stem diameter, ear diameter, ear height and biological yield. Related to biological yield, maize sole cropping and M1B1 under no N application and also M2B3 and M3B1 under 100 kg N/ha application commonly resulted in the lowest mean values (Table 5). Results of mean comparisons for rows/ears showed that there was no significant difference between B3M1 under 200 kg N/ha application and sole cropping of maize with no N application. For ear weight, B2M3 under 100 kg N/ha showed the lowest mean value, and for 100-seeds weight B2M3 under no fertilizer application and M2B3 under 100 kg N/ha showed the lowest mean value. The highest mean value for stem diameter, ear diameter, ear height, ear weight and 100-seeds weight were obtained for M1B1 under 200 kg N/ha, M3B1 under no fertilizer application,
[Table 3.] Analysis of variance of cropping systems for maize
Analysis of variance of cropping systems for maize
B3M1 under 200 kg N/ha, maize sole cropping under 200 kg N/ha and maize sole cropping under 200 kg N/ha, respectively. M1B1 under 100 kg N/ha, M1B1 under 200 kg N/ha, and maize sole cropping commonly showed the highest biological yield. Application of 200 kg N/ha with a sole maize cropping system results in the maximum maize yield, but 200 kg N/ha fertilizer with M2B3 intercropping system results in the lowest yield (Fig. 1). B3M3 under no fertilizer application had the maximum maize LER while M2B3 with 200 kg N/ha had minimum one.
Combined analysis of variance showed non-significant difference for the effect of year (Table 2), on bean production. Intercropping systems had significant effects (
[Table 4.] interaction mean comparison cropping system × nitrogen in bean

interaction mean comparison cropping system × nitrogen in bean
crops. Generally, N fertilizer caused an increase in most of the traits, but the response of individual crops and cropping systems were different. The response of bean to N fertilizer was lower than the response of maize. Since, bean is a legume and can fix N via symbiotic nitrifying bacteria in its roots, the there is less necessity for N fertilizer for this crop.
With respect to increasing the levels of N fertilizer, the yield of bean sole cropping decreased but yield maize sole cropping increased. On the other hand, the yield of both bean and maize crops in intercropping systems increased with increasing levels of N fertilizer application. This result may be due to the use of more nitrogen in intercropping systems. Differences among cropping systems related to crop yield under no N fertilizer were lower than those differences under N fertilizer application for both crops, showing that management of the N fertilizer application and plant population pattern in intercropping field is an important factor in cereal-legume intercropping, cereal crops form relatively higher canopy structures than legume crops, and the roots of cereal crops grow to a greater depth than those of legume crops. This indicates that the component crops probably have differing spatial
[Table 5.] interaction mean comparison cropping system × nitrogen in maize
interaction mean comparison cropping system × nitrogen in maize
and temporal use of environmental resources, such as radiation, water and nutrients (Willey 1990). Therefore, this cropping system may help to improve productivity of low external input farming, which depends largely on natural resources and inherent soil fertility.
Results of LER showed that for bean, the difference among different intercropping patterns for no N application, and also for 100 kg N/ha application were not significant, but for 200 kg N/ha M1B1 there was a significantly higher LER. On the other hand, the LER for 200 kg N/ha applied to bean was higher than that for other N applications. For all nitrogen fertilizer levels in maize, B3M1 showed the highest LER, but its difference with M1B1 was not significant under 100 kg N/ha and no N application. Results of total LER for both crops showed that under 100 and 200 kg N/ha the highest LER was determined for M1B1, and under no N fertilizer application it was determined for M2B3. As can be seen from Fig. 3, based on LER calculations, the best intercropping systems is M1B1.
Total LER and maize LER increased, but bean LER decreased with respect to increasing levels of nitrogen application. Yield advantage occurs because growth resources such as light, water, and nutrients are more completely absorbed and converted to crop biomass by the crops over time, due to the differences in their competitive ability for growth resources, allowing the exploitation of differing characteristics, such as rates of canopy development, final canopy size (width and height), photosynthetic adaptation of canopies to irradiance conditions, and rooting depth (Lithourgidis et al. 2011).
Studies obtained different results of applying intercropping systems and N fertilizer levels. Tsubo et al. (2003) reported that the total LERs for yield and growth showed yield and growth advantages for intercropping. They showed that the intercropping of maize and beans had both radiation and water use efficiencies (RUE and WUE) as high as maize sole cropping, and intercropping RUE and WUE were greater than bean sole cropping, and finally they concluded that maize-bean intercropping can be recommended to small-scale farmers in this semi-arid region. Results of Ofori and Stern (1986) showed that the growth, yields and N uptake of maize and cowpea were significantly reduced by intercropping. Maize was the dominant component and affected cowpea more than the effects of cowpea on maize. Compared to sole crops, intercropping, on average, reduced maize grain yields by about 18% and cowpea seed yield by about 45%. With increasing nitrogen, maize grain yields in the sole crops and in the intercrops cowpea yields declined. Intercropping
efficiency, in terms of LER, declined with increasing levels of N, following the trends in cowpea yields. In the study of Baker and Blamey (1985) sorghum grain yield and N uptake increased markedly with N fertilization, responding similarly to applied N in the sole crop and intercrop systems.
Applied N increased soybean grain yield and N uptake when grown as a sole crop, but not when grown as an intercrop with sorghum. Intercropping slightly reduced sorghum and soybean N uptake and also yield at each N level. At each N level, intercropping offered a substantial (mean 17%) grain yield advantage over an equivalent area of sole crops. Apparent recovery of applied N was greatest in sole sorghum, and least in sole soybean, which was attributed to considerable substitution of fertilizer N for fixed N2. Apparent recovery of applied N in the intercrop was intermediate between the sole crop systems (Tsubo et al. 2003).
Overall, from this study, it can be concluded that M1B1 is the best intercropping system, and that application of N fertilizer can be effective in intercropping agriculture for the attainment of higher yields.