Global climate change and abnormal climate phenomena have fundamentally affected agriculture around the world. For this reason, there is a strong need for countermeasures that extensively utilize agriculture-related information. To accomplish this, space-based remote sensing offers a number of advantages, including regular data gathering, fast data processing, and integration into existing geo-information systems to support robust decision making in the early warning stage. However, the high variability of spectral responses according to differences in crop species, growth stage, health condition, soil, water contents, and microclimate hampers the application of remote sensing to agriculture. Recent satellite missions such as RapidEye, WorldView, and GeoEye have opened up new perspectives by offering very fast revisit rates (up to once per day) on the same area as well as characteristic spectral features. In particular, it is believed that the red edge band (690-730 nm) of the RapidEye sensor allows better estimates of chlorophyll content for crop monitoring.
In South Korea, agricultural lands are mostly operated by private farmers on a small parcel level, which means that the seeding, crop dusting, and harvest periods often differ. As well, the crop condition usually depends on the individual owner’s management skill. This means that it is difficult to gain an overview of changing crop conditions and to construct the database necessary for disease management, production estimation, and compensation measures on a regional or national level. There is a great need to apply remote sensing technology to the mapping of crop areas as well as the monitoring of crop conditions (Xiao et al. 2005, Gumma et al. 2011), but the availability of multi-temporal, high spatial resolution satellite image data has been too limited to satisfy the active demands of research as well as of practice.
This study aims to determine whether the moderate spatial resolution of moderate resolution imaging spectroradiometer (MODIS) could reflect the seasonal change of small rice crop fields in Korea, and to evaluate its differences compared with the high resolution RapidEye in terms of the spectral reflectance. We also examined how precisely the red edge spectral band in RapidEye multispectral sensor can discriminate the different rice growth stages.
The region of the study area is located in the southwest of South Korea. It covers 1,300 km2 from 35.53ºN / 126.45ºE (UL) to 35.39ºN / 127.05ºE (LR), and is characterized by relatively wide plains with a moderate oceanic climate. Kimje Province, where the study area is located, is renowned for its rice paddy-dominated agriculture, and produces 1/40 of the national rice yield. The readjusted partitions of agricultural land mostly correspond to rice paddies. Residential areas are generally located near hills, and neighboring areas are cultivated with vegetables on a very small scale.
Two kinds of satellite data were used: MODIS and RapidEye. The MODIS data, collected from January to December 2011 over South Korea, were acquired by EOSDIS (NASA’s Earth Observing System Data and Information System). The MOD09GQ level-2 product is the atmospherically corrected surface reflectance. Although atmospheric effects with high temporal variation were corrected, the bidirectional effects induced by the relative observational geometry remained. This should be corrected, particularly to compare multi-temporal low-resolution image data. The bidirectional reflectance distribution function (BRDF) model based on a semi-empirical RossThick LiSpare kernel was applied to correct surface anisotropy effects (Roujean et al. 1992, Wanner et al. 1995, Lucht et al. 2000). In the case of MODIS BRDF products, the Nadir BRDF-adjusted reflectance (NBAR) was estimated using 16-day composite images with at least seven cloud-free observations. These products were retrieved every 10 days. In this study, we adopted the same MODIS NBAR algorithm, but estimated NBAR products daily in order to derive the temporal variation characteristics of the growing vegetation.
RapidEye images were acquired on July 19 and September 22, 2011. To avoid potential distortion from radiometric resampling to a 5-m pixel size (on level 3A), product type 1B was used. This only involves radiometric and sensor corrections. The satellite scene for July for the study area included some clouds and their shadows, but was free of haze. The image for September was recorded under clear weather conditions without any cloud. For the calculation of surface reflectance, top of atmosphere (TOA) reflectance was computed by converting digital number to radiometric values with the presented scale and offset value. Then, the estimated TOA reflectance was corrected with a 6S (Second Simulation of a Satellite Signal in the Solar Spectrum vector) atmospheric correction model by inputting sensor and solar observation geometry, spectral response functions, and the other atmospheric conditions for surface reflectance (Vermote et al. 1997).
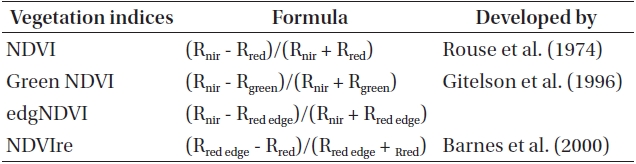
The analysis in this study consisted of three parts. First, we studied whether the annual spectral differences could be detected according to crop and land-cover types using relatively low-resolution MODIS data. Second, the spectral reflectance data derived from MODIS and RapidEye on the same day were compared to verify the spectral characteristics according to the spatial resolution. Third, several vegetation indices (VIs) adopting RapidEye’s multi-spectral bands were examined to see if they could reflect the rice crop field status (Table 1).
For the analysis of annual change in the normalized difference vegetation index (NDVI) using MODIS, we selected 53 representative pixels for rice, rice?barley (double cropping), reservoir, forest, and urban areas, and then traced their values on 350 images. As the monsoon season in the summer of 2011 produced extreme rainfall, the NDVI pixels affected by clouds and wet surface conditions (especially after precipitation) still remained, despite the atmospheric and BRDF corrections. In this case, the NDVI showed very low values. Therefore, we applied the multi-temporal NDVI correction based on a multi-regression method. First, NDVI values were calculated using a 5th polynomial regression. Then, the original NDVI values were compared with the newly calculated values. When the new
[Table 1.] Spectral vegetation indices used in this study.

Spectral vegetation indices used in this study.
NDVI value was lower than the original NDVI, the original value was chosen. When it was higher, the new NDVI value was chosen. For this NDVI correction, it was assumed that the higher NDVI value was closer to the real value when different values retrieved at the same time were compared. The reason for this assumption is that existing vegetation cannot be detected, due to clouds or shadows for example, whereas non-existing vegetation cannot be detected by remote sensing. This process was performed seven times.
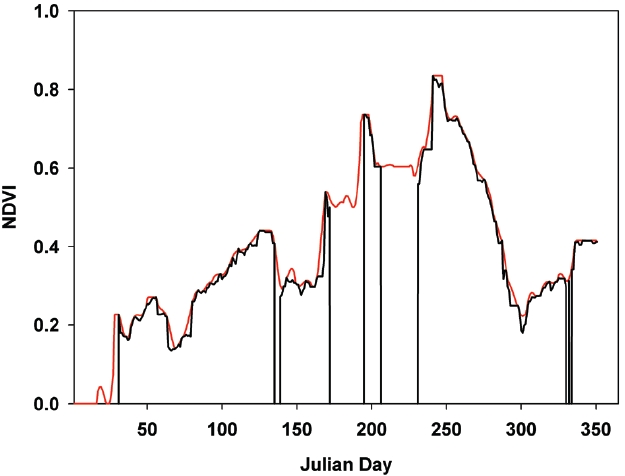
Fig. 1 shows an example of the NDVI correction over one of the rice paddies in the study area. The corrected NDVI (red) has higher values than the original NDVI, in which some low peaks were observed (contaminated pixels). On the other hand, the corrected NDVI showed a stronger intuitive temporal variation pattern compared with the non-corrected original NDVI (black).
In contrast to MODIS, the high spatial resolution of RapidEye enabled us to estimate the spectral changes in rice crops according to their growth status in more detail on the homogeneous paddy level. Paddy areas were categorized into four crop types based on different rice-seeding periods: paddy A (rice?barley double crop; late rice seeding), paddy B, paddy C and paddy D (early rice seeding, early harvest). The training areas for each crop type were set up on both RapidEye images (July and September), and the mean values of four VIs in each training area were calculated. The total number of training sites was 82.
4.1 Annual NDVI (Derived from MODIS Data) Changes in Agricultural Areas
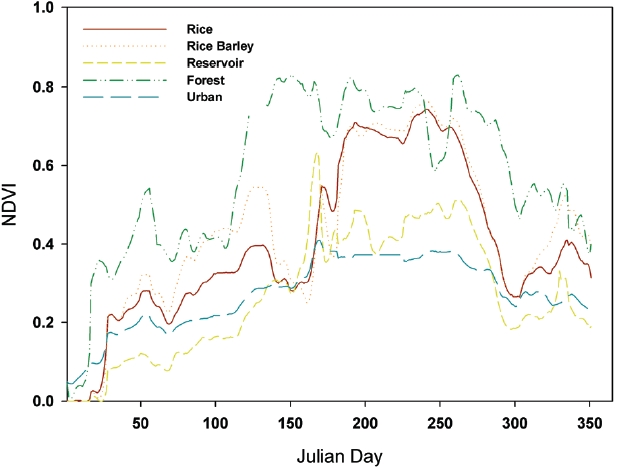
The annual changes in NDVI for five land-cover types; namely, rice, rice?barley (double crop), reservoir, forest, and urbanized areas, were detected from the MODIS data. As Fig. 2 shows, forest areas generally had the highest values over the whole year, and the NDVI of cultivated agricultural areas reflected crop growth. From the beginning of June to the end of October, rice and rice?barley double crop areas showed similar NDVI values. However, there was a significant difference from March to May, during which time barley was grown and harvested. This result showed that the NDVI derived from MODIS image data could be applied to detect different crop species and conditions based on the multi-temporal information. However, the problem of relatively low spatial resolution compared with the general parcel units in Korea (ca. 0.03-0.05 km2) is still a limitation.
4.2 Comparison of NDVI from MODIS and from RapidEye
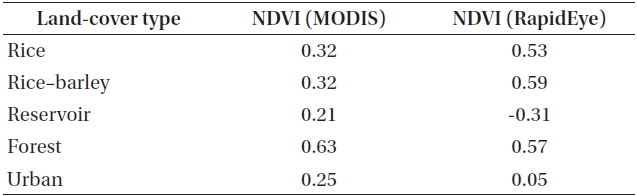
To study variations in NDVI’s reflection of field status according to the spatial resolution, the mean values of NDVI from MODIS and from RapidEye satellite image data were compared for five land-cover types; namely, rice, rice?barley (double crop), reservoir, forest, and urban (Table 2). There were 54 sample sites in total. Because of the cloudy weather conditions on 19 July, the spectral values were affected differently on representative pixels of MODIS and RapidEye by the high reflection of clouds. For this reason, a direct comparison of NDVI values in July was not useful. Thus, the following comparison is based on the MODIS and RapidEye satellite data recorded on 22 September.
[Table 2.] The mean NDVI values derived from MODIS and RapidEye.

The mean NDVI values derived from MODIS and RapidEye.
The NDVI values of RapidEye for rice and rice?barley double cropping paddy areas were lower than those of MODIS. In contrast, MODIS had higher NDVI values for reservoir, forest, and urban areas; the NDVI differences were significantly larger for reservoir and urban areas, but relatively smaller for forests. We supposed that the higher NDVI values derived from MODIS for reservoir and urban areas were caused by its lower spatial resolution, as it partially reflects other vegetation covered land use types. Compact and small-scale land use can be resolved by the 250 × 250-m-pixel resolution of MODIS. To summarize, because of its lower spatial resolution, MODIS data showed moderate NDVI values among different land-cover or crop types compared with RapidEye data, which reflects its more distinguishable spectral characteristics based on homogeneous land units.
4.3 Relation between VIs and Rice Crop Status
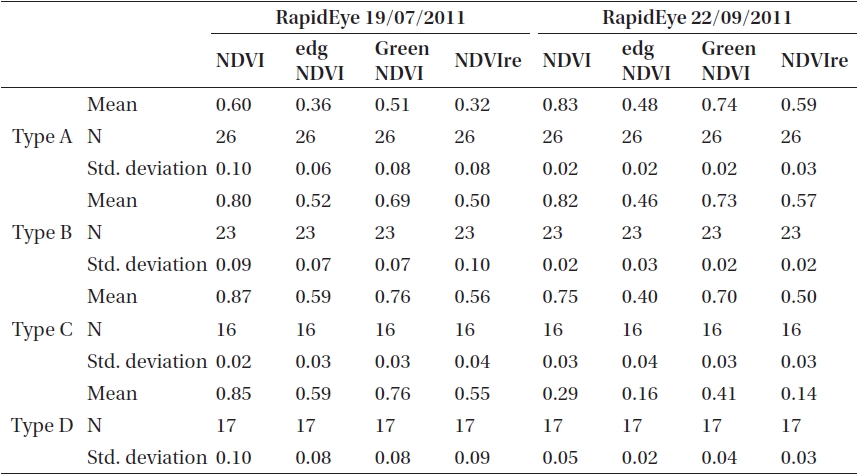
The temporal tendencies of VIs were observed among four rice crop types. As shown in Table 3, the four VIs had similar spectral tendencies. The rice?barley double cropping paddies (crop type A) have clearly lower VIs in July
[Table 3.] The mean of vegetation indices relating rice crop types.
The mean of vegetation indices relating rice crop types.
and higher values in September compared with other rice crop types. Corresponding to this, the rice crop types B, C, and D had higher VIs in July and lower values in September. In particular, rice crop type D (early seeding) showed distinctively low VIs in September because it was already harvested at this point. Its VIs in July were slightly higher than those of types B and C. In comparison with crop types A and D, the difference in VIs between crop types B and C was relatively small. The VI values for rice crop type B were lower in July and higher in September than those for crop type C.
The temporally different mean values of VIs among rice crop types could be explained by differences in seeding time for crop type D compared with those for types C, B and A. Early-seeded rice paddies showed slightly faster crop growth in July, corresponding to slightly higher VIs, and a more mature status in September, corresponding to slightly lower VIs. However, no statistically significant differences in VIs derived from RapidEye’s July imagery could be verified between rice crop types C and D, or from NDVI data between crop types B and D. In September, except for edgNDVI, the VIs did not show statistically significant differences between rice crop types A and B.
On this basis, we concluded that in general, VIs are applicable to detect a growing rice crop status, but there was a slight limitation for differentiation between short-term rice-planting periods, such as crop types A and B in September and crop types C and D in July. The VI adopting the red edge band of RapidEye, i.e., edgNDVI, could better detect the rice crop status than the traditionally used NDVI. We assumed that these findings were related to the “red edge effect.” In vegetation areas, the low spectral reflectance in the red region was immediately followed by high reflectance in the near-infrared. This steep increase in reflectance in the 690-730 nm regions, known as the red edge, depends on the chlorophyll concentration. As the chlorophyll concentration increases, the absorbency in the red region also increases, and the spectral range where the absorption takes place becomes slightly wider. This causes the red edge to move toward longer wavelengths (toward the near-infrared), and causes its slope to decrease (Cibula & Carter 1992, Fiella & Penueals 1994, Eitel et al. 2011).
This study showed that the NDVI represented the rice crop status differently according to the spatial resolution of the satellite image data, i.e., the NDVI values of rice paddy areas were smaller in MODIS than in RapidEye. The spectral reflection values became more moderate with decreasing spatial resolution, and the VI was less functional as an indicator of rice crop status. The reason is that a pixel of moderate or low spatial resolution can hardly be homogeneous, as it partially reflects other land-cover types. This is a particular problem in Korea, where the land-use patterns are compact and small in scale. However, satellite missions with a short revisit time have greater applicability due to their ability to detect different crop types based on their annual spectral changes. For this reason, new kinds of satellite missions such as RapidEye, which offer a short revisit time as well as high spatial resolution on a wide area, open up new possibilities for agriculture monitoring in Korea, as well as in other Asian countries, where land is commonly cultivated on a small scale by farmers. In addition, the comparison of the traditional and widely used NDVI with other VIs adopting the red edge band of RapidEye showed that the vegetation indices have similar spectral tendencies, but the edgNDVI is statistically better able to detect the rice crop status than the traditionally used NDVI.