The instruments for the study of space storm (ISSS) is determined for next generation small satellite-1 (NEXTSat-1) to be launched in 2015-2016 and observes the space storm which occurs when the solar activity is in declining phase rather than the solar maximum. The space storm is the fluctuation in near-Earth space caused by an abrupt change of the solar activity such as the solar flare or coronal mass ejection. According to many studies, it is known that the space radiation storm occurs when the solar activity is in declining phase. The ISSS has the purpose of understanding the capture and decline of solar energetic particles at the radiation belt and the ionospheric storm which occurs when there is a geomagnetic substorm.
The Van Allen radiation belt is the region where the energetic particles are trapped by the Earth's magnetic field. It was found in 1958 by Explorer I and II of the United States equipped with the Geiger counter. A lot of studies have been conducted in relation to the radiation belt which is capturing the energetic charged particles. Also, it has continuously been the subject of study in both scientific and engineering aspects such as the way the particles are captured and declined in the radiation belt, the effects of these particles on the space activity such as the spacecraft, and the research related to the satellite operation (Van Allen et al. 1958, Freden 1969, Friedel et al. 2002, Horne et al. 2005, Selesnick et al. 2010). On the other hand, it is known that the cosmic ray flux which is the major source of space radiation decreases as the coronal mass ejection propagates
toward the Earth (Oh 2008). This decrease may determine the global phenomena depending on the propagation direction of the coronal mass ejection (Oh et al. 2008, Oh & Yi 2009). And in some cases, the cosmic ray flux observed on the ground increases abruptly, and this is related to the solar energetic particles (Oh et al. 2010). It was found that the increased cosmic ray flux around the Earth is fatally dangerous to the astronauts as well as the spacecraft (Oh et al. 2012). Hence, there is a great need for the study of the solar energetic particles.
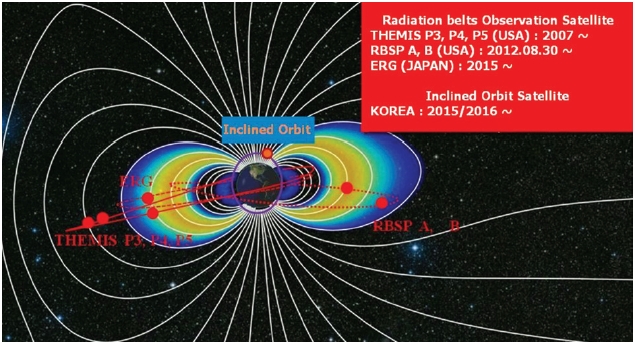
The 2015-2016, when the NEXTSat-1 is to be launched, is the time when the solar activity is in declining phase and is optimal for the observation of space storm. As shown in Fig. 1, the time history of events and macroscale interactions during substorms (THEMIS) P3, P4, and P5 satellites operated by the United States since 2007, radiation belt storm probes (RBSP) A and B satellites launched on 30 August 2012, and energization and radiation in geospace (ERG) satellite to be operated by Japan from 2015 all have elliptical orbits on the equatorial plane and are the radiation belt observation satellites which observe or are expected to observe the radiation belt. The NEXTSat-1 is the low earth orbit satellite operated at an altitude of 500-800 km. And it is the sunsynchronous polar orbit satellite which has the noon-midnight orbit. A number of foreign satellites will be operated bythe NEXTSat-1 is to be launched, and numerous data from the satellites can help to understand the formation and decline of solar energetic particles at the radiation belt.
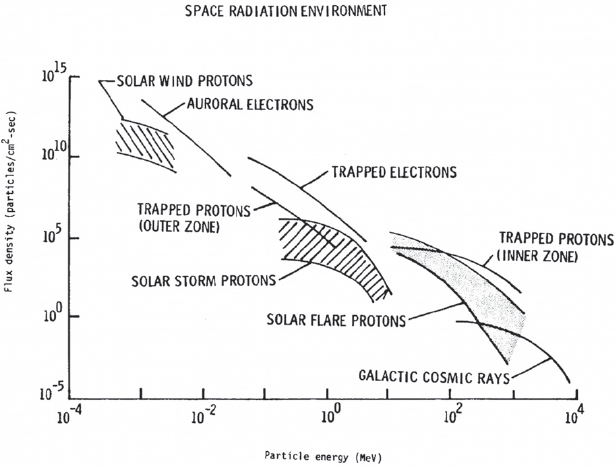
The solar proton telescope (SPT), which is determined as one of the scientific instruments to be installed in the ISSS, is the instrument that acquires the information on the energy and flux of proton according to the solar activity in the space radiation environment. Especially, the proton from the solar flare is an important source of the particle that we are trying to measure. Fig. 2 compares a lot of
information such as the components and energy band of the particles originating from the space and the Sun, and the particles that are captured in the radiation belt. As shown in Fig. 2, the energy range of the particle is about 10-1,000 MeV and the flux has the range of 1-106/(cm2-sec). But there are only few solar energetic protons in the range of 100-1,000 MeV. Therefore, the purpose of the SPT that we design is to measure the solar energetic protons in the range of 0.6-100 MeV. For the channels P1-P3 which are the range of less than 20 MeV, the proton energy was distinguished using linear energy transfer (LET) to compare with or discriminate from relativistic electron, and above those channels, the energy was determined on the basis of whether silicon semiconductor detector (SSD) signal can pass or not.
The payloads such as the medium energy proton and electron detector (MEPED) of polar orbiting environmental satellites (POES), the energetic particle sensor (EPS) of geostationary operational environmental satellite (GOES), and the proton/electron telescope (PET) of Solar, Anomalous, and magnetospheric particle explorer (SAMPEX) are typical high energy particle detectors. They measure the electrons and protons or in some cases, the electrons, protons, and alpha particles. In the case of Korea, the high energy particle detectors installed in existing satellites are the high energy particle telescope (HEPT) of KITSAT-3 and the high energy particle detector (HEPD) of KOMPSAT-1. These equipments were also intended to measure the electrons, protons, and alpha particles. These equipments were successfully loaded to each satellite, but the operation of the equipments was not successful. The SPT that is conceptually designed in this paper is the first proton detector which is determined as the payload of the satellite in Korea. In addition, the components of the particles captured in the radiation belt are divided into the galactic cosmic ray (GCR) and solar cosmic ray (SCR). The GCR is known to be caused by supernova explosion outside the solar system. The GCR has the energy range of about 100 MeV-10 GeV and the SCR has the energy range of about 10 MeV-1 GeV, which are mostly composed of protons. We will design the detector that measures the solar energetic protons among the particles captured in the radiation belt.
2. SIMULATION USING THE GEANT4
We used geometry and tracking 4 (GEANT4) to determine the specification of the SPT. The GEANT4 was developed in the 1970's, led by European Organization for Nuclear Research (CERN), to simulate the physical activity of the secondary particles generated from large hadron collider (LHC) which is the experimental facility (i.e., particle accelerator and collider) for finding a secret on the formation of the universe by reproducing the big bang which is the situation right after the formation of the universe via colliding two particle beams at nearly the speed of light. In addition, the GEANT4 is the simulation program which tracks the change of state such as the energy, path, and momentum of the incident particle and the change of the path and movement of the secondary particles newly generated through the process according to the interaction between the incident particle and matter based on the physical theory and practical experimental result data, and shows the results as the multi-dimensional image. This program used Fortran language on the basis of Monte-Carlo method, but later it was converted and reconstituted as C++ language which is based on object oriented technology (OOT) (Allison et al. 2006).
In addition to the original purpose, the particle and nuclear physics, the GEANT4 is currently applied to the physical experiments and research activities in various fields such as high energy physics, astrophysics, space science, medical physics, and radiation protection. Especially, it is widely used in the space science field such as the space electronic products, space science detector system, radiation risks simulation for the astronauts, planetary exploration application, linkage to the space environment analysis tool such as SPENVIS, analysis of cosmic ray propagation in the magnetosphere, and micro-dosemetry.
For performing the simulation, we used GEANT4 (9.5.p01 version) and Linux-based operating system. We used the commercial compiler (MS Visual Studio) and Class Library for High Energy Physics (CLHEP, 2.1.2.4 version) with the purpose of physical computation. For the process associated with physical reaction, the standard electromagnetic model which is the most typical mode among the models describing the physical process related to proton was used. The OpenGL graphic driver was used for the visualization which is basically configured in GEANT4. The definitions of the basic physical phenomena included in GEANT4 were appropriately modified according to the simulation planned to be carried out. The standard of experimental space, the standard and position of SPT, and the matter were defined and used. In addition, the SSD was set as the silicon panel, and numerous simulations were performed to obtain an optimal result.
The high energy particle incident on a medium loses the energy by the reaction with the medium. In the area that the SPT measures, this LET is the area where it gradually decreases as the energy increases, and given by the Bethe formula (Bethe & Ashkin 1953).
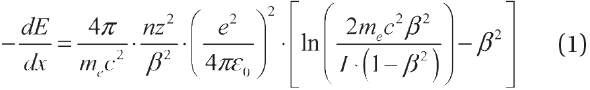
where
The proton passes through the sensor of the SPT mechanical structure and transfers energy to the bound electrons of silicon by the Coulomb interaction. If the energy loss difference according to the trajectory difference is ignored, the amount of energy in Eq. (1) is approximated by Eq. (2).
where
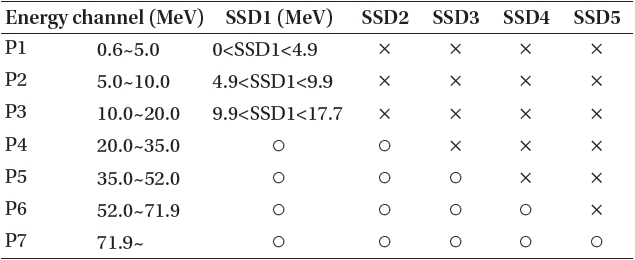
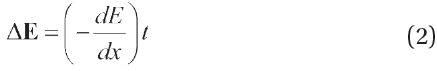
Table 1 shows the energy channels and channel determination criteria for the SPT, and the SSD signal of each energy channel. We performed the GEANT4 simulation to determine the specification of SPT, and for
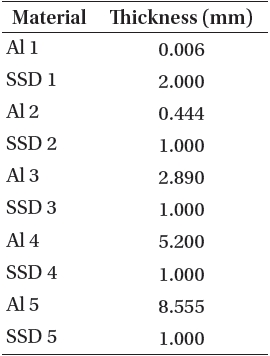
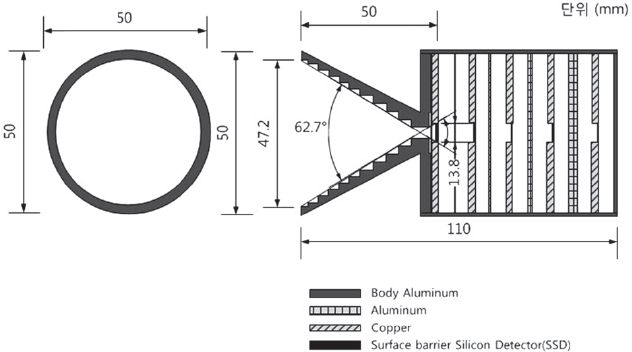
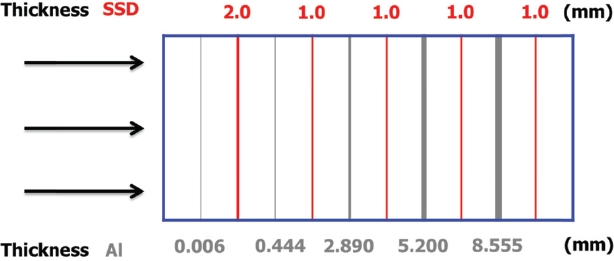
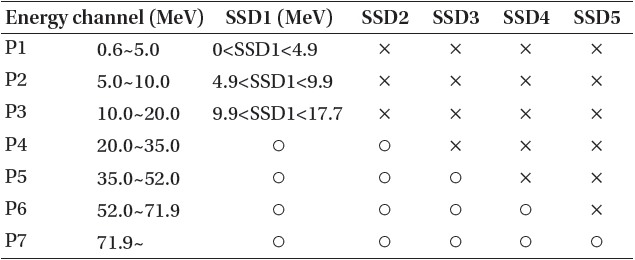
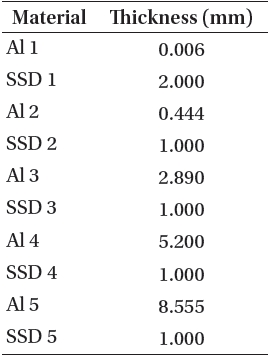
determining the channel of the detector, the arrangement structure was designed to have the blocking material (aluminum [Al]) and 5 sheets of SSDs as shown in Fig. 3. The SPT detects the electrical signal made by the particle incident at a limited angle due to the mechanical structure of the telescope which passes through the 5 sheets of SSDs (SSD1, SSD2, SSD3, SSD4, and SSD5) arranged in a cylinder type mechanical structure at the back of the telescope and transfers energy to make an electrical signal. Fig. 4 and Table 2 show the structure of the SPT obtained from the simulation results which represent the arrangements of the SSDs and blocking material (Al), and numerical values according to the order that the proton passes through. As shown in Fig. 4, the blocking materials made of Al with the thickness of 0.006, 0.444, 2.890, 5.200, and 8.555 mm are inserted between the 5 sheets of SSDs to distinguish the type and energy of the incident particle. The values in Table 2 were obtained using the brute-force method considering the energy of the incident particle and the energy deposited in the medium.
According to International Commission on Radiation Units and Measurements (1970), the LET of a charged particle in a medium is expressed by dE/dx, and dE is defined as the average energy transferred to the medium by the particle while traveling a distance dx. In the SPT structure, the number of channels was adjusted by placing the blocking material, Al between the SSDs. Here, the
[Table 1.] SSD signal of energy channel of SPT on ISSS.
SSD signal of energy channel of SPT on ISSS.
[Table 2.] Structure material and thickness of SPT on ISSS
Structure material and thickness of SPT on ISSS
average energy transferred to the medium by the particle relative to a travel distance is equivalent to the energy deposited in the medium. In addition, the value for the range of the channel was determined by adjusting the thickness of Al. For the linearly increasing SSD1, the energy will be measured according to the LET by making three channels, and for the rest of the SSDs, the energy will be measured by the flux of the particle collected from the channel for each SSD.
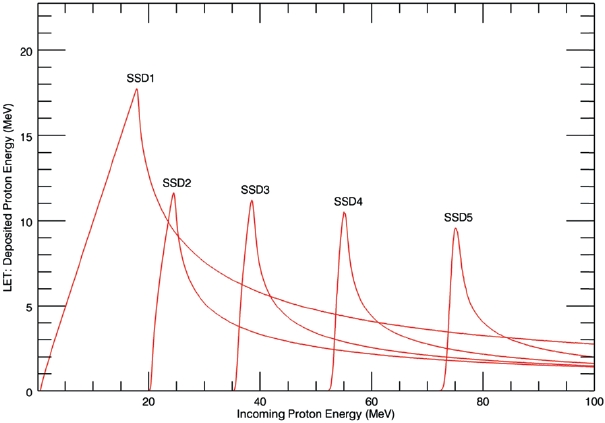
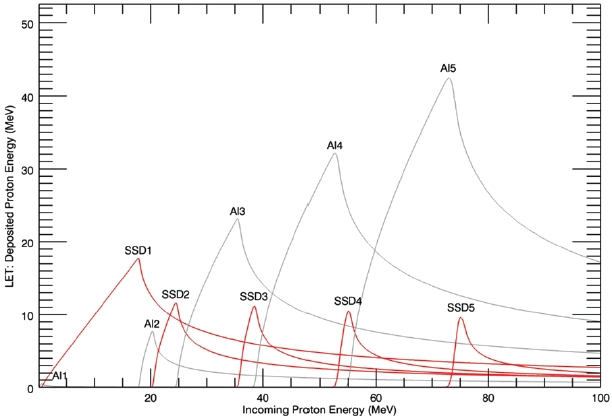
Figs. 5 and 6 are the LET simulation results of energetic proton for the range of 0.6-100 MeV using GEANT4 at the SPT structure in Fig. 4 and Table 1. The values of deposited energy were different depending on the arrangements order and the energy of the incident particle. Also, when the Al1 and Al5 were compared, the values of deposited energy were different depending on the thickness. Fig. 6 shows only the results of the SSDs by eliminating the blocking material, Al from the arrangements of SSD and blocking material in the simulation results of Fig. 5.
If the intensity of the flux incident on SPT is isotropic, the
coincident counting rate (C) is expressed by Eq. (3).

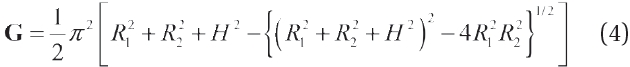
where I is the proton flux and G is the geometrical factor which is defined according to the position and width of the detector and detector sensor. The geometric structure of SPT is determined according to G, and if the geometric structure of SPT is simplified and assumed to be the symmetrical cylindrical detector as shown in Fig. 2 of Sullivan (1971) which has the two planes of different diameters, the geometrical factor of a typical detector is given by Eq. (4) according to Sullivan (1971).
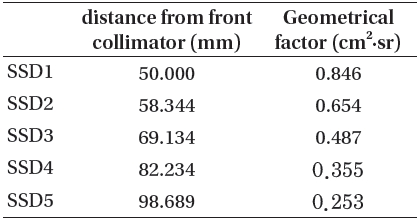
[Table 3.] Geometrical factor varying with the distance between collimator and SSD

Geometrical factor varying with the distance between collimator and SSD
Where
When the T-mount SSD of ORTEC with the same radius of 6.9 mm is used for SPT, the geometrical factor, which is calculated by coincident counting rate, is determined by the radius of collimator aperture, the radius of SSD, and the length interval of collimator. Table 3 shows the values of geometrical factor depending on the distance between the collimator and SSD. Based on the front collimator aperture, the distance is marked according to the arrangement of SSD. The reference position of the collimator is the front part of the collimator which has the diameter of 47.2 mm. The distance from the collimator to the SSD is calculated using the thickness of the T-mount from ORTEC which is 7.9 mm, and the blocking material. The space was not left between the SSD and blocking material to increase the detection efficiency of the detector except for the space occupied by the T-mount and blocking material. The geometric structure of SPT was designed on the basis of the above consideration and it is shown in Fig. 7. It is found that the value of geometrical factor decreases as the distance from the front collimator increases depending on the arrangement of SSD.
The ISSS is determined for NEXTSat-1, which is to be launched in 2015-2016, with the purpose of observing the space storm that occurs when the solar activity is in declining phase. It is expected the observation of space storm will help to understand the formation and decline of energetic particles during space storm, and the formation of the radiation belt. The SPT that we are trying to develop is the instrument which acquires the information on the energy and flux of proton according to the solar activity in the space radiation environment. In addition, the proton energy was distinguished using LET for the channels P1-P3, and above those channels, the energy was determined on the basis of whether SSD signal can pass or not. For designing the SPT, a number of calculations and simulations were performed such as the geometrical factor, field of view, and Passage of radiations through matter LET. With the use of GEANT4, we adjusted the energy detection range using the blocking material, Al and determined total 7 channels (0.6~5, 5~10, 10~20, 20~35, 35~52, 52~72, and >72 MeV) for the energy range of SPT. The conceptual design of SPT which uses the SSD was performed and the SPT which has the structure shown in Fig. 7 was designed. The designed SPT will improve the understanding on the capture and decline of solar energetic particles at the radiation belt by measuring the proton.


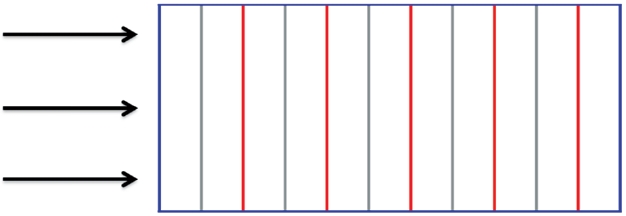
![Structure of solar proton telescope on instruments for the study of space storm (red: semiconductor detector [SSD], gray: aluminum [Al], blocking material).](http://oak.go.kr/repository/journal/11793/OJOOBS_2012_v29n4_343_f004.jpg)