The three magnetometers (Fluxgate, Overhauser Proton sensor, and magneto-impedance [MI] sensor) for measuring the geomagnetic field were installed in 2009 at Bohyunsan Optical Astronomy Observatory in Yeongcheon, Gyeongbuk and have been operated by the Korea Astronomy and Space Science Institute. Among all the three magnetometers installed at Bohyunsan Optical Astronomy Observatory, the fluxgate magnetometer (RFP-523C) measures the 3-axis component values (H, D, and Z) of the geomagnetic field with an interval of a second. This study investigates the general characteristics of the geomagnetic field in the mid-latitudes through the statistical analysis of the data obtained from the fluxgate magnetometer. The latitude, longitude, L and altitude for the geological location of the magnetometer at Bohyunsan Optical Astronomy Observatory (BOH magnetometer) are N36.2°, E128.9°, L = 1.3, and 1,224 m, respectively. The measured geomagnetic field data are recorded on the basis of universal time, and it is operated on a 24 hours a day basis (Hwang et al. 2011).
This paper extends the results of Hwang et al. (2011) which performed the first statistical analysis of the data obtained during 2008 and 2009 from the magnetometer installed at Bohyunsan. The diurnal, seasonal, and annual variations of the mid-latitude geomagnetic field were examined for the international quiet days (IQDs) using the data obtained from the fluxgate magnetometer during 2008-2011. This is intended to minimize the effects from the transient variations of the space environment because the geomagnetic field variation is both directly and indirectly influenced by the solar activity. The BOH magnetometer data are used to monitor the space environment in real time at the Space Weather Prediction Center, and used as the experimental value for calculating the K-index which is one of the space environment indices (Takahashi et al. 2001). In addition, the magnetometer data can be used as the index for cosmic radiation in the aircraft which is under the influence of the space environment (Hwang et al. 2010).
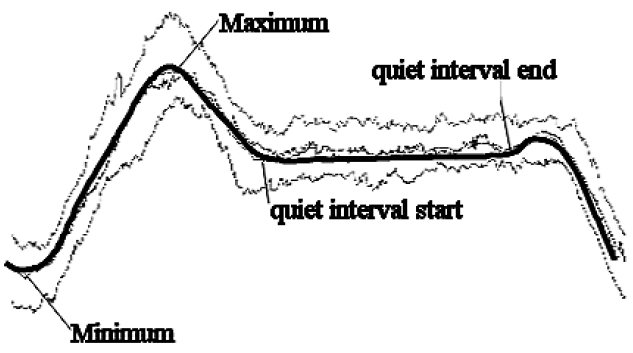
This study was conducted to supplement the results of “Mid-latitude geomagnetic field analysis using BOH magnetometer: preliminary results” (Hwang et al. 2011) which performed the first statistical analysis using the BOH magnetometer data. The main difference between the two studies is that the previous research was performed for the entire days during 2 years (2008-2009), while this research was carried out for the IQDs during 4 years (2008-2011). This study is to examine the general characteristics of the geomagnetic field in the mid-latitudes when the solar activity is relatively weak, then also the effects of the transient solar and space environment. Hence, the data from the fluxgate magnetometer at Bohyunsan were analyzed for the selected 5 days (Q1, Q2, Q3, Q4, and Q5) per each month when the solar activity is the weakest in the IQDs during the 4 years (2008-2011) (regarding the IQDs’ selection, refer to http://www.ga.gov.au/oracle/geomag/iqd_form.jsp). In the figures shown below, the red line is the median, the blue line at the bottom is the 1st quartile, and the blue line at the top is the 3rd quartile. In each graph, the criteria for the minimum, maximum, start point of the quiet interval, and end point of the quiet interval are identical to the previous paper. The minimum was defined as the smallest value in the graph and the maximum was defined as the largest value in the graph. The start point of the quiet interval was defined as the initial point where the gradient is rather drastically changed following the minimum or maximum, and the end point of the quiet interval was defined as the initial point where the gradient is rather drastically changed following the start point of the quiet interval (Fig. 1).
2.1 Diurnal Variation of the Geomagnetic Field
To examine the geomagnetic field variation, the daily averages for the three components of the geomagnetic field were calculated at each time, and every second, the deviation from the measured values were defined as dH, dD, and dZ. In other words, dH =
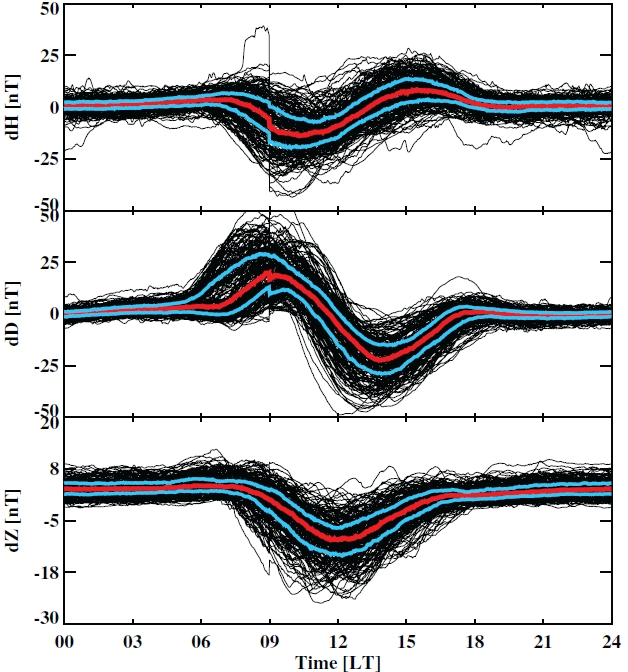
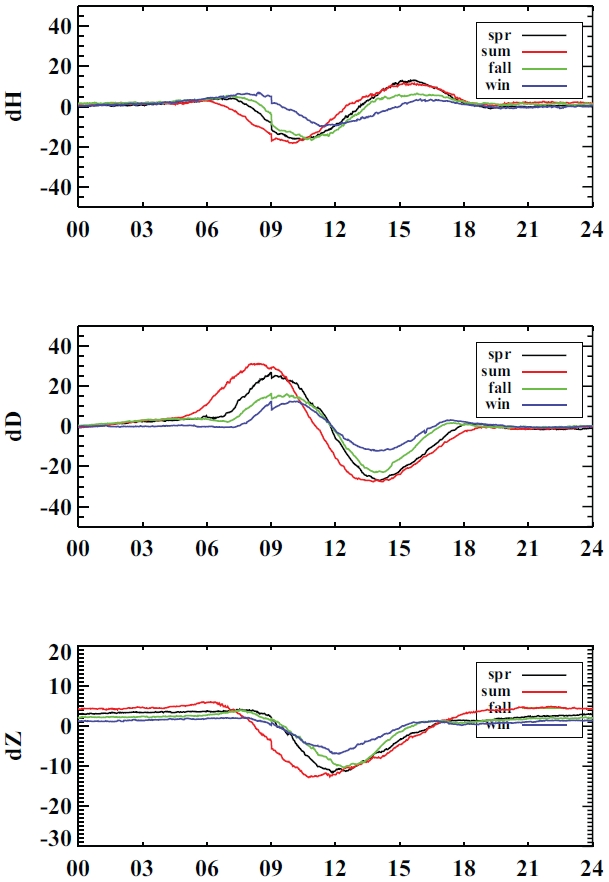
For the statistical analysis, a Superposed Epoch Analysis was performed which shows the data of all the days within a graph. As shown in Fig. 2, the diurnal variation of each component has similar trend for all the days. Fig. 2 is made by superposing the diurnal variation of the geomagnetic field for the IQDs during 4 years (2008-2011). Based on the median marked with the red line, the minimum for the H component of the geomagnetic field is at 10:18, the maximum is at 15:30, the start point of the quiet interval is at 18:42, and the end point of the quiet interval is at 07:18 (on
the basis of Local Time).
Compared with the position of the sun, the minimum is about 2 hours before the culmination of the sun and the maximum is about 3 hours after the culmination of the sun. And the interval between the start point of the quiet interval (18:42) and the end point of the quiet interval (07:18) is similar to the interval between the sunset and sunrise. This value is comparable to the results of Hwang et al. (2011). For the D component, the minimum is at 13:54 and the maximum is at 08:54, which shows the opposite trend for the minimum and maximum times when compared with the H component. However, the quiet interval for D component is similar to that for the H component with the start point at 17:21 and the end point of the quiet interval at 06:30. In the case of the Z component, the minimum is at around 12:00 when the culmination of the sun occurs, and the maximum is not noticeable. However, the start point of the quiet interval is at 16:24 which is the earliest and the end point of the quiet interval is at 08:00 which is the latest. Hence, the duration time of the quiet interval is the longest at the Z component. By analyzing the three components, we found that the values of the geomagnetic field change depending on the position of the sun. The values change in regular time intervals though it is not exactly the same as the sunrise-culmination-sunset times. This general trend is consistent with the previous results which investigated the entire days during 2008-2009 (Hwang et al. 2011).

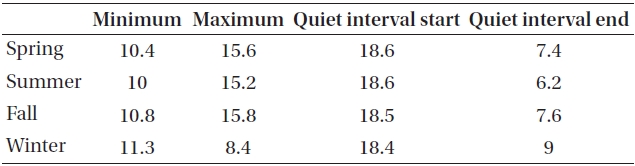
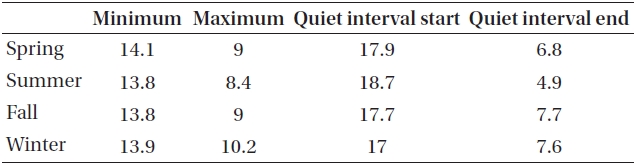
Seasonal variations of four points (minimum, maximum, quiet interval start and end) of H component (2008~2011).
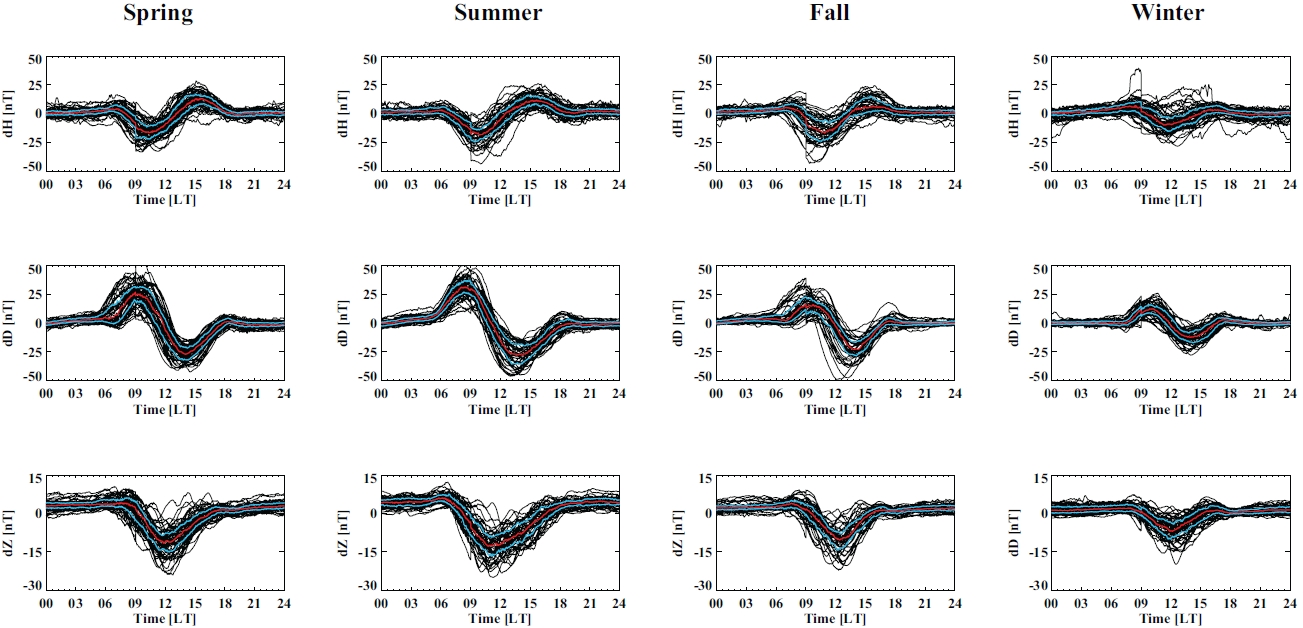
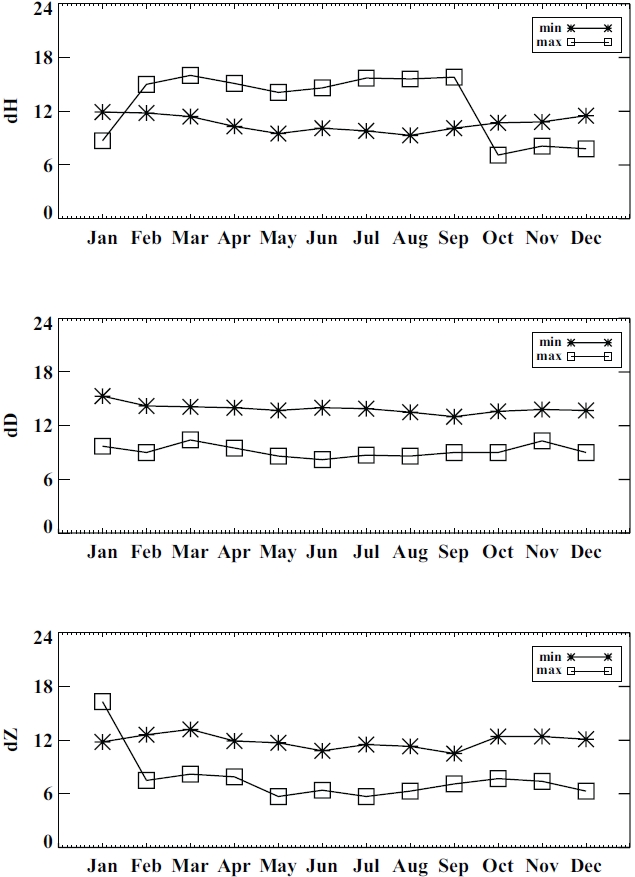
2.2 Seasonal and Monthly Variations of the Geomagnetic Field
The seasonal variation of the geomagnetic field as well as the diurnal variation was compared again considering only the IQDs. This study considered only the IQDs and also found that the length of quiet interval and amplitude for all the three components of the geomagnetic field changes. The amplitude becomes larger in summer and smaller in winter as shown in Fig. 3. Tables 1-3 indicate the four points; minimum, maximum, quiet interval start and end for the H, D, and Z components showing the seasonal variation of the geomagnetic field during 2008-2011. Similarly, Tables 4-6 indicate four points for the H, D, and Z components showing the monthly variation of the geomagnetic field during 2008-2011. Fig. 4 summarizes the changes of the minimum and maximum from month to month for the results of the Tables 4-6. The time for the minimum was at 10:00 in summer (June to August) which is the earliest, and was at 11:15 in winter (December to February) which is the latest. Only in winter,

Seasonal variations of four points (minimum, maximum, quiet interval start and end) of D component (2008~2011).

Seasonal variations of four points (minimum, maximum, quiet interval start and end) of Z component (2008~2011).
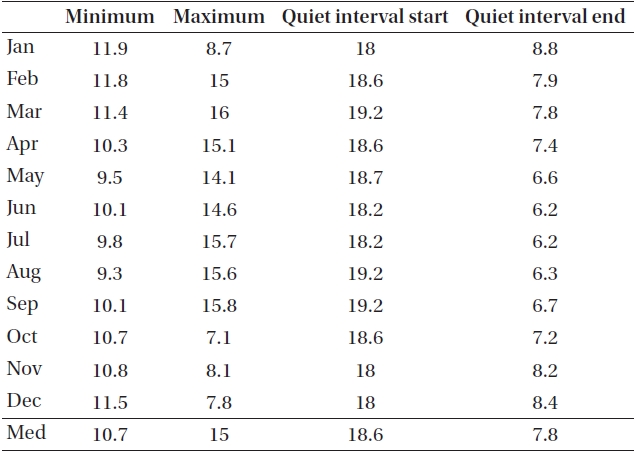
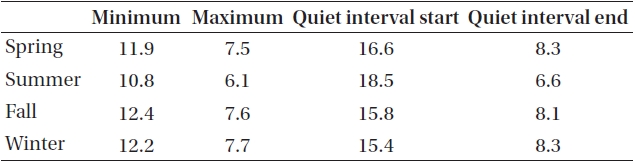
Monthly variations of four points (minimum, maximum, quiet interval start and end) of H component (2008~2011).
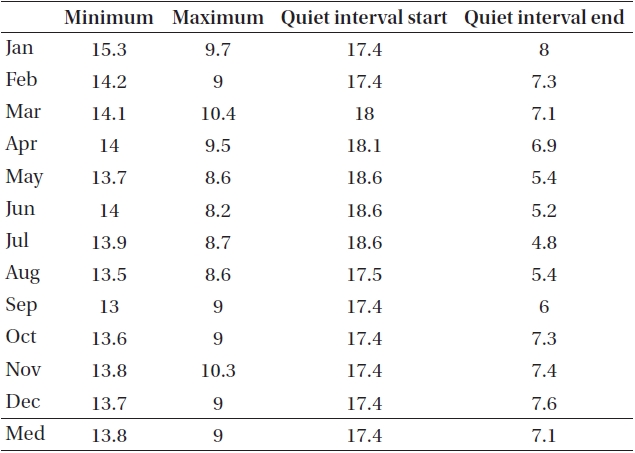
Monthly variations of four points (minimum, maximum, quiet interval start and end) of D component (2008~2011).
the maximum was observed at 08:24 in the morning time. This is because the maximum for the H component is not
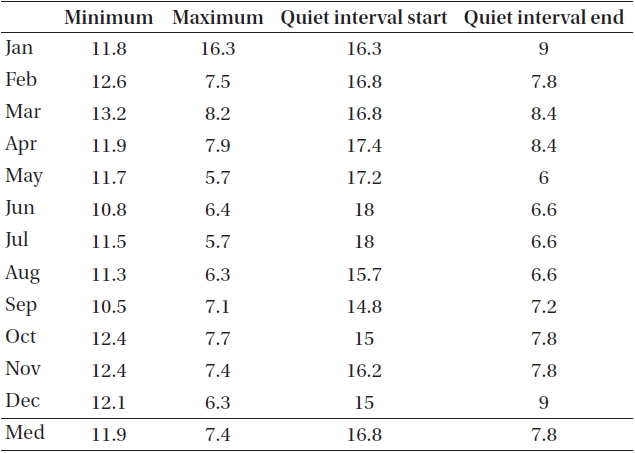
Monthly variations of four points (minimum, maximum, quiet interval start and end) of Z component (2008~2011).
noticeable in winter and has the similar value to 15:00 which is the annual average maximum value. According to the Fig. 5 that depicts only the medians of the three components for easy comparison, the start point of the quiet interval for the H component was at around 18:30 for the four seasons, and
the end point of the quiet interval was at 06:12 in summer which is the earliest and was at 09:00 in winter which is the latest. The start point of the quiet interval for the D component was at 17:00 in autumn and winter which is the earliest and was at 18:42 in summer which is the latest. The Z component showed a similar trend to the D component. The start point and end point of the quiet interval were nearly identical for autumn and winter, and the start point of the quiet interval was at 17:00 which is the earliest and the end point of the quiet interval was at 07:40 which is the latest. For summer, the start point of the quiet interval was at 18:30 which is the latest and the end point of the quiet interval was at 06:36 which is the earliest. When compared with the previous paper, the similarity was that the duration time of the quiet interval for all the three components is shorter in summer and longer in winter. The difference was that the winter maximum for the H component was observed in the morning time. However, this is due to the fact that the winter maximum and minimum for the H component are similar, and the difference may not be meaningful. In other words, it is because the maximum for the H component at 18:00 and the maximum for the H component at 06:00 are similar as shown in Fig. 4.
The changes in the position of the maximum and minimum for the seasonal and monthly geomagnetic field variations are due to the changes in the Sq current system of the Earth's ionosphere. The H component of the geomagnetic field shows the maximum when the Sq current is at its maximum which is induced by the changes in the solar activity. As the position of the maximum and minimum for the Sq current system changes seasonally, the components of the geomagnetic field also experiences the similar trend (Stening 2008).
2.3 Comparison with the Results of Hwang et al. (2011)
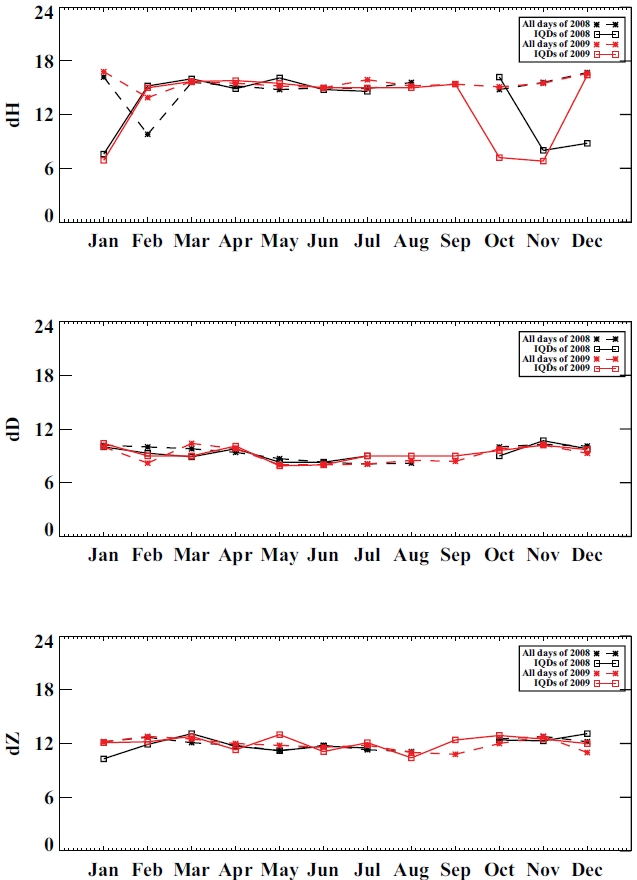
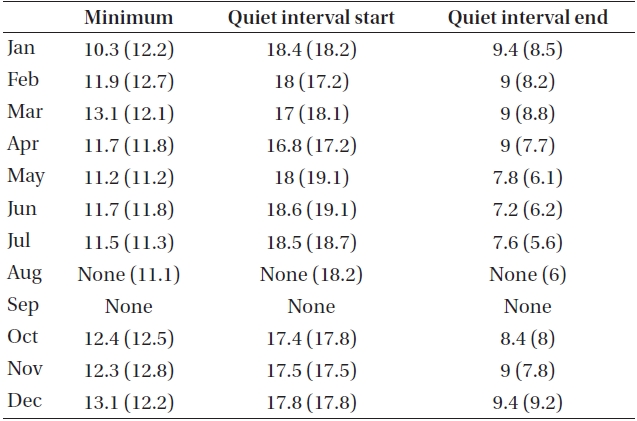
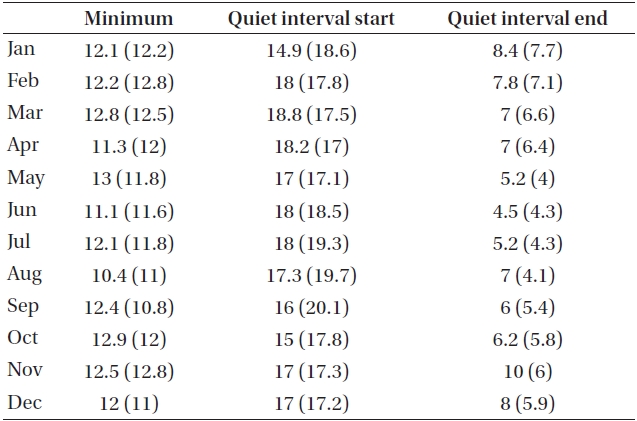
Hwang et al. (2011) analyzed the monthly trend of the geomagnetic field for the entire days during 2008-2009, while this research performed the superposed epoch analysis as before for the selected 5 days per month in the IQDs (the 5 days that have the lowest Kp index for each month were selected). Tables 7-12 summarize the results of the monthly comparison for 2008 and 2009. In Tables 7-12, the numbers outside the brackets are the results of the IQDs, and the numbers in the brackets are the results of Hwang et al. (2011) which studied the entire days. The blue color indicates the data which have more than 2 hours difference compared to the previous data. The noticeable difference is that the maximum for the H component is observed in the morning during autumn and winter for the data from the IQDs while it is observed in the afternoon for the data from the entire days, which is similar to the results of the seasonal comparison. As mentioned before, this is because the maximum for the H component is not noticeable in winter and the amplitude does not increase above the average value following the minimum in winter. In Fig. 6, the time for the maximum of the H and D components andfor the minimum of the Z component were compared with the data from 2008 and 2009 in Hwang et al. (2011). As shown in Fig. 6, in the results of 2008 for the H component, the IQDs (black solid line) and the data for the entire days (black dashed line) are different during January-February and October-December, and are similar for the rest of the months. In the results of 2009, the IQDs (red solid line) and the data for the entire days (red dashed line) are also different only during January-February and October-December. And the comparison of the IQDs between 2008 and 2009 shows the different values in October 2009. This is because the maximum for the H component tends to decrease in winter. In the case of the D and Z components, the analysis results for the IQDs and the entire days are not
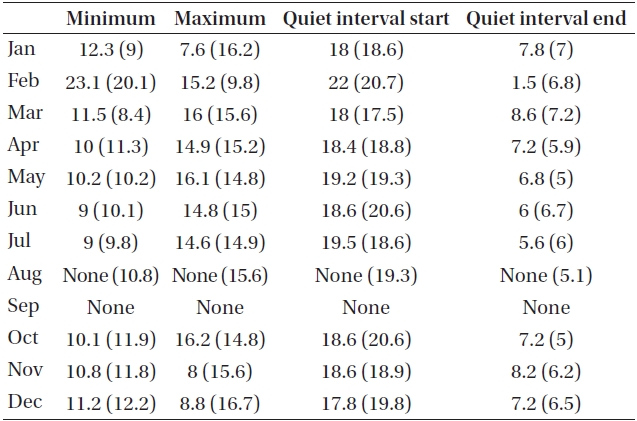
Monthly variations of four points (minimum, maximum, quiet interval start and end) of H component during 2008 (IQDs).
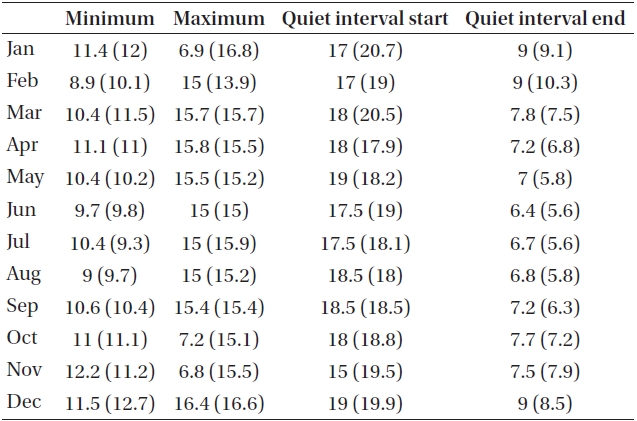
Monthly variations of four points (minimum, maximum, quiet interval start and end) of H component during 2009 (IQDs).
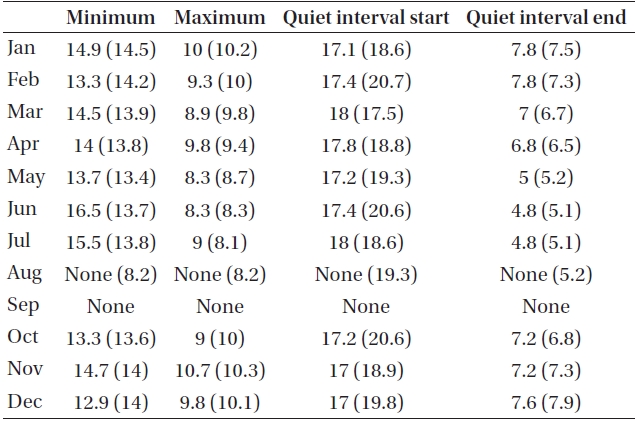
Monthly variations of four points (minimum, maximum, quiet interval start and end) of D component during 2008 (IQDs).
much different. Therefore, the variation in the H component is the most important difference between the previous results which used the entire days and these results which used only the IQDs. This indicates that the H component best reflects the variations in the space environment.
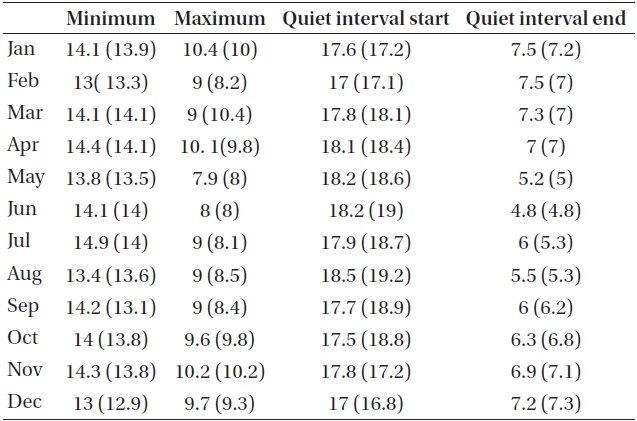
Monthly variations of four points (minimum, maximum, quiet interval start and end) of D component during 2009 (IQDs).
Monthly variations of four points (minimum, maximum, quiet interval start and end) of Z component during 2008 (IQDs).
Monthly variations of four points (minimum, maximum, quiet interval start and end) of Z component during 2009 (IQDs).
This paper performed the analysis using the data on the IQDs during 4 years (2008-2011) to supplement and extend the previous statistical analysis of the diurnal,
seasonal, and annual variations of the geomagnetic field using the BOH magnetometer, which was performed for the entire days during 2 years (2008-2009) in Hwang et al. (2011). For this purpose, the same criteria of the minimum, maximum, and quiet interval from the previous paper were adapted in this paper. Finally we found the overall trend between two results were similar though the exact times were observed somewhat differently for the minimum, maximum, start point of the quiet interval, and end point of the quiet interval. For all the three components (H, D, and Z), the quiet interval ends at sunrise and the maximum or minimum is observed between 2-3 hours before and after the culmination of the sun, and the quiet interval starts at sunset. It is well-known that the diurnal variation of the geomagnetic field shows the maximum, minimum, and quiet interval due to the effect of the Sq current. In other words, when the spiral Sq current system arrives the Bohyunsan Observatory, the geomagnetic field of due to the Sq current’s center faces downward and the H component of the BOH magnetometer decreases. At the moment the center of the Sq current passes right above the Bohyunsan Observatory, the value of the H component records the minimum. As the center of the Sq current passes through the Bohyunsan Observatory, the geomagnetic field of the Sq current faces upward and the H component increases again. The diurnal variation of the H component records the maximum when the Sq current system is halfway past the Bohyunsan Observatory, and the quiet interval, which shows no variation of the H component, starts when the Sq current system has completely passed through. It was expected that the effect of the Sq current system can be seen clearly when we use the data from the IQDs. As a result, the obtained graphs of the diurnal variation were more distinct compared with the previous study.
When it comes to the seasonal variation, the amplitude of the geomagnetic field variation increases and the length of the quiet interval shorten in summer. In other words, the quiet interval ends early in summer when the sunrise is early and it lasts longer in winter when the sunrise is late. And it can be found that the times for the minimum and maximum change depending on the sunrise. However, the time for the winter maximum was rather different and this is because the range of the variation decreases and the maximum is not noticeable, and the gradient for all the intervals excluding the vicinity of the minimum is similar to the average value in winter. This change is due to the fact that the Sq current system has the largest variation in summer and is not much different in winter. Therefore, the distinct characteristics affected by the season directly reflect the changes in the Sq current system.
This study examined the diurnal, seasonal, and annual variations of the geomagnetic field in the mid-latitudes by extending the results of Hwang et al. (2011) which performed the first statistical analysis using the BOH magnetometer data. The previous study analyzed the data for the entire days and there could be an influence from the solar activity. In this study, only the data for the IQDs days were analyzed to investigate the effect of diurnal variation of the geomagnetic field without any interference from the solar activity. The results of this study had similar overall trend compared with the previous results, but showed more distinct characteristics of the geomagnetic field in the mid-latitudes. In terms of the diurnal variation, for all the three components (H, D, and Z) of the geomagnetic field, the quiet interval ends at sunrise and the maximum or minimum is observed between 2-3 hours before and after the culmination of the sun, and the quiet interval starts at sunset. Regarding the seasonal variation, the amplitude of the geomagnetic field variation increases and the length of the quiet interval shorten in summer. In other words, the quiet interval ends early in summer when the sunrise is early and it lasts longer in winter when the sunrise is late. This change is attributable to the Sq current system which is directly influenced by the time that the sun can be seen from the Earth. It is clear that the geomagnetic field variations in the mid-latitudes are mostly caused by the changes in the Sq current system if the variations in the space environment are excluded.