Recently, due to the miniaturization of semiconductor components, the line width of a circuit has become shorter,complexity has become higher, and the data processing speed has become faster, Complex packaging and connection technologies with high performance, reliability, and density are required. In a high-speed digital circuit with high frequency, the introduction of low-dielectric insulating materials between the electric connections can contribute to the miniaturization and integration of the device, as well as high information transfer rate, and crosstalk reduction. However, an interlayer dielectric (ILD) constant in the range of 3.9~4.2 in a semiconductor is too high, and it causes serious problems in the integration and data processing speed of a semiconductor chip [1,2]. Therefore, the value of the dielectric constant should be decreased.
In this study, crystalline silica was incorporated into epoxy matrix in order to prepare insulating material with a low dielectric constant, and the dielectric characteristics were axamined.
Crystalline silica was synthesized by heat-treating an amorphous nanosilica powder. Amorphous silica (Sukgyung A.T Co., Ltd., average particle size: 500 nm) was put in an alumina crucible and heat-treated in air atmosphere at a heating rate of 5℃/min using an electric furnace. Heat treatment was applied at 1,300℃ or 1,400℃ for 2, 4, 6, 12 and 24 hr. Then, the samples were slowly cooled down to room temperature and pulverized into 35-μm particles.
A commercial DGEBA (diglycidyl ether of bisphenol A) type epoxy resin whose trade name was YD 128 (Kukdo Chem. Co. Korea) was used. The epoxy equivalent weight (EEW) was 184~190 g/eq, and the viscosity was 11,500-13,500 cps at 25℃. The curing agent was Me-THPA (3- or 4-methyl-1,2,3,6-tetrahydrophthalic anhydride), whose grade name was HN-2200 (Hitachi Chem. Co., Japan). It is widely used in the field of electrical insulation. The tertiary-amine-type accelerator was BDMA (benzyl-dimethyl amine, Kukdo Chem. Co. Korea).
Mixtures of DGEBA (100 g)/crystalline silica (5, 10, 20, or 40 g) were preheated at 90℃ in order to lower the viscosity, and they was mixed and degassed with a Planetary Centrifugal Mixer (DH. MX DM1KV, Daihan Sci. Co., Korea) at 2,000 rpm for 12 min,
THPA (80 g) and BDMA (0.9 g) were mixed and degassed at 2,000 rpm for 8 min. The mixtures were either poured into a mold with a cavity of 12.5×7.0×3.0 mm for dynamic mechanical analysis, or into a mold with a cavity of 20-mm diameter with 200-μm thickness for dielectric analysis, and then cured at 150℃ for 4 hr.
X-ray diffraction (XRD) analysis for the heat-treated silica was performed with a Bruker M18XCE diffractometer using a Cu-Kα source at 40 kV and 40 mA.
Dynamic mechanical analysis (DMA2980, TA Instrument Ltd.) was carried out in a shear mode at the frequency of 1.0 Hz and the heating rate of 10 ℃/min in with an air purge rate of 110 ml/ min.
Broadband Dielectric Spectroscopy (BDS) controlled by a Novo control Quatro Cryosystem was employed in order to measure the dielectric properties in a frequency range of 10-2 Hz to 106 Hz and temperature range of 20℃ to 170℃. The BDS was combined by a Solartron SI 1260 impedance analyzer. The analysis was carried out in nitrogen atmosphere to avoid the adsorption of humidity from the air.
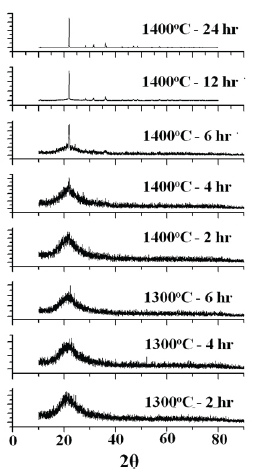
The crystallographic orientation of the annealed silica was investigated by XRD analysis, and the patterns are shown in Fig. 1. The diffracted X-ray beam was collected by scanning the detector over a 2θ range of 10o to 90°. The patterns for the silica annealed at 1,300℃ did not show any characteristic peak regardless of annealing time. However, those for the silica annealed at 1,400℃ showed the diffraction peaks at 21.8°, 31.1°, 35.9° and 46.5°, which corresponded to the crystal planes (101), (102), (200) and (113) of the crystalline cristobalite, respectively [3,4]. With increasing annealing time, the peak became sharper and stronger, which meant the crystallinity increased.
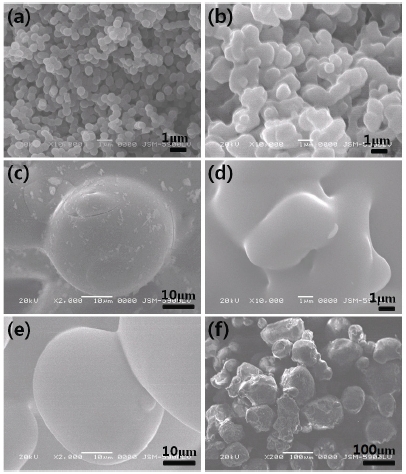
Figure 2 shows the morphology of silica particles annealed at 1,300℃ or 1,400℃ for various times. A few nanosilica particles were started to be sintered at 1,300℃ after annealing for 2 hr (Photo (a)), and most of them were connected at 1,300℃ after annealing for 4 hr through sintering (Photos (b) and (c)). Most nanoparticles were melted after annealing at 1,400℃ for 2 hr, so that the crystallinity increased with increasing annealing time.
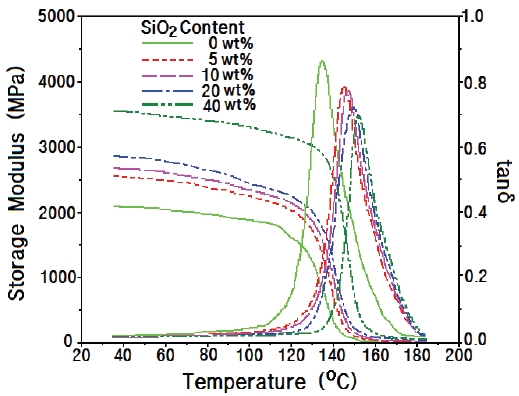
Figure 3 shows DMA curves for epoxy/crystalline silica composites, where silica was prepared by annealing at 1,400℃ for 24 hr. The storage modulus of the silica-0wt% system at 40℃ (at glass state) was 2,073 MPa and increased, showing the highest
value of 3,550 MPa in the silica-40 wt% system, which was ca. 71% higher than that of the system without nanosilica. As the atmosphere temperature increased, the storage modulus (G') decreased and abruptly dropped, and at the same time,the loss modulus (G") abruptly increased at the glass transition state, which was displayed in the form of tanδ = G"/G'.The glass transition temperature (Tg) was estimated from the peak temperature of tanδ. The Tg value of the epoxy system without silica was 135.3℃, and the value of the systems increased with increasing with silica content. The Tg value was increased of 17.6℃ by the addition of 40 wt% silica. When microsilica was added to the epoxy matrix, the microsilica could anchor the epoxy chains by the hydrogen bonding between silanol groups on the silica surface and hydroxyl groups in the epoxy matrix, so that the mobility of the epoxy chains became disturbed.
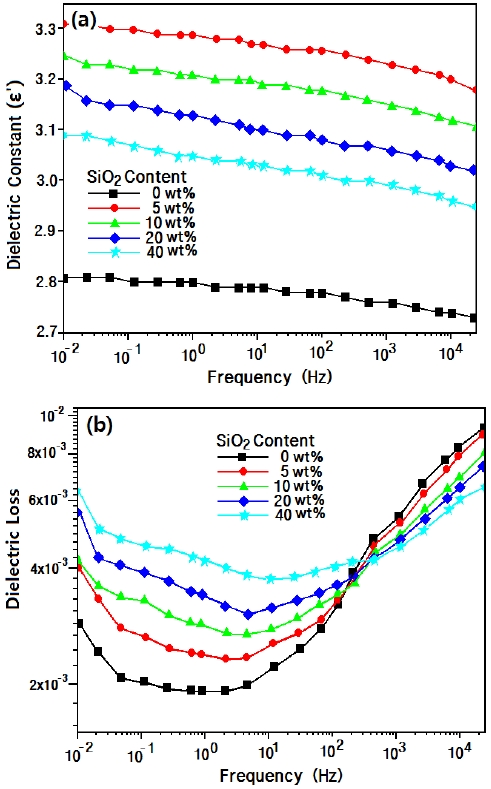
Figure 4 shows the dielectric constant (a) and dielectric loss (b) for epoxy/silica composites at 30℃ according to frequency. When silica was added to the epoxy matrix, the dielectric constant increased regardless of silica content because silica with a higher value (ε = 3.8~5.4) was added to the epoxy matrix (ε = 3~4) [5]. However, the value decreased with increasing silica content, because the microsilica had many pores due to the sintering of nanosilica particles, so that the dielectric constant decreased with increasing microsilica content [6]. The dielectric constant declined slowly as frequency increased.
In Fig. 4(b), the dielectric loss value increased with increasing microsilica content. This was due to the increasing interface area between the epoxy and silica, because the sintered microsilica had many pores.This was explained using the Maxwell equations [7]. As frequency increased, the dielectric loss value decreased in the low-frequency range(10-2~10 Hz), while it increased in the high-frequency range(10~104 Hz), regardless of silica content. The growth rate in the high-frequency range was far higher in the neat epoxy matrix without silica. Generally, if an inorganic filler has been added to a polymer matrix, it acts as a charge carrier, so that the dielectric loss value increased. The results agreed well with Debye's results [8,9]. In the low frequency, dielectric loss was due to interfacial polarization, but in higher frequency, the electron mobility was disturbed by microsilica.
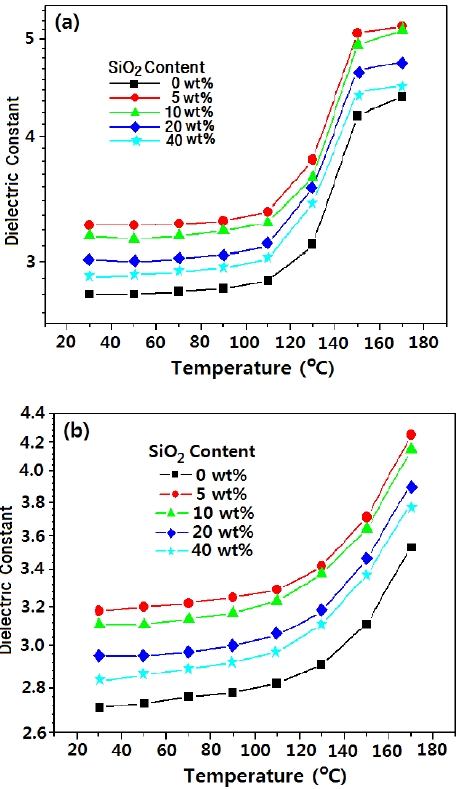
Figure 5 shows the dielectric constant for epoxy/silica composites at (a) 120 Hz and (b) 53.5 Hz according to temperature. The value increased slightly at 30~120℃ and abruptly increased after 120℃ regardless of frequency. The results agreed well with the storage modulus curve of DMA analysis in Fig. 3. The transition of the dielectric constantagreed well with the glass transition area in the storage modulus curve. The conventional epoxy had two sub-Tg relaxations. The γ-relaxation was related to the motion of the glycidyl ether segment, and β-relaxation was due to the crankshaft motion of the hydroxylether group. The two sub- Tg were due to the slight increment at 30~120℃. The conventional epoxy also has one Tg relaxation, which was considered as α-relaxation. The relaxation was due the abrupt increment of the dielectric constant after 120℃ [10].
Crystalline silica was synthesized by annealing amorphous
silica at 1,400℃, and it was found that the synthesized silica had the same crystalline structure as cristobalite. Dielectric analysis for the epoxy/crystalline silica composites was carried out, and it was found that the dielectric constant decreased with increasing crystalline silica content in the epoxy composites, and also decreased with increasing frequency. At 120 Hz, the value of 5 wt% silica decreased by 0.25 compared to that of 40 wt% silica, and at 23 kHz, the value of 5 wt% silica decreased by 0.23 compared to that of 40 wt% silica. As frequency increased, the dielectric loss value decreased in the low-frequency range(10-2~10 Hz), while it increased in the high-frequency rnage(10~104 Hz), regardless of silica content. The value increased with increasing ambient temperature,and the transition of the dielectric constant. Agreed well with the glass transition area in the storage modulus curve.