The rapid industrialization of livestock production has led to one of the world’s most pressing environmental problems, including problems caused by the large quantities of wastewater generated [1]. Collection and treatment plants for wastewater have been used extensively to meet demands for lower effluent concentrations.
Wastewaters contain large amounts of pathogenic and nonpathogenic microorganisms, some of which may be a potential health hazards for workers [2]. Airborne release from these sites may be a critical pathway for pathogen movement off the sites [3]. Many studies have been carried out to evaluate the biological risks of aerosols emitted from municipal wastewater treatment plants [4-10]. Teixeira et al. [4] reported that in a municipal wastewater treatment plant, the indoor culturable bioaerosol concentration varied up to 5 × 10⁴ colony-forming unit (CFU)/ m3 for total bacteria, and 1.4 × 10⁴ CFU/m3 for total fungi. The bioaerosol emission also varied according to the treatment stages [9,11].
The exposure of workers to airborne microorganisms may vary depending on the type and capacity of the facility, the activities performed, and the weather conditions. Livestock-related facilities are a potential source of pathogenic bioaerosols [12], especially
The environmental effects on bioaerosol emission in a swine wastewater treatment plant are not well known to the best of our knowledge. The size distribution of bioaerosol emitted from a plant is important to study, because the deposition of bioaerosol particles in the respiratory system depends on their aerodynam-
ic diameter, and the effects on human health are related to the sizes and physical properties of the particles [14].
This study has been conducted to examine the generation characteristics of airborne bacteria and fungi emitted from a swine wastewater treatment plant by using a solid impact air sampler. Cultivation methods based on the viable counts of mesophilic heterotrophic bacteria and fungi were performed. We characterized the seasonal change in airborne microorganism concentration at different stages of the treatment process (primary treatment, biological treatment, post-treatment). We also explored the distribution characteristics of airborne microorganisms for each particle size in each of the processes. The degree of correlation between airborne microorganisms and environmental conditions at the test sites was also determined.
2.1. Plant Description and Sampling Locations
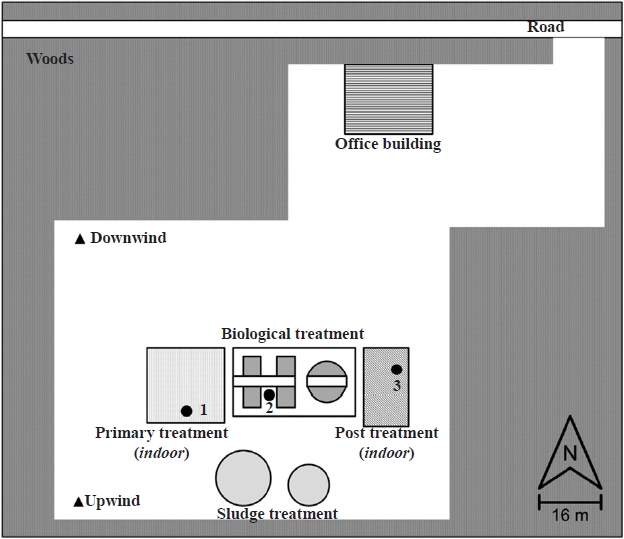
The study was performed at the swine wastewater treatment plant, with activated sludge biological treatment, located in Hallym, Jeju Island, Korea. The selection of the study site was based on the structure of the plant (indoor and outdoor structures), and the plant was also located away from any existing sources of anthropogenic air pollution. A schematic diagram of the plant is presented in Fig. 1.
The plant receives 100 m3/day of wastewater, transported by truck and tank trailer, and generated by swine farms scattered all over Jeju Island. The plant has three separate phases of treatment process, consisting of primary treatment, biological treatment, and post treatment. Raw wastewater enters an indoor primary treatment process (hereafter referred to as the “inlet process”), with a screen, an aerated grit chamber, and solid-liquid separation, all of which are uncovered and exposed to the indoor environment. The secondary treatment is based on activated sludge (hereafter referred to as the “aeration process”), and aeration is performed in opened aeration tanks with fine bubble diffusers. The wastewater finally moves to an indoor post-treatment process (hereafter referred to as the “outlet process”) with ozone oxidation, coagulation, and filtration. All processes except for the secondary treatment were performed inside buildings. Bioaerosol samples were independently collected at each processing site in the plant to provide insight into any differences in bioaerosol generation, and to compare indoor and outdoor environments in the plant.
The sampling locations were selected according to wind directions and access depending on the operational activities taking place (see the sampling locations in Fig. 1). Indoor samples were usually taken at a distance of 1 to 2 m from the potential sources. Outdoor samples were taken 2 to 4 m downwind from the operations. In all cases, a background sample was taken at an upwind location unaffected by plant operations, usually 10 to 20 m upwind.
2.2. Air Sampling and Analysis
Site visits for sampling were undertaken once a month from October 2009 to September 2010. Microbial investigations were carried out during ordinary work time (1:00 PM to 4:00 PM) at a height of about 1.5 m above the floor of the site being investigated.
Cultivation-based detection in selective media after impaction was applied to detect and characterize the viable components of bioaerosol. Mesophilic heterotrophic bacteria were chosen to be analyzed, because they are prevalent in the environment [9]. Air samples of airborne bacteria and fungi were collected using two air samplers; a single-stage impactor sampler (Buck Bio-Culture Pump model B30120; A. P. Buck Inc., Orlando, FL, USA), and a six-stage viable particulate cascade impactor (Model 10-800; Andersen Inc., Smyrna, GA, USA). The cascade impactor was selected to identify the distribution characteristics of the particular bioaerosol by the aerodynamic particle size, for which the ranges in stages 1 to 6 are >7.0 μm, 4.7?7.0 μm, 3.3?4.7 μm, 2.1?3.3 μm, 1.1?2.1 μm, and 0.65?1.1 μm, respectively. The sum of the colonies counted between stages 3 and 6 corresponds to the respirable fraction. The impaction flow rate for both samplers was set to 28.3 L/min. The duration of air sampling was initially set to 5 min, and then varied according to the environmental conditions at the measurement locations. Bacteria and fungi samples were sampled in sequence.
Trypticase Soy Agar (TSA) (Lot 3087230; BD, Franklin Lakes, NJ, USA), with 500 mg of cycloheximide added to suppress fungal growth, was used as the bacterial culture medium. Airborne fungi were cultured in Sabourand Dextrose Agar (SDA) (Lot 5111476; BD) with 100 mg of chloramphenicol to inhibit the proliferation of bacteria. The culture media were immediately transported to the laboratory after every collection cycle, and cultured in an incubator for 1?2 days at 37℃ for bacteria, and for 3?5 days at 25℃ for fungi. The colonies were counted, and the measurement was expressed as CFU/m3.
Environmental factors were also measured to analyze any correlation with bioaerosol generation. Temperature and relative humidity were measured with a digital thermohygrometer (Model 608 H-1; Testo, Lenzkirch, Germany). Odor intensity was analyzed with a handheld odor meter (Model OMX-SR; Shinyei, Kobe, Japan). Airborne particulate matter (TSP, PM10, PM2.5, PM1.0) was analyzed using a portable dust monitor (Dustmate; TurnKey Instruments Ltd., Cheshire, UK).
The microbial contamination was analyzed by season and separately for each step of the treatment process. The statistical significance of the correlation between environmental factors and airborne microorganisms was verified by Pearson and Spearman correlation analysis tests using the SAS/Stat 9.1 (SAS Institute Inc., Cary, NC, USA). The analysis of variance (ANOVA) analysis method was used to verify the statistical significance of the differences between the values of measurements taken for two indoor processes and an outdoor process.
3.1. Total Culturable Bacteria and Fungi in Air Samples
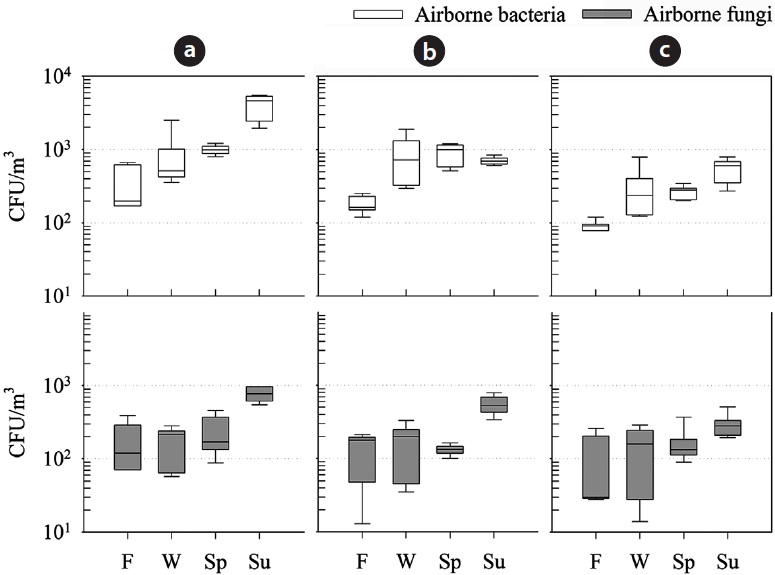
Culturable bacteria and fungi were detected in all air samples collected at all sites at the scheduled times. The results are summarized in Fig. 2, which presents seasonal variations in bioaerosol concentrations for each step of the treatment process. Concentrations of airborne culturable bacteria generally ranged from 8 × 101 to 5 × 10³ CFU/m3, and those of culturable fungi ranged from 1 × 101 to 9 × 10² CFU/m3. In the previous study, the levels of bioaerosol released from twelve swine farms were slightly higher than those of our observation [3]. However, as demonstrated in that study, the difference in overall bioaerosol concentrations was not statistically different.
In municipal waste treatment plants, site workers should not be exposed to levels higher than 5 × 10³ CFU/m3 over an 8-hr working day [15], and the threshold limit in occupational atmospheres is 104 CFU/m3 for the total bacteria concentration [16]. The observed levels in our study can therefore pose occupational biorisks in an occupational atmosphere.
Fig. 2 shows that the bacterial concentrations at the inlet process were the highest among all sites (ANOVA,
Fig. 2 also shows the seasonal variations in culturable microorganisms in air samples. The maximum exposure was found to occur during the summer at the following mean levels: 4,141 ± 1,386 CFU/m3 for culturable airborne bacteria and 765 ± 171 CFU/m3 for culturable airborne fungi, both of which were observed at the inlet process. For indoor sites (inlet and outlet processes), bacterial and fungal levels in air samples were observed in the following descending order: summer > spring > winter > fall, while for the outdoor site, the bacterial level in the summer was not the highest. Karra and Katsivela [9] observed that the heterotrophic bacterial concentration in air decreased during a summer day in the sunshine, accompanied by increasing solar radiation and temperature, while fungal concentration increased slightly. High temperature and solar radiation in the summer could affect the survival of the airborne microorganisms or deactivate them. Correspondence of the bioaerosol level to seasonal changes was significant (ANOVA,
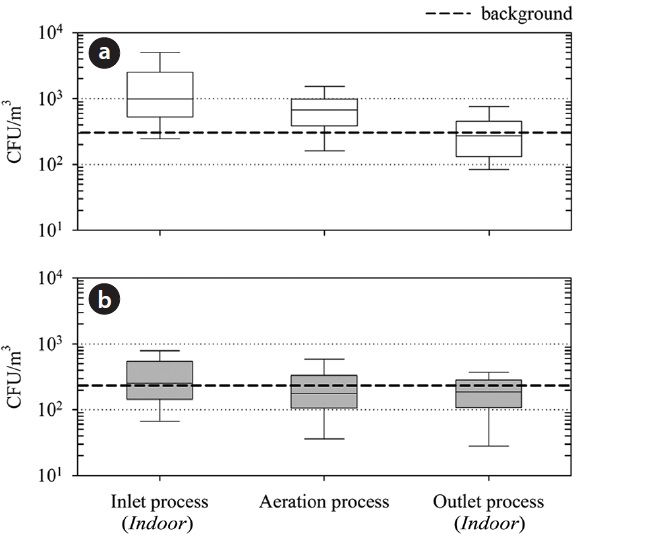
Fig. 3 presents the overall bioaerosol concentrations at the sampling sites during 1 yr of study. A gradual decrease in the concentrations of bacteria and fungi in the air samples was observed after an early step of the treatment process (i.e., inlet process). The mean concentrations of culturable bacteria in air samples were 1,753 ± 1,693 CFU/m3 at the inlet process, 735 ± 461 CFU/ m3 at the aeration process, and 327 ± 234 CFU/m3 at the outlet process. In comparison, the mean concentrations of culturable fungi were 345 ± 264 CFU/m3 at the inlet process, 238 ± 203 CFU/ m3 at the aeration process, and 199 ± 128 CFU/m3 at the outlet process. In total, the concentration of culturable bacteria in the air samples decreased by more than 80% after post-treatment, but those of culturable fungi did so only by around 40%, regardless of seasonal variation. The culturable bacterial concentration in the air samples was, at least, 5 times the culturable fungal concentration at the inlet process; further, the culturable bacterial concentration in the air samples was 3 times that at the aeration process and 1.6 times that at the outlet process. It is important to note that the background levels of bioaerosols were greater than those observed at the outlet process, although far less than those at the inlet process.
The exact microbial concentration cannot be determined using cultivation-based detection due to the fact that there is a methodological limitation of culturing all the individual microorganism colonies existing in an environmental sample [9,17], leading to underestimation of the airborne living microorganisms as well as underestimation of the risks from toxic or immunopathogenic effects on the workers at a site. Li et al. [10] reported that by polymerase chain reaction and denaturing gradient gel electrophoresis (PCR-DGGE) analysis, pathogenic species such as
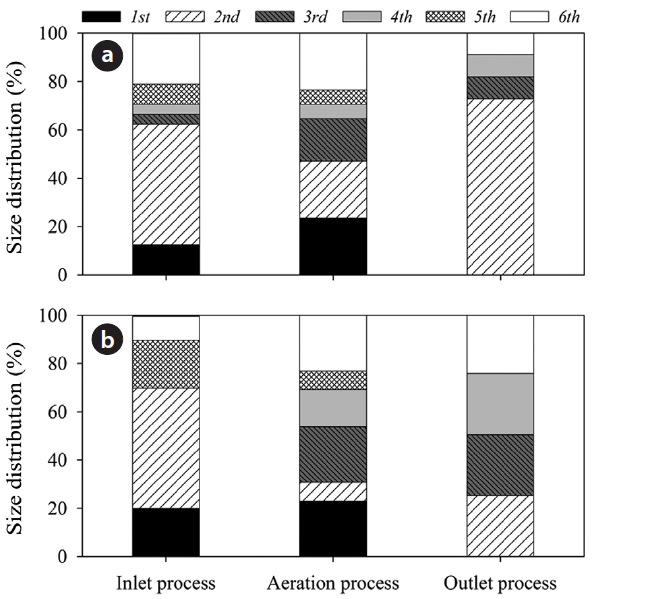
3.2. Distribution of Microorganisms by Bioaerosol Particle Size
Fig. 4 shows a diagram of the distribution of airborne bacteria and fungi according to bioaerosol size at each step of the wastewater treatment plant. At the inlet process, the highest distribution appears in stage 2 (85 CFU/m3 for culturable bacteria and 35 CFU/m3 for culturable fungi), with bioaerosol size is in the range of 4.7?7 μm. The lowest distributions were in stages 3 and 4 (7 CFU/m3 for culturable bacteria in both stages and culturable fungi were undetectable). The bioaerosol sizes are in the ranges 3.3?4.7 μm and 2.1?3.3 μm, respectively. At the outlet process, the highest distribution appeared in stage 2 (57 CFU/m3 for culturable bacteria), where bioaerosol size is in the range of 4.7?7 μm, but differences in the distributions of other size ranges were not significant. At this site, culturable fungi show an even distribution in stages 2, 3, 4, and 6. At the inlet process, the ratios of respirable concentration to total concentration (corresponding to bioaerosol sizes of 0.65 to 4.7 μm) were 0.37 and 0.30 for culturable bacteria and fungi, 0.54 and 0.69 at the aeration process, and 0.27 and 0.75 at the outlet process, respectively. In a full-scale composting facility, size distributions of the total airborne microorganisms were evenly distributed in the six stages, and the concentrations at each stage were over 104 CFU/m3 [18]. In feedstuff-manufacturing factories, over 70% of airborne bacteria were concentrated in respirable air and more than 60% of airborne fungi consisted of respirable airborne fungi [17]. It has

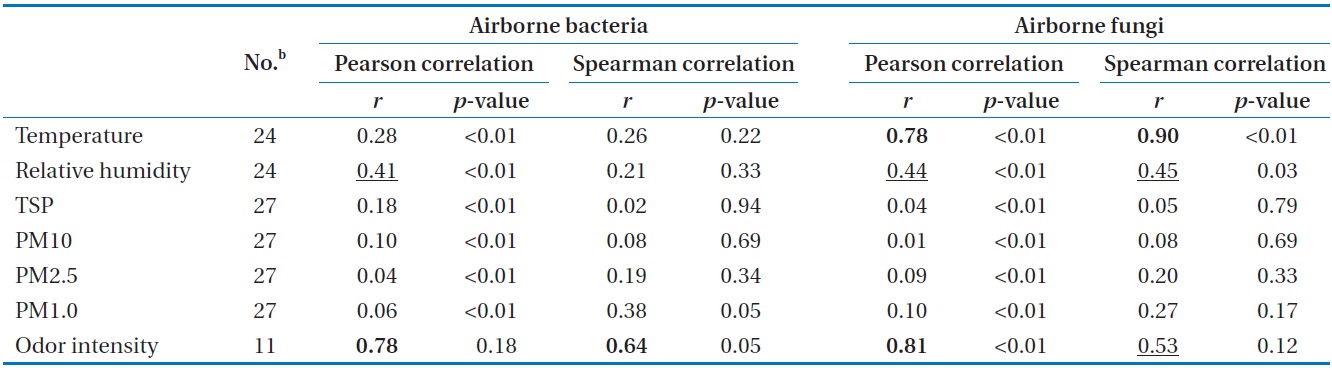
Correlation coefficientsa for geometric means of bioaerosol concentrations compared with environmental parameters
been reported by others [19,20] that bioaerosols with aerodynamic diameters of 5 μm have greater effect on the alveolus than those with larger diameters, and result in allergic reactions and other serious illnesses. In this study, the outdoor aeration process showed the highest ratio of respirable to total bioaeorsol concentration. It is speculated that the secondary generation of microorganisms due to a biological mechanism in the aeration process could contribute to high levels of respirable bioaerosols detected.
Although these bioaerosol distributions are affected by environmental factors, meteorological conditions, and generation sources, the results observed in this study may be site specific. The ratio of respirable bioaerosol was significant, and this poses a potential biological risk, which could be hazardous to workers.
3.3. Effect of Environmental Factors on Bioaerosol Generation
The degree of correlation between airborne microorganisms and environmental conditions at the test sites is summarized in Table 1, which was obtained by applying Pearson correlation analysis and Spearman correlation analysis. Among the environmental factors investigated, air temperature showed a statistically significant correspondence with airborne fungi (
There have been no similar reports on the distributions of airborne microorganisms in swine wastewater treatment plants. However, compared with other studies on municipal wastewater treatment plants [2,7,9,23] and other working sites [16-18,24], the distribution of airborne microorganisms was found to have a similar pattern. There is no official standard for the exposure to bioaerosols in the indoor area of the studied site. The American Conference of Government Industrial Hygienists (ACGIH) recommends indoor concentrations of bacteria and fungi to be less than 1,000 CFU/m3 [25]. From the results of this study, the indoor pre-treatment process should be of concern to workers, and thus, it is imperative that appropriate institutional standards and maintenance guidance be made available as soon as possible.
The concentrations of bioaerosol (mesophilic heterotrophic bacteria and fungi) emitted from the swine wastewater treatment plant varied depending on the step of the process being considered, and by season. The pretreatment process was found to be the major source of bioaerosol. For the aeration process, a portion of the respirable bioaerosol concentration was significant. Our study is the first report on the size distribution of bacteria and fungi aerosolized from a swine wastewater treatment plant using a solid impact air sampler. A significant correspondence between temperature and airborne fungi bioactivity was found, and the odor intensity could be used for detecting high levels of both airborne bacteria and fungi. Our field data should be taken into consideration in the design and maintenance of the swine wastewater treatment plants with respect to occupational safety and health.