Analysis of hydrological safety as well as the determination of many substance concentrations are necessary when bioreactor systems are introduced to landfill operations. Therefore, hydrological and substance balance model was developed since it can be applied to various bioreactor landfill operation systems. For the final evaluation of the model’s effectiveness, four different methods of injections (leachate alone, leachate and organic waste water, leachate and reverse osmosis concentrate, and all the above three combination) was applied to 1st landfill site of Sudokwon landfill. As a result, the water content of the hypothetical cases for four different systematic bioreactors is projected to be increased up to 35.5% in next 10 years, and this indicated that there will be no problems in meeting the hydrological safety. Also, the final Cl- concentration after 10-yr time period was projected to be between from minimum 126 to maximum 3,238 mg/L, which could be still a decrease from the original value of 3,278 mg/L. According to the proposed model, whether the substance concentration becomes increased or decreased largely depends on the ratio of initial quantity of inner landfill leachate and the rate of injection.
It is important to ensure the integrity of the final covering of landfill sites to reduce odor and greenhouse gas emission. However, final coverings of landfill causes a restraint on the moisture supply which results in the drying of the interior of the landfill. Considering that a landfill is essentially a large mixed biological reactor, the exclusion of water raises the problem of an extended stabilization time [1]. This impingement on the biological reaction drastically reduces the production of landfill gas, used as an energy source, lowering the value of the facility. Therefore landfill operations are now being studied as bioreactors, and this perspective in design is being applied to closed landfills in order to reducing leachate and waste water treatment cost and to shorten the stabilization period [2,3], as well as to increase the economic feasibility of the landfill site as an energy facility by increasing landfill gas production [4,5].
Bioreactor landfills are classified into various types depending on their scale, structure and recirculation of waste water, as well as whether they are operated aerobically or anaerobically [6]. For the long term operation of all bioreactor landfills, it is necessary to analyze the concentration of substances which cannot be emitted from the landfill through either the generation of gas or through the leachate, as increases in concentration of many such substances (e.g., Cl-) can negatively influence the operation of the system. The change in substance concentration depends on the scale of landfill, the injection volume of waste water and the rate of substance production from waste
The purpose of this research was to predict the long term changes of water content and the concentrations of non-degradable substances in a large scale landfill site after the introduction of a bioreactor system. The strict control of the water content in such systems can allow for the prevention of operational problems as well as improving the efficiency of the bioreactor system. A study was carried out to develop a substance concentration model which can be applied to various bioreactor landfills, and this model and methodology were applied to the 1st landfill site of Sudokwon landfill in Korea in order to further refine the parameters of bioreactor control
2.1. Accumulation Model Development
2.1.1. Mass balance equation
The bioreactor system generally has various combinations of leachate recirculation, waste water injection and leachate treatment facilities. These combinations should be reflected in constructing mass balance equation. In a large-scale landfill system,
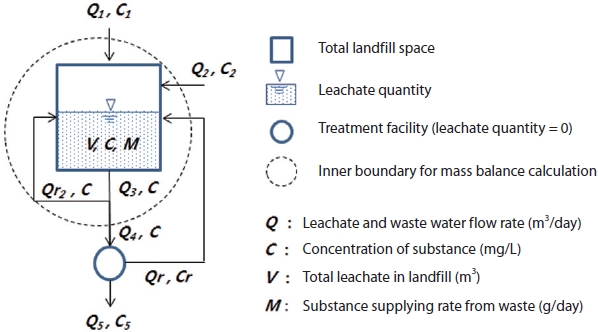
secondary and irregular processes can cause a change in substance concentration, and it is impossible to recognize all these complicated phenomena. In this study, the total landfill system was constructed as shown in Fig. 1 for its mass balance analysis against non-degradable substances.
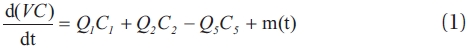
As shown in Fig. 1, mass balance is expressed in terms of
Here, if the initial quantity of leachate is set to be

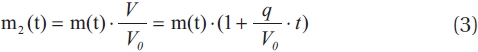
m(t) can be changed according to
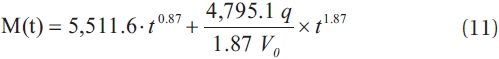
If Eq. (4) is substituted into Eq. (1), and is then integrated, Eq. (5) which is the function of substance concentration can be described as follows.

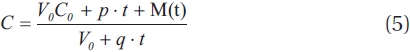
M(t): integrated function of m2(t)
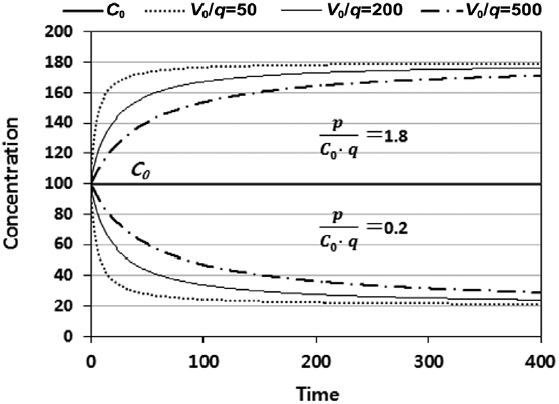
In Eq. (5) the ratio of
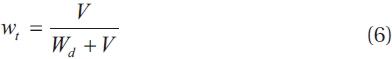
If the water content is increased by leachate recirculation and the total dry weight of waste,
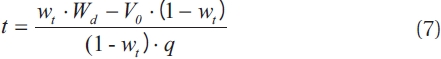
2.1.2. Input factor V0, m(t)
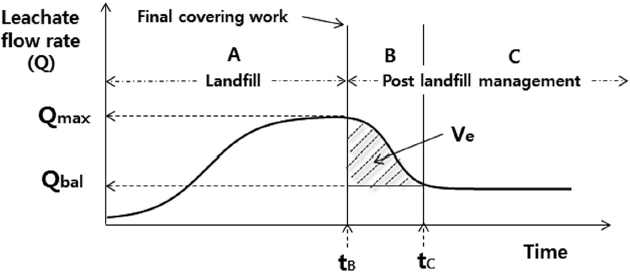
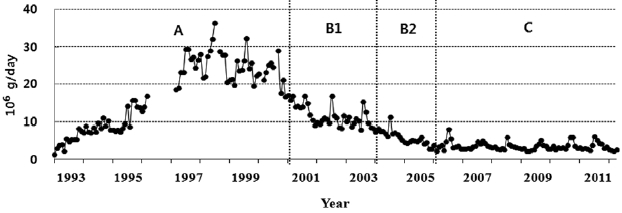
Landfill management has three hydrological phases from the start of the landfill start to post landfill management period as shown in Fig. 3. Stage A is the landfill operation period and the leachate generation increases according to waste addition. The maximum value (Qmax) of the leachate flow rate was reached before the final covering, as during the progression of dumping, precipitation and moisture in waste were the source of leachate. Stage B is that period in which leachate generation is diminishing with time as waste dumping has been suspended and precipitation is reduced after the final covering. In stage C leachate generation is kept constant (Qbal) in long term because of the hydrological balance between precipitation infiltration and leachate discharge.
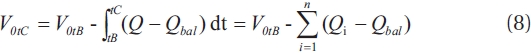
V0tC: leachate quantity at time tC
V0tB: leachate quantity at time tB
i: month or day
n: total month or day from tB to tC
Qi: leachate flow rate of each month or day from tB to tC
Qbal: balanced leachate flow rate at stage C
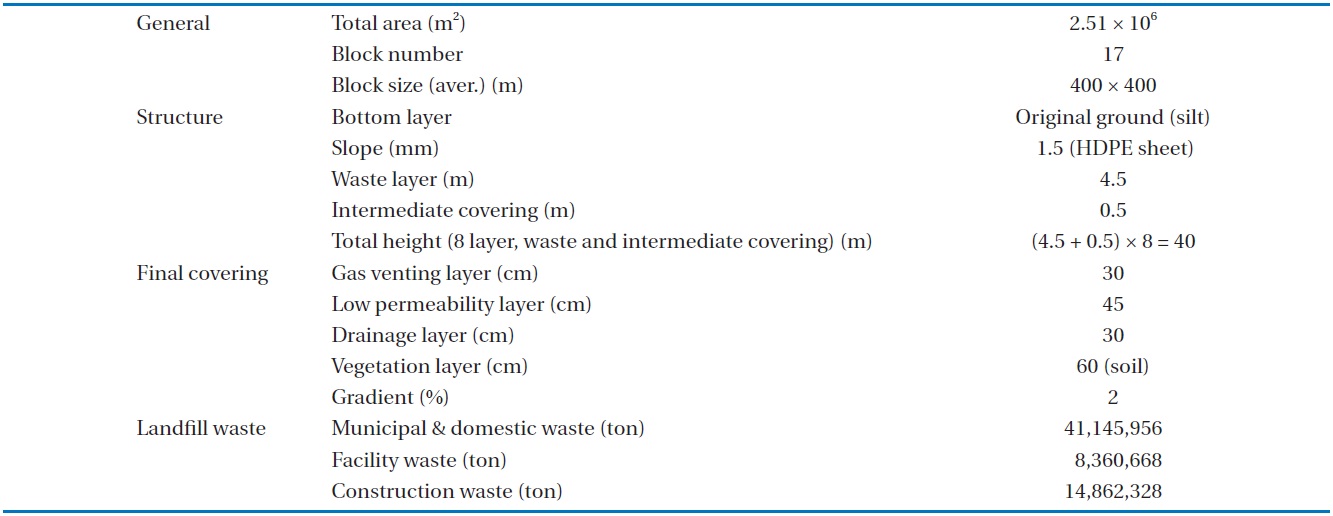
[Table 1.] Design structure and landfill waste of Sudokwon landfill site 1st landfill

Design structure and landfill waste of Sudokwon landfill site 1st landfill
ate the total volume of leachate in a landfill on determinations of substance concentration.
After applying the bioreactor system,

m(t) differs depending on the landfill structure, waste characteristics and the substance to be analyzed, and it is more difficult to decide an adequate m(t) in large scale landfills, as results of laboratory experiments cannot be applied directly. Actual data accumulated during a long term study is better for the actual application. m(t) can be considered as a time function of the supply rate of a substance from landfill waste.
2.2.1. Landfill for case study
The 1st landfill site of the Sudokwon landfill opened in February 1992, and an approximate 64 million tons of municipal, construction and industrial waste had been treated as of October 2000 when it ceased operation. Design information relating to the 1st landfill site is shown in Table 1, and it is now in the post management period. Landfill gas from the site has been used to supply a power plant (50 × 106 W) and leachate has been discharged after treatment.
2.2.2. Substance for analysis
Cl- was selected as a substance for concentration analysis. According to a previous study [7], over 99% of carbon is removed from landfill through artificial collection and surface emission of landfill gas. On the contrary, salts such as Cl- were not removed from landfill but accumulated throughout bioreactor operation. The excessively high concentration of salts can negatively influence anaerobic digestion and leachate treatment. Cl- is a relatively stable substance in landfill and acts as an indicator for concentration analysis of other salts.
3,278 mg/L, the average value in stage C, was applied as the initial Cl- concentration of
2.2.3. Case study for bioreactor landfill
During 10 years of bioreactor operation at the 1st landfill site, the changes of water content and Cl- concentration were analyzed. For the comparison, between diverse operation types, the leachate, RO concentrate and food wastewater after digestion were analyzed for hydrological and Cl- concentration changes as shown in Table 2.
3.1.1. Initial quantity of leachate V0 in landfill
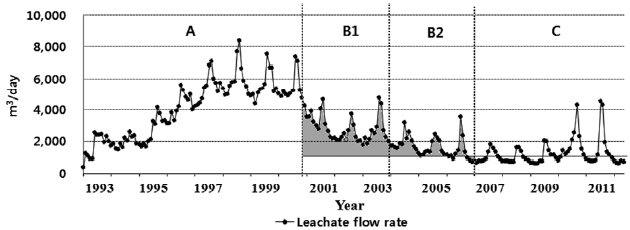
The 1st landfill site shows three stages of hydrological periods from the beginning to the present as shown in Fig. 4. Among these, the stage B period can be divided into B1; construction time of final covering after ending of dumping waste, and B2; before obtaining hydrological balance, or the period after construction of final covering. B1 and B2 can be considered as stage B.
Since there is no water content data for stage C of the 1st landfill site, that of the 2nd landfill site, which is similar in scale to the
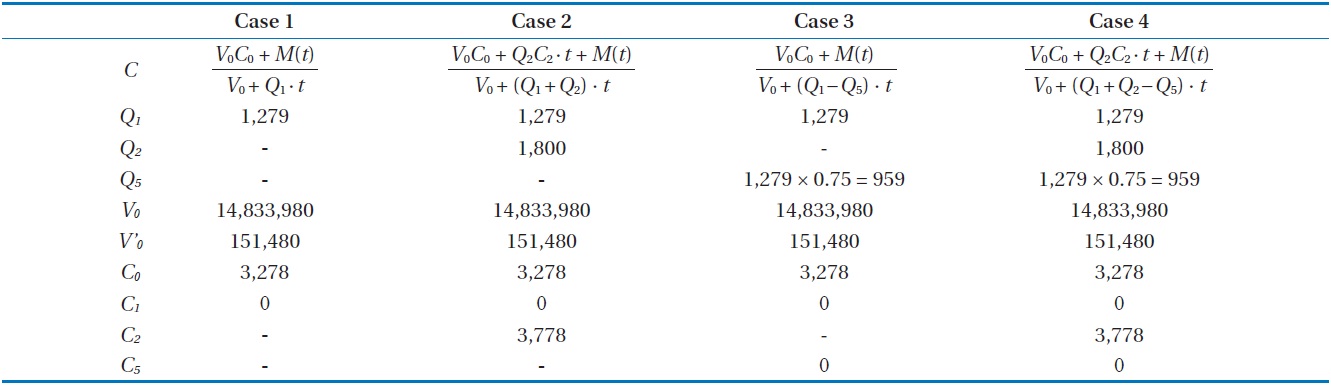
Data set used to estimate Cl- changes in 1st landfill by bioreactor in all theoretical cases
1st landfill site, was substituted. Total 61.2 × 10⁶ ton of waste has been processed until July 2012 in the 2nd landfill. This landfill capacity is almost the same as that of 1st landfill site. The average percentage water content of stage A for the 2nd landfill site was 26.7% [8]. This value can be converted to leachate quantity retained in for the 1st landfill site, giving a value of 17,103,876 m3. As previously stated, if the leachate quantity of
3.1.2. Changes in water content over time
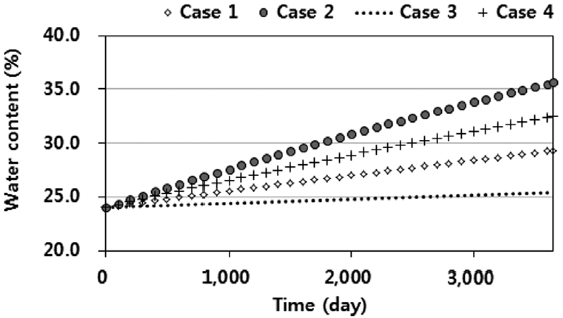
Water content change during four cases of bioreactor landfill operation which was supposed to be introduced to 1st landfill site is shown in Fig. 5. Water content was changed from 24% to 29.3% for case1, 35.5% for case 2, 25.2% for case 3, and 32.3% for case 4 after 10 years. Though there were differences depending on each case, the maximum water content was under 36% throughout the 10 years of operation.
A sudden increase in the water content could negatively affect the safety of the slope of the landfill site. Therefore, when the water content exceeds a certain level, it is necessary to remove
moisture as leachate, and to manage this balance carefully. However, on the bases of a water content of 35.5%, hydrological problems were not expected during the operation of the 1st landfill bioreactor. This result also indicated that the introduction of the bioreactor system to the landfill could decrease the cost of leachate treatment process.
3.2. Analysis on the Change of Cl- Concentration
3.2.1. Cl- supplying rate in landfill
Fig. 6 shows the leachate flow rate multiplied by the Cl- concentration during January 1993?May 2012 of 1st landfill site. In stage C (January 2007?May 2012), the Cl- supply rate was declining slowly, and with 65 monthly mean measured data as a sample, the trend-line
3.2.2. Cl- concentration change with time
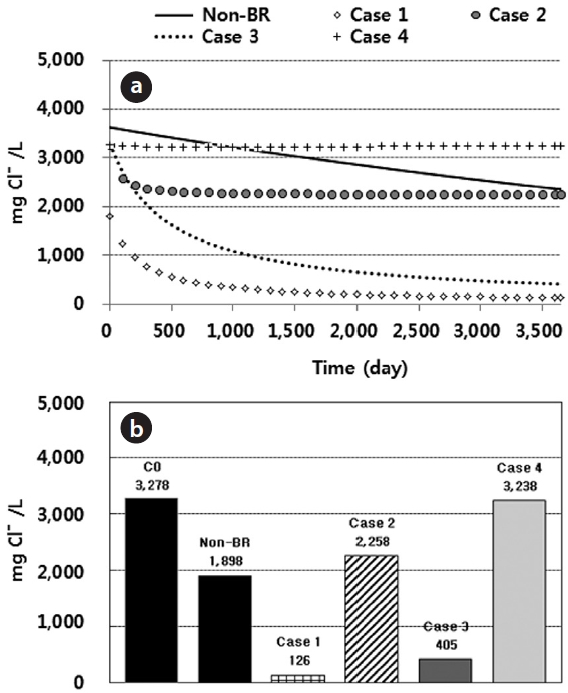
Without application of bioreactor landfill system, Cl- concentration will be diminished from the initial 3,278 to 1,898 mg/L after 10 years. With operation of bioreactor landfill,
This result was in opposition to the generally accepted concept that a substances concentration may increase by leachate recirculation. Precipitation infiltration can dilute the leachate in landfill, but substance supply from waste and injection of the leachate can compensate for this dilution. However, the rate of substance supply from waste declines with time, and so, not all substances are concentrated by leachate recirculation and the injection of waste water.
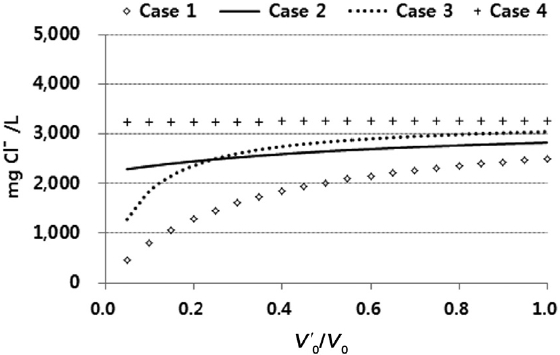
3.2.3. The change rate of Cl- concentration
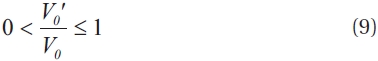
Fig. 8 shows the Cl- concentration change in next 10 years according to Eq. (9) for
on the effectiveness of the leachate waste treatment. In the case of the 1st landfill site, since it showed a gradual decrease of substance concentrations and a high retention of leachate it can be concluded that salt concentrations will not cause any significant problems.
A substance concentration model was applied to the bioreactor operation of closed landfill ? the 1st landfill site of Sudokwon landfill in Korea. Four types of injection cases including leachate, leachate with organic waste water, leachate with RO concentrate and leachate with organic waste water and RO concentrate were theoretically introduced.
The water contents were calculated to increase to a maximum of 35.5% from the initial content 24% over the next 10 years. Therefore, the bioreactor landfill operation should not cause any hydrological problem.
When bioreactor systems are not applied to landfills, the concentration of Cl- is estimated to reach 1,898 mg/L in next 10 years. The estimated concentrations of Cl- were from 126 to 3,238 mg/L in the case bioreactor introduction. Also, in all cases, the concentrations of Cl- were determined to be attenuated with time, from the initial concentration of 3,278 mg/L.
In a bioreactor landfill, as the ratio of leachate quantity which is related with hydrological circulation becomes large, the Cl-concentration change becomes gradual. So, the even recirculation and injection of leachate or wasted water are important for reducing the changes in substance concentration.