Perchlorate (ClO4-), a highly oxidized (+7) chlorine oxidation, has been widely used as an oxidizer and as an explosive material in military and civilian applications. It has also generated increased interest as an inorganic contaminant in drinking water, groundwater, and surface water. Recently, numerous studies have reported the detection of ClO4- at various concentrations (from <1 to >1,000 μg/L) in groundwater, surface water, and drinking water [1-10]; tea and soft drinks [4]; milk [11]; saliva [12]; leafy vegetables [13]; tobacco plants and tobacco products [14]; and wastewater effluent [8]. These reports of ClO4- in water and food have given rise to serious concerns among regulatory agencies and among the general public. In particular, water contamination by ClO4- has become a major environmental and health concern in recent years , as evidence has emerged that the toxicological effects of ClO4- are associated with abnormal endocrine function [8,15].
A recent study has shown the presence of ClO4- at various concentrations in the range of 0.05?60 μg/L in surface water of South Korea (i.e., river mainstream and tributaries), 0.56?22 μg/L in wastewater treatment plant effluent, and 0.2?35 μg/L in tap water [8]. However, these data in South Korea were fairly limited to the regional dispersion of perchlorate. In a separate study, we presented the following ClO4- detection data in South Korea: 1.99?6.41 μg/L (n = 37; mean, 4.59 ± 0.17 μg/L) for 12 different brands of dairy milk and 1.49?33.3 μg/kg (n = 26; mean, 7.83 ± 0.22 μg/kg) for 4 different brands of milk-based infant formula [16]. Those 37 dairy milk and 26 infant formula products constitute over 99% of the dairy milk and infant formula market in South Korea. In addition, among 520 tap-water samples from over 100 different locations in South Korea, ClO4- was detected in over 80% of tap-water samples, in concentrations ranging from <1.0 to 6.1 μg/L with a mean concentration of 0.56 μg/L [17]. In the same study, ClO4- was also detected in 23 of 48 bottled-water samples, with concentrations ranging from 0.04 to 0.29 μg/L with a mean of 0.07 ± 0.01 μg/L.
The United States Environmental Protection Agency (USEPA) has established an oral reference dose for perchlorate, with a drinking-water equivalent level of 24.5 μg/L [18], while the Massachusetts Department of Environmental Protection promulgated a 2.0 μg/L drinking-water standard [19]. The California Department of Health Service (CDHS) has recently established an action level of 4 μg/L for ClO4-, which, if exceeded, the CDHS advises water utilities to remove drinking water supplies.
The removal of ClO4- from drinking water/the exclusion of ClO4- from drinking water sources is critical for the protection of human health. Several different technologies have been investigated for the removal of this toxic ion from drinking water sources and/or wastewater, including ion exchange [20], biological treatment [15,21], and membrane filtration [22,23]. Several recent studies have investigated the transport mechanisms of ions such as chromate, arsenate, and ClO4- through reverse osmosis (RO), nanofiltration (NF), and ultrafiltration membranes [23-26]. These studies have shown that the degree of rejection of inorganic compounds is governed by both size and electrostatic exclusion. However, it is still necessary to investigate the effects of recovery, pH, background ions, and natural organic matter (NOM) on ClO4- rejection. Therefore, the objective of this study is to verify the existing mechanisms (i.e., size and electrostatic exclusion) for the rejection of ClO4- by RO and NF membranes under various conditions. To accomplish this, the rejection of ClO4- was measured at various pH and ionic strength conditions in the presence of co- and counterions such as Cl-, SO42-, Na+, and Ca2+ in synthetic water or in the presence of NOM.
2.1. Membranes and Testing Unit
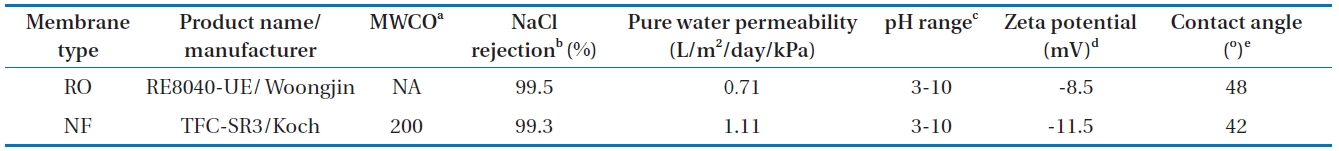
ClO4- rejection measurements were conducted using commercially available RO (RE8040-UE; Koch Membrane Systems Inc., Wilmington, MA, USA) and NF (TFC-SR3; Woongjin Chemical Co., Ltd., Seoul, Korea) membranes. The properties of the membranes are described in Table 1. These membranes have ionizable functional groups (e.g., unreacted carboxylic acids) and different membrane pore sizes (assumed from the manufacturer’s nominal molecular weight cut-offs [MWCOs]). As shown in Table 1, the RO membrane shows a relatively smaller value of high pure water permeability (PWP) than the NF membrane, presumably because permeability is influenced by pore size, pore density (porosity), and thickness. The surface charge of the membranes was estimated by measuring the streaming potential using a commercial electrokinetic analyzer. These membranes have similar hydrophobicity based on their contact angle values.
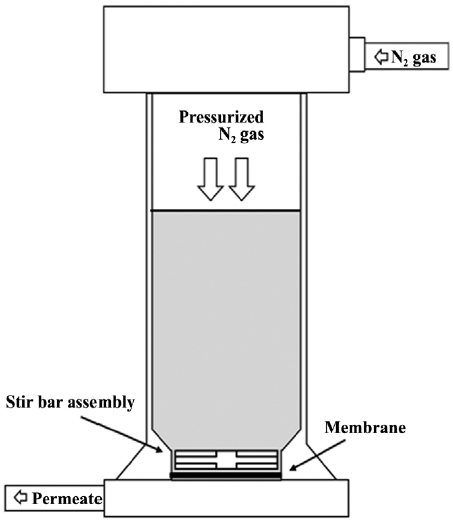
The experiments were performed in batch mode using a dead-end stirred cell that has been widely used for various membrane filtration studies [27,28]. Fig. 1 shows the schematic diagram of the dead-end bench-scale membrane system used in the experiments. Here, a brief description of the stirred cell is provided, the details of which are reported elsewhere [28]. The stirred cell (SEPA ST; GE Osmonics, Minnetonka, MN, USA) is made of stainless steel to improve chemical stability by minimizing unnecessary interactions (e.g., adsorption) between solutes and the cell. The cell has an active filtration area of 18.9 cm2 and a working volume of 300 mL. All the experiments were conducted under the same operating conditions with a stirring speed of 300

RO and NF membranes and their characteristics, along with measured water flux, zeta potential, and contact angle
rpm, as controlled by a magnetic stirrer, and different working pressures (2,070 kPa for the RO and 1,310 kPa for the NF) for a constant initial pure water flux controlled by a high-pressure nitrogen cylinder and a gas pressure regulator. A fresh membrane was used for each experiment and the membranes were pre-filtered with pure water at a pressure of 690 kPa (100 psi) for further stabilization prior to use. The stability of membrane permeability during the experiment was checked by comparing the pure water flux before and after each experiment. Only data for membranes with permeability changes of less than 5% are presented here.
The weight of the permeate was measured using a balance. The permeate flux is expressed in terms of the percentage of water recovery, defined as the percentage ratio of total permeate volume to initial feed volume. The rejection for species
where
Model water solutions were prepared with pure water from a commercial laboratory purification system (Milli-Q water purification system; Millipore, Billerica, MA, USA). The ClO4- anion (present at a concentration of 1,000 μg/L) was fed to the membrane test apparatus either as a pure component or in binary mixtures with other salts (NaCl, Na2SO4, or CaCl2) at various pH values (3.5, 7, and 9.5) buffered by 1 mM sodium bicarbonate at various solution ionic strengths (0.001, 0.01, and 0.1 M). Sodium hydroxide or hydrochloric acid was added to the pure water to adjust the solution pH. In addition, the same procedure was carried out with the addition of NOM, in the form of humic acid (Sigma-Aldrich, St. Louis, MO, USA), to represent the dissolved organic carbon (DOC). Stock solutions of the NOM isolate were filtered using a 0.7 μm pore size Whatman (Kent, UK) GF/F glass microfiber filter prior to use.
Determination of the ClO4- in samples was conducted using an ion chromatographic-mass spectrometry (IC-MS)/MS method based on EPA Method 332.0. Samples were analyzed using a Dionex ICS-2100 IC dual system (Dionex, Sunnyvale, CA, USA) consisting of a GS50 gradient pump, an Dionex ASRS 300 suppressor (2 mm), and a D26 conductivity detector (CD). A Dionex IonPac AS21 separation column (250 × 2 mm) connected to an IonPac AG21 guard column (50 × 2 mm) was used for separations. A Dionex AS-DV autosampler with 5-mL cartridges were used to inject 100 μL of sample into the IC column. A 15-mM KOH solution with a flow rate of 0.35 mL/min was used as an eluent. Calibration standards of 1 μg/L were run between every approximate 10 samples. MS was performed using an Agilent 6410 triple quadrupole MS (Agilent Technologies, Santa Clara, CA, USA) in the electrospray ionization (ESI) mode. The method detection limit was <0.1 μg/L for IC-MS/MS.
A commercial streaming potential analyzer (electrokinetic apparatus [EKA]; Brookhaven Instruments Corp., Holtsville, NY, USA) was used to measure the membrane surface charge at pH 7.5 and an ionic strength of 0.01 M NaCl. This instrument included an analyzer, a measuring cell, electrodes, and a data control system. We followed the same procedures and used the same EKA to measure streaming potential as described by a previous study [29]. The electrolyte solution was held in a jacketed reservoir kept at constant temperature by water circulating through a temperature controlled bath. External pH and conductivity sensors were placed in the electrolyte reservoir. Conductivity, temperature, pressure, and streaming potential were monitored with internal sensors. For the streaming potential measurements, membrane samples were cut to fit the measurement cell and were then wetted in NaCl solution at the desired pH, and stored in a refrigerator for the soaking time specified in the experimental design. Zeta potential (ZP) was calculated from the measured streaming potential based on the Helmholtz-Smoluchowski relationship with the assumption that the electrolyte solution, with conductivity
3.1. Effect of Recovery on Flux Decline and ClO4- Rejection
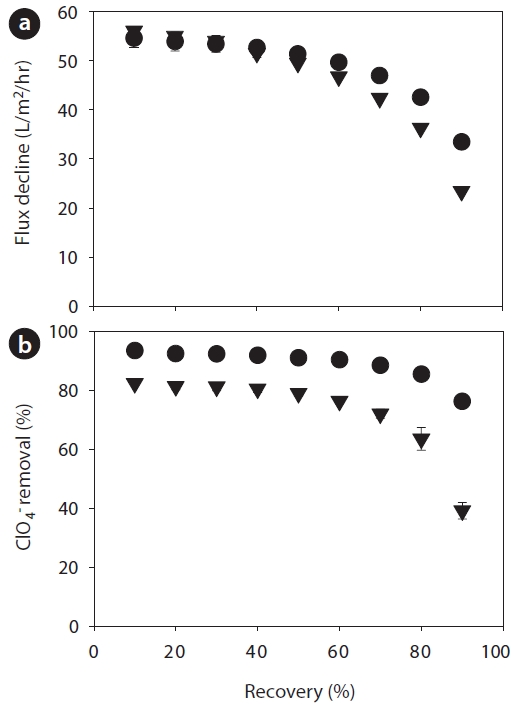
Recovery, a hydrodynamic operating parameter, was studied to determine its effects on perchlorate rejection and flux decline. Fig. 2 represents the effects of recovery on flux decline and perchlorate rejection at varying recoveries ranging from 10% to 90%. Under the specified operational conditions, the membranes showed different flux declines of 0.7?39.1% for the RO and 1.6? 58.9% for the NF membrane in Fig. 2(a). The decrease in rejection with increasing recovery can be primarily attributed to concentration polarization. As shown in Fig. 2(b), rejection trends generally decrease with increasing recovery, which is in accordance with the expectation that higher recoveries increase the product stream (permeate) and reduce the rejection stream (retention). The RO membrane showed a greater rejection of ClO4- (73?96%) than that of the NF membrane (39?82%). This is presumably because solute transport was dominated by the solution diffusion mechanism for the RO membrane, while steric/size and electrostatic exclusion mechanisms governed solute transport for the NF membrane [30]. Membrane surface charge was measured to predict ClO4- transport through the RO and NF membranes. Several qualitative predictions for the transport of this ion can be made from characterizations with the streaming potential measurements. The rejection of ClO4- may 1) increase with increasing pH owing to the increasingly negative membrane charge, 2) decrease in the presence of divalent counterions (Ca2+) because of a less negative membrane charge, 3) decrease with increasing solution ionic strength owing to the decreasingly negative membrane charge, or 4) increase in the presence of NOM because of the increasingly negative membrane charge.
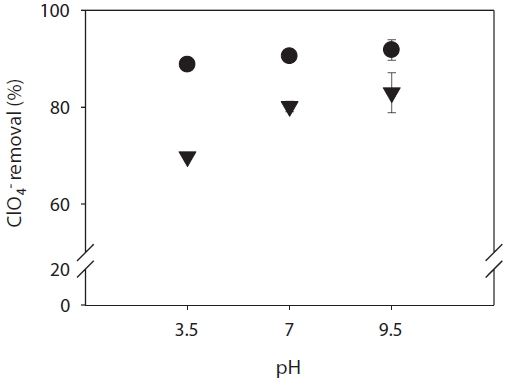
Measurements of ClO4- rejection by the RO and NF membranes were made at various pH values at a recovery of 20% in the presence of 3 mg/L NOM. The rejection of ClO4- is plotted as a function of pH at a constant ionic strength of 0.01 M NaCl (Fig. 3). In general, the rejection of ions by the membranes is dependent on the solution pH. A general trend of increased rejection of ClO4- was observed as the solution pH increased from 3.5 to 9.5. This effect is possibly attributable to adsorption of OH- in the inner plane at the membrane surface [31] or a greater degree of dissociation of fixed ionizable functional groups in the membrane. These results can also be explained by electrostatic exclusion since the membrane charge would become more negative with increasing pH resulting in increased electrostatic repulsion between the target ion and the membranes, thus increasing ion rejection. For the target toxic ion, the RO membrane, with a smaller pore size, exhibited higher rejection (88?91%) than the NF membrane, indicating that size exclusion is at least partially responsible for rejection. The rejection of ClO4- was 70?83% lower for the NF membrane with a relatively larger pore size, depending on the pH of the solution.
3.3. Effect of Mono- and Divalent Co- and Counterions and Ionic Strength
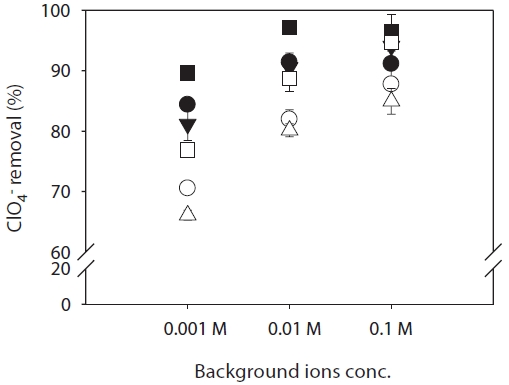
The effects of background ions and ionic strength on ClO4- rejection by both RO and NF membranes were determined using an ideal water model and a ClO4- concentration of 1,000 μg/L, using three different salts (NaCl, Na2SO4, and CaCl2) as the primary background electrolyte at a constant pH of 7, and varying the ionic strength. The results are shown in Fig. 4. Rejection of ClO4- follows the order CaCl2 < NaCl < Na2SO4 under conditions of constant pH and varying ionic strength for the RO and NF membranes tested. The RO membrane showed higher rejections (84?96%) than the NF membrane (66?94%) for all background ion and ionic strength conditionsn of ClO4- was lower in solutions containing CaCl2 (divalent Ca2+) than in those with NaCl and Na2SO4 (monovalent Na+) for both membranes. This is presumably because in terms of electrostatic interactions, Ca2+ binding causes the absolute value of the membrane’s surface
charge to decrease significantly [30]. The rejection of perchlorate by NF membrane in the presence of NaSO4 was higher than RO membrane in the presence of CaCl2 or NaCl at an ion concentration of 0.1 M. This result indicates that the electrostatic repulsion effect is stronger than the sieving effect on the rejection of perchlorate at a certain ion concentration condition. When dilute solutions containing Cl- or SO42- anions are brought in contact with a membrane possessing a fixed negative charge, Donnan exclusion shows that the rejection of chloride and sulfate may be greater than if the membrane were completely uncharged [32]. In addition, it was mentioned earlier that Ca2+ binding screens the co-ion adsorption; when charge screening by Ca2+ occurs for the negatively charged membranes, anion rejection is significantly reduced. The background ion concentration at the membrane interface influences further Donnan exclusion (e.g., greater exclusion at low ion concentrations and high pH in the presence of more divalent anions). The rejection of ClO4- is also plotted as a function of ionic strength (0.001, 0.01, and 0.1 M) in Fig. 4, which shows that the rejection of ClO4- increases with increasing solution ionic strength for both membranes. The results are inconsistent with the previous prediction that the rejection of ClO4- may decrease with increasing ionic strength of the solution, owing to the decreasingly negative membrane charge. This is presumably because background anion adsorption (Cl- and SO42-) occurring in the inner plane at the membrane surface is dominant, resulting in an increase in membrane negative charge under conditions of increased ionic strength.
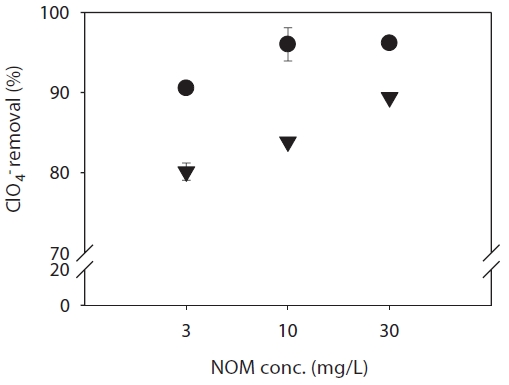
Fig. 5 shows the effect of increased concentrations of NOM (3, 10, and 30 mg/L DOC) on the rejection of ClO4- at pH 7 and an ionic strength of 0.01 M NaCl for the RO and NF membranes. The NOM found in the natural water samples represents mediummolecular- weight NOM and is somewhat hydrophobic, based on its low specific UVA254 value. In general, humic acids are dominant in surface water. In general, the RO membrane exhibited a higher ClO4- rejection (90?96%) than the NF membrane (80?90%) at the various NOM concentrations determined. Alteration of the
concentration of NOM had a significant effect on rejection; this may be as a result of the nature of NOM, which has various hydroxyl and carboxyl groups. Two assumptions were made to explain these results. It may be due to co-rejection of ClO4- with humic materials improving ClO4- rejection. Humic substances play a major role in the behavior and mobility of metals in aquatic environments. NOM is comprised of a range of organic materials, with average molecular weights of 1,000?10,000 Da [33]. Several studies have indicated a possible association between humic substances and ions/metals [34,35]. It was also assumed that once the membranes are fouled owing to the presence of NOM, the membranes become more negative, and this increases the electrostatic repulsion between ClO4- and the negatively charged membranes. In addition, more ClO4- complexes are produced at higher concentrations of humic acid. Therefore, the size of the complexes may be larger than the RO and NF membrane pores, which increases the rejection of ClO4-.
In this study, RO and NF membranes were tested to determine rejection rates of the toxic perchlorate anion. Rejection of ClO4- by the negatively charged RO and NF membranes was significantly greater than expected, based exclusively on steric/size exclusion because of electrostatic repulsion under all conditions with varying pH values, background ions, and NOM. The results also show that rejection of ClO4- by the negatively charged RO and NF membranes is significantly influenced by solution pH, possibly because membrane surface charge becomes more negative with increasing solution pH, thereby enhancing ClO4- rejection. The rejection of ClO4- increases with increasing solution ionic strength for the membranes, presumably because of an increase of electrostatic repulsion with increasing background anions such as Cl- and SO42-. Furthermore, it is presumed that the presence of NOM resulted in an increase of ClO4- rejection since the membranes become more negatively charged and their pores become smaller in its presence.