Fluctuations of climate and sea level during the Quaternary ice ages have profoundly influenced the present population genetic structures of marine and terrestrial species (Hewitt, 1996, 2000; Palumbi, 1997). Similarly associated with paleoceanographic changes, a rapid population increase has been repeatedly reported in pelagic fishes such as tuna, angelfish, sardine and anchovy during the Pleistocene (Bowen and Grant, 1997; Lecomte et al., 2004; Alvarado Bremer et al., 2005). In the Indo/West Pacific region, past climate changes are shown to have affected the evolutionary processes of speciation and population demographic changes for several teleost marine fishes (Palumbi, 1997; Williams and Benzie, 1997, 1998; Duke et al., 1998; Briggs, 1999; Sugama et al., 2002; Williams et al., 2002; Lourie and Vincent, 2004). Nevertheless, the effects of past climate and oceanographic changes on marine species in Northeast Asia remain relatively unknown, and thus interests in this question have recently began to grow.
The Western Pacific marginal seas in contiguity with the Korean Peninsula, the East China Sea and the East/Japan Sea, are interesting from a paleoceanography perspective because they experienced extreme topographical changes during the late Quaternary period (Fig. 1B) (Wang, 1999). When the global sea level reached approximately 120-130 m lower than the present level during the last glacial maximum (LGM; 19-26 thousand years ago) (Clark et al., 2009), the East/Japan Sea was closed by the rise of continental shelf that connected Eastern China with the southern part of the Japanese archipelago and the Yellow Sea had almost disappeared due to shallowness (Xu and Oda, 1999; Myers et al., 2000; Kong et al., 2006; Xiang et al., 2008). The present topography of this region was formed since sea level had risen during the post-glacial period and the Tsushima Current had flowed into the East/Japan Sea (Kitamura et al., 1999, 2001; Ujiie and Ujiie, 1999; Park et al., 2000; Li et al., 2007). Accordingly, one may expect marine organisms in this region to have a general phylogeographic signature. For example, historical demographic expansion to shallow continental margins via habitat expansion due to a rising sea level and population genetic structures reflecting historical land bridges are the most expected trends. In fact, evidence of rapid population demographic expansion has been gathered from a few taxonomically distant marine species in East Asia, such as the Japanese anchovy, Engraulis japonicas (Liu et al., 2006), crimson snapper, Lutijanus erythropterus (Zhang et al., 2006), and sea slater, Ligia sp. (Jung et al., 2008). However, samples were limited most of those studies, as they considered only a part of the ranges of the species within the region. Therefore, attempts to investigate an entire evolutionary history of one species which had been influenced from the paleoceanographic changes in the region have been hindered. Combining and comparatively analyzing molecular genetic data from multiple countries, which were reported by different researchers, suggested to be helpful for solve these problems.
In the present study, we demonstrate this approach through phylogeographic study of the ayu, Plecoglossus altivelis, in East Asia. The ayu, Plecoglossus altivelis (Order Osmeriformes, family Plecoglossidae), is an osmerid fish that migrates between freshwater and the sea during juvenile period. This species is widely distributed in East Asia, especially in Korea, Japan, Taiwan and the entire Chinese coastal Provinces except Jiangsu. It is an interesting species to investigate the effects of past climate changes on the population demography, change of distribution range and thus molecular evolution of marine inhabitants in north East Asia during the late Pleistocene period because its distributional range almost overlaps with the seas surrounding the Korean Peninsula, where severe climate change would have left salient signatures on the evolution of marine animals. Previous studies on this species have focused on the ecological aspects of its amphidromous life history and on stock enhancement due to its high commercial values in Korea and Japan (Chyung, 1977; Suda and Gomyo, 1995; Iguchi, 1996; Takahashi et al., 1998; Azuma et al., 2003; Kim and Park, 2005; Yamamoto et al., 2007). A few population genetic studies based on molecular DNA sequence data have been carried out around the Japanese archipelagos, with an emphasis on population differentiation between the mainland and island populations (Iguchi, 1996; Iguchi et al., 2006). Therefore, to understand the phylogeography and effects of past climate changes on this species at the regional level, more extensive samples from other regions which considered being their habitats need to be analyzed.
In this study, we used previously published data from the Japanese archipelagos combining our new mitochondrial control region DNA data. By doing this we intend to address the question of how and to what extent paleoceanographic changes during the Quaternary period would have impacted the population genetic structure and historical population demography of marine species in Northeast Asia.
Sixty-eight ayu individuals were caught from seven localities (Table 1) in Korea from March to July 2007, when the fishes were returning to rivers. The Korean mainland samples were acquired from six localities (Myungpa, Namdae, Osip, Maeup, Jusu and Wangpi streams) on the eastern coast and a single representative locality from the southern coast, the Sumjin River (SUM). These localities were specifically chosen to assess the fine scale genetic structure of ayu populations in Korea (Fig. 1B).
To analyze population genetic structure of ayu fishes at an extended geographic scale of East Asia, 176 additional control regions of mtDNA sequences of Korean, Japanese and Chinese P. altivelis were acquired from previous studies (Iguchi et al., 1999; Iguchi and Nishida, 2000) and Gen- Bank. Ten sequences from the Jejudo Island (JEJ), which is located in the Southern Sea of Korea, and 161 sequences from 13 Japanese ayu populations were generously provided by Iguchi and Nishida upon our request. In addition, we used five sequences from a Chinese population, although we were unfortunately not able to obtain location information for the five samples (accession no. EU124679-83).
Genomic DNA was isolated from pectoral fins using Labo- Pass Tissue Mini kits (Cosmo Genetech, Seoul, Korea). A partial fragment of about 430 base pairs (bp) from the mitochondrial control region was amplified by polymerase chain reaction (PCR) using the primers L15923 (5′-TTA AAG CAT CGG TCT TGT AA-3′) and H16498 (5′-CCT GAA GTA GGA ACC AGA TG-3′) (Shields and Kocher, 1991). The
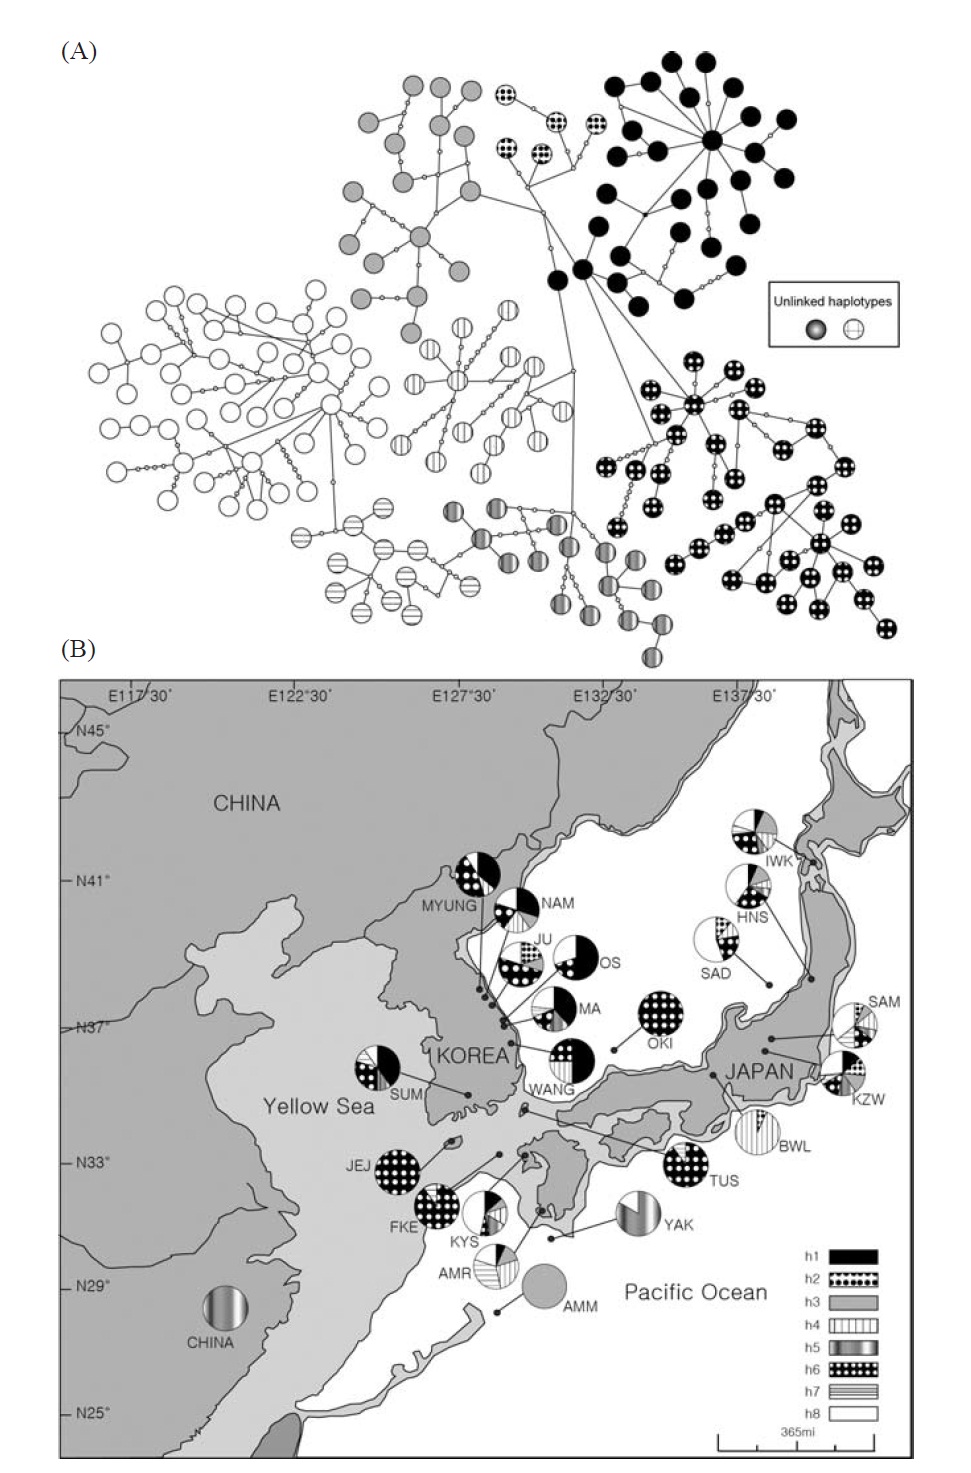
[Fig. 1.] Haplotype network of mtDNA control region sequences and sample collection sites of Plecoglossus altivelis. A, The large and small circles, both called nodes, represent each unique haplotype observed and those unseen in the DNA samples, respectively. The black and white color with a different hatching pattern for the nodes indicates eight haplogroups, which can be grouped by their closeness in genetic distance to each other. Although genetic closeness is the primary basis for the grouping, we arbitrarily decided the membership of any ambiguous nodes into certain groups as shown in the figure for the sake of convenience in labeling. Two of the haplotypes in the box could not be connected to any other haplotype in 95% parsimonious criterion, and they were from SAD and SAM respectively; B, Map of sampling localities and proportion of the mtDNA haplotypes defined in A. The darkly shaded sections on the map represent the current terrestrial area, and the lightly shaded area and its boundary lines represent ancient land masses and coastal lines during the last glacial maximum period (Ujiie and Ujiie, 1999). Each locality is represented by a pie chart and abbreviation that correspond to Table 1. The pie charts display the proportion of clade defined in the haplotype network at the different sample site.
20 μL PCR contained 2.0 μL 10× PCR buffer, 0.05 μmol Mg2+, 0.001 μmol for each dNTP, 8 pmol of each primer, 1 μg bovine serum albumin, 0.3 unit taq polymerase and 50 ng genomic DNA of each sample. The temperature profile of the PCR was set at 94℃ for 2 min, followed by 35 cycles of 94℃ for 1 min, 50℃ for 45 s and 72℃ for 2 min 10 s, with a terminal elongation at 72℃ for 7 min. PCR products were purified with a LaboPass PCR purification kit (Cosmo Genetech). Sequencing was bidirectionally performed with an ABI PRISM 3100 automated sequencer (Applied Biosystems, Foster City, CA, USA).
The 68 mtDNA control region sequences were checked and confirmed visually with the software AlignIR (Licor Co., Lincoln, NE, USA). A total of 244 control region sequences, including 176 additional sequences from East Asia populations, were aligned using clustalW (Thompson et al., 1994), which is implemented in the software MEGA (Tamura et al., 2007). Finally, the DNA fragments were confined to a length of 329 bp for further comparisons and analyses (GenBank accession no. GQ409863-932).
The 68 DNA control region sequences were used in the analysis of the population genetics of Korean mainland P. altivelis populations as well as in the comparative analysis with the other Asian populations. Analyses of molecular variance (AMOVA) were conducted by the population genetics computer program Arlequin version 3.11 (Excoffier et al., 2005). To evaluate polymorphism of the control region DNA sequences, haplotype diversity (h) (Nei, 1987) and nucleotide diversity (π) (Nei and Li, 1979) were calculated with Arlequin for all East Asian populations.
A series of hierarchical AMOVA and pairwise Φ statistics were also conducted with the same program to draw a natural and regional boundary of P. altivelis population genetic structure in East Asia. Grouping for AMOVA was based on ΦST value (Table 2). For some analyses, data from the Korean mainland ayu populations were pooled into one Korean P. altivelis population because no genetic differentiation was found among them. Of the Japanese populations, the landlocked Biwa Lake population was excluded because of its high genetic differentiation with other populations in the previous study (Iguchi et al., 1999).
A parsimonious network of the haplotypes was construct-
ed with TCS (Clement et al., 2000). We visually divided the haplotypes in the minimum-spanning network into eight haplogroups (Fig. 1A) according to an ad hoc criterion, approximate genetic closeness among them, and then presented their frequency as pie diagrams for solely temporary comparisons between localities (Fig. 1B).
To investigate population demographic changes in the recent past, the entire East Asian data set and each of the genetically distinct subsets were examined for neutrality of markers with Tajima’s D test (Tajima, 1989, 1993) and Fu’s Fs test (Fu, 1997) using Arlequin (Excoffier et al., 2005). Additionally, the mismatch distribution analysis (Schneider et al., 1999) was conducted to test the model of sudden population expansion (Rogers, 1995) for the genetically distinct groups from the result of hierarchical AMOVA and whole East Asia data respectively. The genetic groups that consist of only one population were simply excluded because they are inappropriate to represent population expansion by the effects of paleoceanographic changes in East Asia.
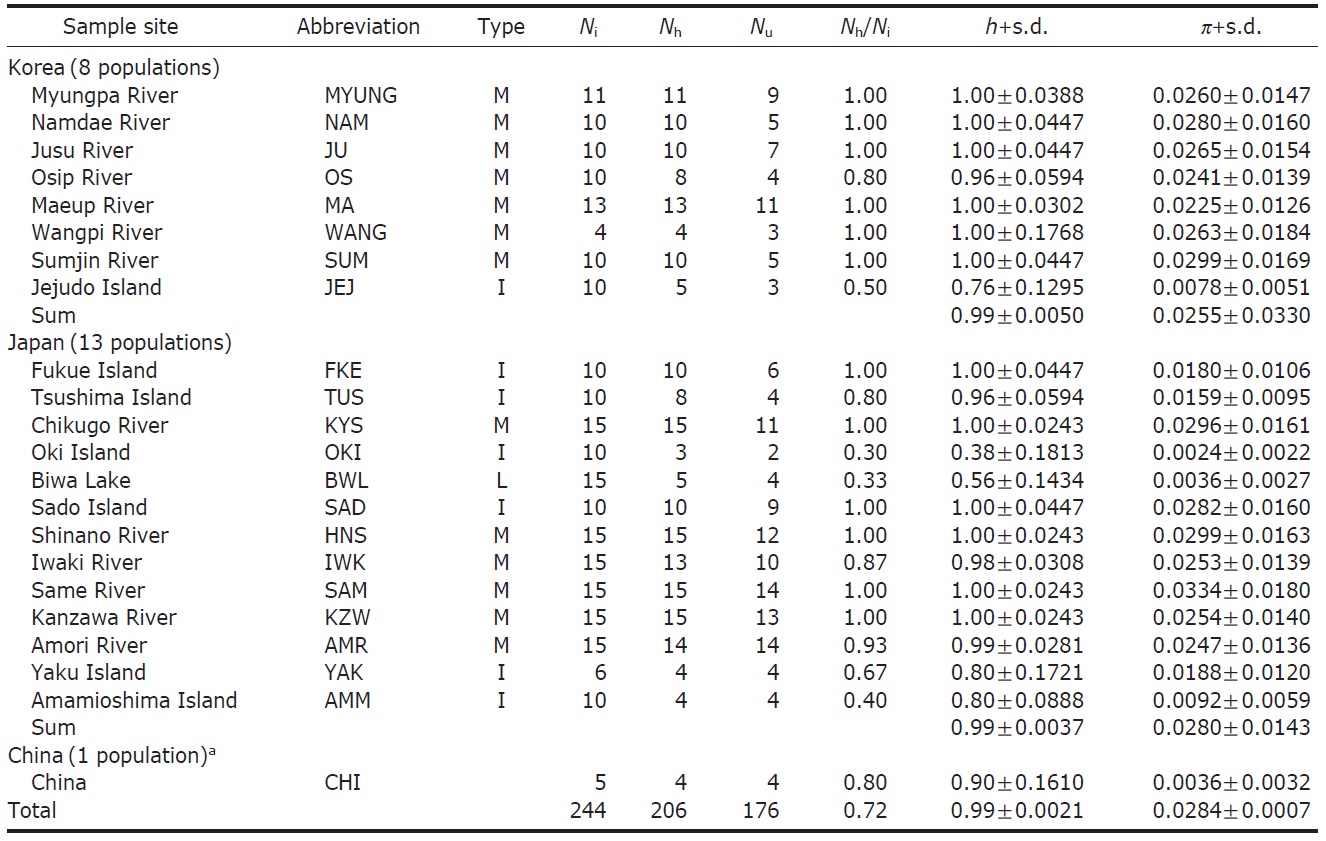
We obtained 244 control region sequences (329 bp) of P. altivelis from 21 localities in East Asia (Korea, Japan, and China), including 176 unique haplotypes. From these samples, the total nucleotide diversity was 0.0284±0.0007, and the value of nucleotide diversity within each country was also low (Korea, 0.0255; Japan, 0.0280; and China, 0.0036) (Table 1).
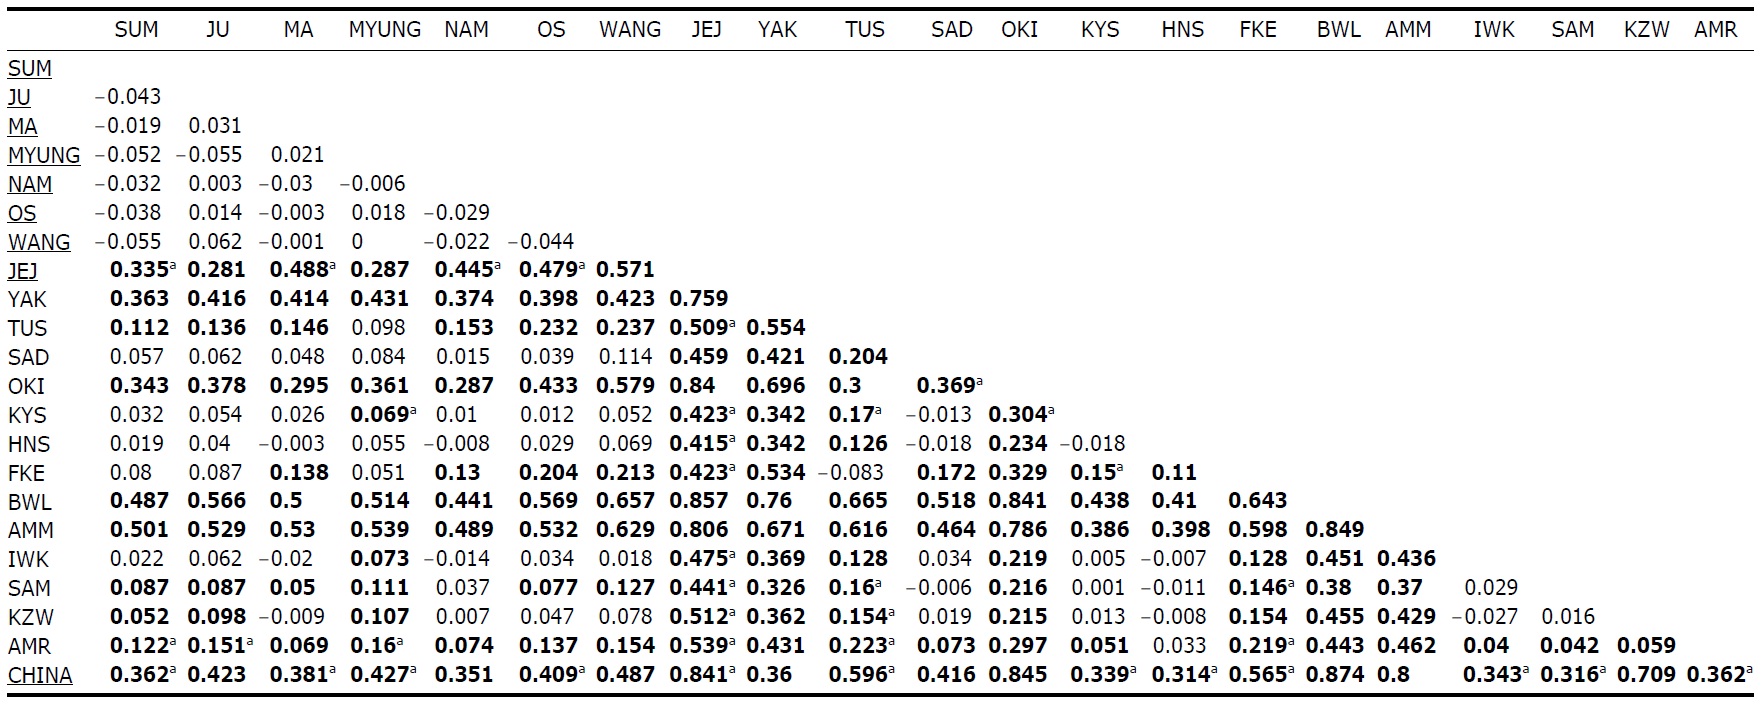
Within the Korean mainland, 68 mtDNA control region DNA sequences from seven localities were first examined for population genetic structure. AMOVA could not find any evidence of genetic differentiation, at either regional (i.e., eastern vs. southern coast) or population level, indicating high genetic homogeneity of P. altivelis populations in Korea. When the populations were examined according to two hypothetical groups, that is, Eastern and Southern (according to the geography of the Korean Peninsula) (Fig. 1B), the ΦCT value was estimated at -0.0277 (p=1.00). The great majority of variation was found within populations (103.56%) rather than among groups (-2.77%) or among populations within groups (-0.79%). By contrast, when the JEJ data (Iguchi et al., 1999) was combined with the above Korean mainland data, highly significant and large pairwise ΦST values appeared for all the comparisons between JEJ and the other mainland populations (Table 2), indicating allopatric isolation of the JEJ insular population from the mainland.
The pairwise ΦST values among populations of ayu from the entire sampling region are shown in Table 2. We could find the following general patterns from these values: i) almost all the pairwise ΦST values between mainland populations within both Korea and Japan were low and not significant, being below the overall ΦST value (0.157); ii) most pairwise ΦST values between insular populations and mainland populations were significant except for those of Sado Island (SAD); iii) comparisons between insular populations resulted in high and significant ΦST values; and iv) the isolated Biwa lake population also showed high and significant ΦST values similar to the other insular populations (Table 2). However, the significances of ΦST values from the most pairwise comparisons disappeared after Bonferroni correction (p<0.0001), except for the comparisons including Jejudo island and China populations.
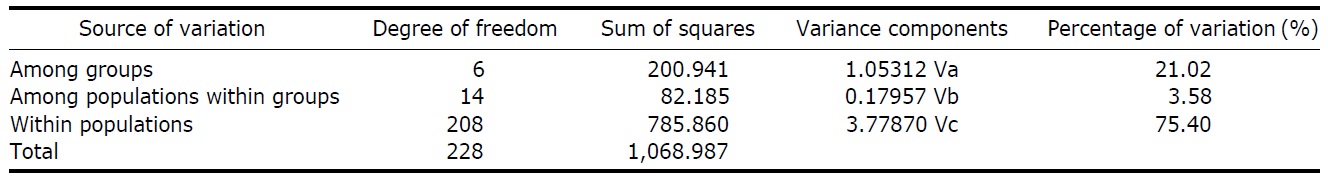
According to the hierarchical AMOVA based on the pairwise ΦST value, we could obtain a series of ΦCT values corresponding to each grouping method. The highest ΦCT value, which indicates the highest proportion of genetic variance able to be attributed to groups given the present data, was observed as 0.210 when the populations were grouped into following seven groups: Korean mainland populations (referred as “Korea” hereafter); JEJ, Tsushima Island (TUS), Fukue Island (FKE) (“Tushima”); Chikugo River (KYS), Shinano River (HNS), Iwaki River (IWK), Amori River (AMR), Kanzawa River (KZW), Same River (SAM), SAD (“Japan”); Amamioshima Island (AMM); Yaku Island (YAK); Oki Island (OKI); and China. The results indicated that the ΦCT values tended to be higher when the three island populations (JEJ, TUS, FKE) located between the Korean Peninsula and Japanese archipelago were grouped together (Appendix 1). Of four distant Japanese islands, AMM, YAK, and OKI formed separate groups, consistent with high ΦST values in Table 2 and only SAD was included in the group of Japanese mainland populations. AMOVA of this grouping resulted in a significant hierarchical genetic structure in the ayu populations (ΦST=0.246, p<0.000; ΦCT=0.210, p=0.000). The great majority of variation was contained within populations (75.40%) rather than among groups (21.02%) or among populations within groups (3.58%) (Table 3).
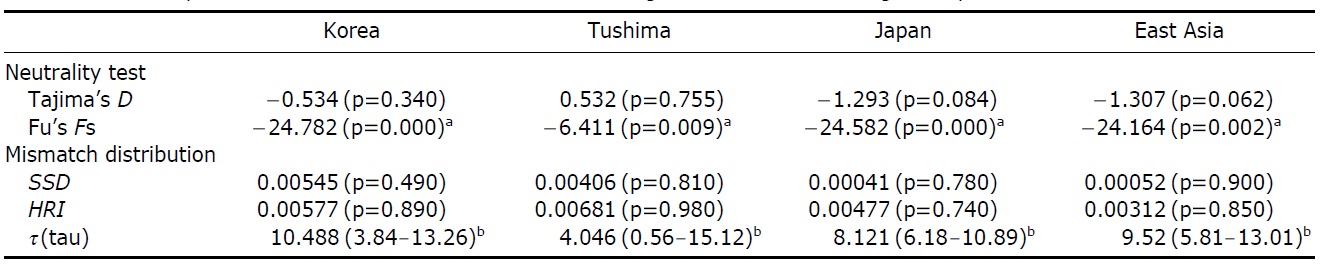
The assumption of neutrality of the control region marker was evaluated with several tests. Tajima’s D test yielded statistically insignificant results in all the four examinations (Korea, Tushima, Japan and all of East Asia) (p=0.084- 0.755), whereas Fu’s Fs testresulted in statistically significant results in all cases (p=0.00-0.009) (Table 4). Fu’s Fs test showed high negative values (Korea, -24.78; Tushima, -6.41; Japan, -24.58; East Asia, -24.16), rejecting the assumption of neutral evolution of the control region locus or constant population size of P. altivelis over a long period of time (Table 4).
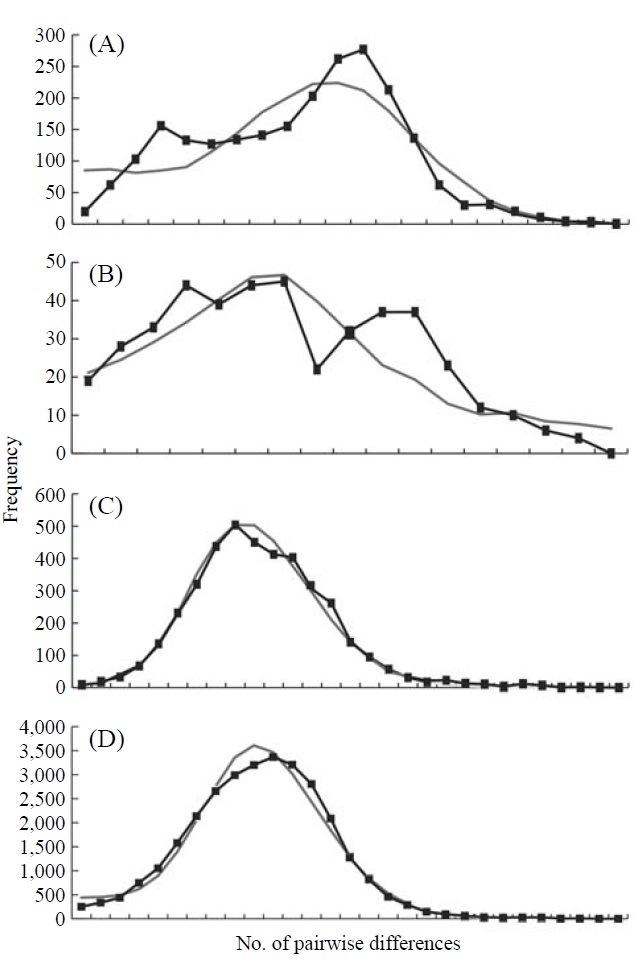
The graphs resulting from the mismatch distribution analysis showed unimodal shapes in the groups, Korea and Japan, and the whole East Asian P. altivelis population data sets,
respectively, except for Tushima group (Fig. 2). The null hypothesis of the sudden population expansion model could not be rejected in all groups either by the sum of squared deviation (p≥0.90) or Harpending’s raggedness index (p≥0.85) (Table 4).
In the present study, we intended to use the phylogeography of the amphidromous ayu to understand the effects of paleoceanographic changes on marine organisms during the Quaternary period in East Asia.
To get a more global picture of P. altivelis phylogeography, we substantially extended the sampling range of previous studies that have been conducted solely around the Japanesse archipelagos on the basis of mitochondrial DNA sequences (Iguchi et al., 1999; Iguchi and Nishida, 2000) to a large portion of East Asia, encompassing the Korean Peninsula. This resulted in a number of findings. First, population genetic structures and evidence of past demographic expansion of P. altivelis emerged more clearly as sampling range increases. However, when the analysis was confined to a specific local province, such as the Korean mainland populations, we could find no genetic structure, which suggests high gene flow rates among localities. Additionally, we could better understand a genetic connection among some islands in the Southern Sea of Korea, where island populations seem to be strongly influenced by the Tsushima Current.
We should note that population genetic structures of P. altivelis became evident obvious as the examined area increased. For instance, a significant differentiation in genetic structure was detected at the scope of East Asia (ΦCT=0.210) (Table 3), whereas the genetic pool of populations within the Korean mainland was shown to be highly homogeneous, with no significant genetic subdivision (ΦCT =-0.049). Moreover, we found that the genetic differentiation (high ΦST values) in East Asian ayu has been caused mostly by distant insular, isolated lake and Chinese P. altivelis populations (Table 2). Another factor that may have affected the patterns may be the amphidromous behavior of ayu, which migrate to the closest river rather than to their natal river during the marine stage (Kinoshita, 1993; Azuma et al., 2003; Iguchi et al., 2006). It has been suggested that the intensity of gene flow depends on the distance between populations by Iguchi and Nishida (2000). Additionally, a notably differentiated group was found to exist in three islands (JEJ, TUS, and FKE) located between the Korean peninsula and the Japanese archipelago. The most island populations tended to have high genetic differentiations to other populations, even among each island ones (Iguchi and Nishida, 2000). When these three islands were grouped together and then tested by the hierarchical AMOVA, it resulted in higher ΦCT values with the highest value of 0.210 (Appendix 1). Interestingly, these islands are located along the path of the Tsushima Current, which began to diverge from the Kuroshio Currents during the Quaternary period resulting in paleoceanographic changes in the region (Kitamura et al., 1999, 2001; Ujiie and Ujiie, 1999). Thus, we can predict that the current might have influenced long-distance dispersal and genetic connections among the three insular P. altivelis populations. According to Teague et al. (2002), the dominant northeasterly Tsushima Current between JEJ and Tsushima Island (TUS) was estimated at about 25 cm/s across varying depths of sea water, from the surface to near the sea floor. If we apply this speed to the distance between JEJ and TUS (267 km), the duration for a passively neutral object from JEJ to reach TUS without considering friction or water mass is estimated at less than 13 days. This duration may be enough for juvenile ayu to disperse to different islands within their marine life-stage before returning to rivers. Furthermore, the duration will shorten if the fish actively swim in the same direction as the current flows. Therefore, the high genetic homogeneity among the three insular populations strongly suggests a certain degree of realized migration between islands via the Tsushima Current during the ayu’s marine stage.
To understand the distribution and phylogeography of P. altivelis, it is important to consider the paleoceanographic changes in the region mentioned above. We can assume that cyclic sea-level and coastal line changes could have forced P. altivelis populations to experience a series of bottleneck and expansion events. To test this assumption, we examined the molecular DNA sequence data with neutrality test statistics, Tajima’s D and Fu’s Fs tests, and mismatch distribution analysis. Fu’s Fs statistics were significant in all data sets (Korea, Tushima, Japan and East Asia), suggesting either selection or sudden demographic expansion of the ayu population in recent past (Fu, 1997). The mtDNA control region, as a noncoding locus, is very unlikely to be under selection. Thus, the significantly negative values of Fu’s Fs statistics likely indicate an expansion of population. The negative Tajima’s D statistics may also indicate population expansion in the Japanese and East Asian data sets because the P-values of these statistics were close to 0.05 (0.084 and 0.062, respectively) (Table 4). Fu’s Fs test can detect population expansion more powerfully than Tajima’s D test (Fu, 1997). In addition, the unimodal shape and non-significant mismatch distribution statistics (Fig. 2) support a sudden demographic expansion of P. altivelis in the recent past (Rogers, 1995). Therefore, we suggest that population demographic expansion and range expansion occurred simultaneously in ayu populations across East Asia. During the Pleistocene glaciations, temperature, sea level and costal line changes may also have greatly affected both the demographic and distributional history of marine fishes (Lecomte et al., 2004; Atarhouch et al., 2006).
In parallel to the neutrality tests for the DNA sequences, the mismatch distribution analysis was used to address the question of recent population expansion in P. altivelis. Parti-
cularly, the timing of population expansion (t, expansion time in generation) was estimated using the relationships: τ=2ut and u=2μk (τ, population expansion time scaled by mutation rate; u, mutation rate for the whole sequence; μ, mutation rate per nucleotide; and k, the length of the sequence) (Excoffier et al., 2005). There is a range of divergence rates in the mtDNA control region across taxonomic groups of fish (3.6-20%) (Bowen and Grant, 1997; Donaldson and Wilson, 1999; Bowen et al., 2006; Ruzzante et al., 2008). The “time dependence of molecular rates” withinshallow evolutionary time ranges (<1 Myr) is important to consider (Ho et al., 2005; Penny, 2005; Ho and Larson, 2006). Thus, a range of rates of sequence divergence for galaxiid fish (G. vulgaris and G. divergens; 7.4-23.3% per million years) was chosen as a calibration point for molecular clock of the present study (Burridge et al., 2006). Assuming the generation time as one year (Kim et al., 2005), the population expan-sion for P. altivelis populations in East Asia (τ=9.52) was estimated to begin since 126-391 thousand years (KY) ago. In the case of Korean P. altivelis, representing genetically homogeneous mainland populations, the expansion was estimated to begin about 138-430 KY ago. Likewise, P. altivelis of the Japanese archipelagos began to expand around 126-391 KY ago. These estimates correspond to the late Pleistocene and are sufficiently broad to encompass more than two glacial cycles before the LGM. Population expansion of other fishes during the late Pleistocene was also reported from the Yellow Sea to the East/Japan Sea. In the East China Sea and the Yellow Sea, the spotted tail goby, Synechogobius ommaturus (Song et al., 2010), that inhabited Asian inshore waters and one of demersal fish in Chinese Coastal waters, Nibea albiflor (Han et al., 2008), were estimated to begin expansion 84-248 and 85-170 KY ago, respectively. Also, the sailfin sandfish, Arctoscopus japonicas, that is distributed from the east coast of the Korea and the East/Japan Sea went through expansion about 90 KY ago (Shirai et al., 2006). In the case of fat greenling (Hexagrammos otakii), the demographic history of population expansion was reported to occur during the late Pleistocene period (91-327 KY ago) (Habib et al., 2011).
In addition, similar conclusions have been drawn with other marine pelagic fish. Liu et al. (2006) analyzed the historical demography of the Japanese anchovy, Engraulis japonicas, using mtDNA control region sequences and suggested 79-317 KY ago as a population expansion time. Population of other pelagic fishes expanded during the last Pleistocene; Australian anchovy (E. australis, 45-178 KY ago) (Liu et al., 2006), Pacific sardine (Sardina sagax, 229 KY ago), northern anchovy (E. mordax, 311 KY ago) (Lecomte et al., 2004). Zhang et al. (2006) studied crimson snappers, Lutijanus erythropterus, and found genetic evidence of population expansion around 75-100 KY ago, which again supports the common population dynamics of expansion around the late Pleistocene in East Asia. However, the range of expansion time in some species is too wide to match with a single glacial event in the past. Therefore it makes us difficult to pinpoint which past environmental factors really facilitated the demographic increase in a wide array of marine fish species. The broad time estimates may be an artifact of the uncertainty in mutation rates of the DNA markers. We definitely need more accurate mutation rate estimates for the markers, although it is not likely to be easy and to come soon. Aside from the ambiguity of mutation rate in the control of mitochondrial DNA in marine fish, our estimate of expansion time since 126-391 KY ago is surprisingly well before the LGM (19- 26 KY) (Clark et al., 2009). This implies that even the severe climate change and sea level drop in the LGM could not effectively reduce the population size of P. altivelis to such a degree that it might have erased the previous population genetic signature of growth. Again this interpretation intrigues us what, then, really caused the population growth of ayu and other marine fish species since the middle to late Pleistocene period in the Northeast Asia. For a more comprehensive phylogeography of P. altivelis in its full distributional range, more samples from China should be included, because the current data set does not represent the locality. Additionally it should be noted that multiple nuclear DNA markers are necessary for future studies to verify the present result based on only single mitochondrial locus data.
In summary, the phylogeography of the ayu, P. altivelis, adds more evidence that there were prevalent population demographic changes in marine fish species characterized by population growth during the late Pleistocene long before the LGM in the Northeast Asia. Historical climate changes during the late Pleistocene, followed by sea level changes which would have inevitably led changes in the connectivity among marine populations, would have been common background for the demographic change of ayu and many other marine fish. It is likely that the distribution and population genetic structures of these fish species vary depending on their life history characteristics and dispersal capabilities.