Nowadays mobile devices are used for various applications such as making voice/video calls, browsing the Internet, listening to music etc. The average battery consumption of each of these activities and the length of time a user spends on each one determines the battery lifetime of a mobile device. Previous methods have provided predictions of battery lifetime using a static battery consumption rate that does not consider user characteristics. This paper proposes an approach to predict a mobile device’s available battery lifetime based on usage patterns. Because every user has a different pattern of voice calls, data communication, and video call usage, we can use such usage patterns for personalized prediction of battery lifetime. Firstly, we define one or more states that affect battery consumption. Then, we record time-series log data related to battery consumption and the use time of each state. We calculate the average battery consumption rate for each state and determine the usage pattern based on the time-series data. Finally, we predict the available battery time based on the average battery consumption rate for each state and the usage pattern. We also present the experimental trials used to validate our approach in the real world.
As the growth of mobile networks and services has acceler-ated, battery powered mobile devices (e.g., mobile handsets or PDAs) have emerged as important tools in our lives [1]. Mobile devices are used for various applications such as making voice/video calls, browsing the Internet, playing games etc. The bat-tery consumption of these activities affects the battery lifetime of mobile devices. A mobile device that has a short battery life-time can cause much inconvenience for users and reduce the device’s usefulness [2, 3]. Mechanisms to provide long and sta-ble battery life are therefore required. One of the methods to guarantee a long battery life is to minimize battery consumption by reducing unnecessary battery usage.
The key to minimizing battery consumption is accurately predicting the battery consumption of the various operating states of mobile devices. Much work has focused on hardware or operating system (OS) level predictions [4, 5], model-based battery life predictions [6], and battery consumption by a CPU when executing a particular instruction [7-9]; furthermore, bat-tery lifetime has usually been predicted using a static battery consumption rate, which the manufacturers of batteries and mobile devices have determined via experiments. The con-sumption rate has also been predicted by an arithmetic mean of the consumed power. However, previous methods have not been able to predict battery lifetime in terms of user characteristics, because such methods have not considered usage patterns. That is, every user has a different mix of voice call, data communica-tion, and video call usage. If each user has a consistent usage pattern [10], we can predict battery lifetime on an individual basis.
In this paper, we propose a method for predicting available battery lifetime in mobile devices based on the usage patterns of individual users. We define possible mobile device states based on the device’s basic functions, e.g., voice call and data commu-nication. We develop daily (i.e., morning/afternoon/evening/night) and weekly (i.e., weekday/weekend) user profiles that reflect each user’s life patterns, i.e., working, resting, and sleep-ing patterns for both weekdays and weekends. We measure the battery consumption and time spent in each operational state. Then, we develop usage patterns based on various modes (e.g., sleeping, resting, and working). In our previous work [11], we did not consider user life patterns for predicting battery lifetime. Here we present a method for predicting battery lifetime using usage patterns generated by the probability that a user will spend a certain time in each operational state for each mode. We then present the numerical results of a simple use case, which accurately predicts battery lifetime. We also present an experi-mental trial used to validate our proposed method in the real world.
The main contributions of the paper are as follows: 1) Because the proposed method presents real-time predicted bat-tery lifetime in terms of an on-line analysis based on usage pat-terns rather than an off-line analysis, this method is more useful to users than previous ones. 2) The proposed method enables effective battery usage by reducing useless battery consumption and detects abnormal battery usage by comparing operating times between normal and abnormal states.
The organization of this paper is as follows. Section II describes previous work for predicting battery lifetime and mobile applications for battery management. Section III defines the problem and describes our approach. Section IV presents our experimental trials with real log data from smartphones. Finally, we draw conclusions and suggest future work in Sec-tion V.
Many mobile devices provide battery lifetime prediction via hardware and OS support as an integral component of power management systems. Advanced Power Management (APM) [4] has been widely used in power management for computer systems. The Advanced Configuration and Power Interface (ACPI) [5] recently proposed by Intel, Microsoft and Toshiba is an advanced version of APM. ACPI defines power configura-tion and management functions between a Basic Input Output System (BIOS) and the OS. In particular, it uses the remaining battery capacity and present rate of battery drain to predict the remaining battery life. Currently, ACPI is used in power man-agement for desktops and laptops. The SBS Forum [12] has proposed a smart battery system, which is a specification for determining accurate battery readings; it allows the OS to per-form power management operations based on estimated run times. This system predicts battery lifetime given a user-speci-fied rate or rolling average over a fixed interval. Such simple approaches consider only a very short discharge history and are therefore inaccurate.
Another area of related research is model-based battery life prediction. Given the discharge profile of the entire lifetime of the battery, a well-designed battery model can provide a highly accurate battery life prediction. One such accurate model, described in [6], uses the low-level electrochemical phenome-non of battery discharge. This model is commonly used as a simulator to verify other battery models.
Moreover, Tiwari et al. [7, 9] and Saputra et al. [8] have studied power consumption characteristics at the processor instruction level. Combining these characteristics with battery models, one can estimate battery consumption. Model-based methods have limitations that make them unsuitable for online, dynamic and adaptive battery life prediction, such as situations where there is a need for a large number of parameters and there is a high computation cost (especially for simulation models). Our proposed method focuses on predicting battery lifetime based on the empirical usage patterns of each user, and no model-driven approach is needed.
Krintz et al. [3] proposed application-level prediction of bat-tery dissipation by investigating the degree to which battery dis-sipation, as induced by program execution, can be measured by application-level software tools and predicted by a compiler and runtime system. They presented a black-box approach in which they attempted to observe the dissipation characteristics at the application-level. However, they did not consider the effect of usage patterns at the individual user level. Thus, while this method focuses on applications, our method focuses on a user’s behavioral operating states and reflects the user’s characteris-tics, taking a more user-centric approach.
Recently, Zhang et al. [13] proposed PowerBooter, an auto-mated power model construction technique that uses built-in battery voltage sensors and knowledge of battery discharge behavior to monitor power consumption while explicitly con-trolling the power management and activity states of individual components. They also presented PowerTutor, which is an Android application for power management and activity state introspection based on a tool that uses the model generated by PowerBooter for online power estimation. This proposed method is highly related to our work but we mainly focused on using user characteristics for power estimation.
In this section, we present our method for predicting battery lifetime based on usage patterns. We firstly present a problem definition. We then describe our proposed method for solving the problem.
In order to define the problem in this paper, we also assume that a mobile device has
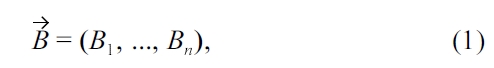
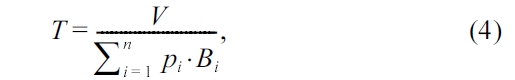
where
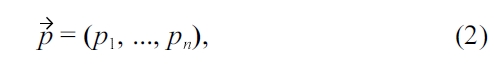
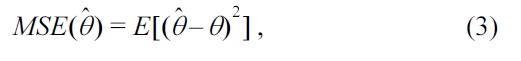
Because each user has a different vector,

according to the usage pattern, this vector is defined for the symbol that represents their usage pattern.
We can formulate our problem as follows.

and the usage pattern vector

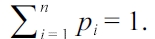
to minimize the Mean Square Error (MSE) of a predictor
where

is an estimator from our prediction method and
where
every user’s battery has a different remaining lifetime. Previous approaches cannot represent a user’s personal characteristics, because they do not consider usage patterns.
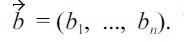
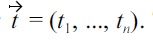
In this section, we describe a solution to the problem defined in Section III-A. The hypothesis we present in this paper is that the most accurate prediction of a mobile device’s battery lifetime is based on usage patterns and minimization of the prediction error. When a mobile device is turned on, a battery monitoring application begins collecting data on the operating time and battery consumption of each state based on a timestamp. This time-series data is used to measure the average battery consumption rate

and usage patterns

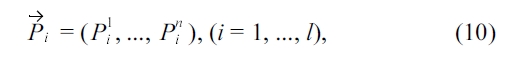
Finally, the application provides a prediction of battery lifetime based on these two vectors. Firstly, we collect the time-series data for each state. To this end, we append the time and battery level to a log file after entering and exiting the state. The symbol for the log data is the vector
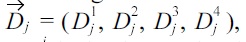
where

is a vector of the

is the time-series data of the
The value of this vector is the total battery consumption of the
The value of this vector is the use time of the
where

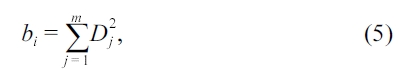
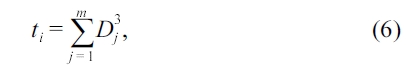
We define the average battery consumption rate and usage pattern for each user using Equations (5) and (6).
where
This usage pattern represents not only the past usage pattern, but also the probability of spending the same amount of time in each state in the future [10].
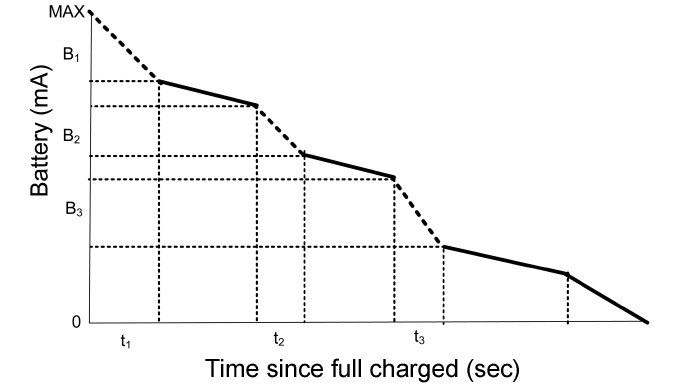
The graph of Fig. 1 plots the time-series data related to the battery power and the time spent in each state. The graph plots the time-series data collected by the data collector in terms of time and remaining battery capacity. In particular, the dotted lines indicate the power consumption and use time of the bat-tery when the user is only using voice communication with the liquid crystal display (LCD) in the “OFF” state. With an arith-metic mean of all the samples of the time-series data in each state, the average power consumption rate per state can be obtained by using Equation (9):
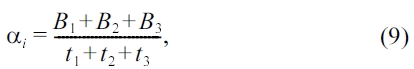
where
state,
of each user by recording the time spent in each state. However, the life patterns of most users differ according to the day or week, e.g., working, resting and sleeping (a day) and weekday and weekend (a week). In addition, users have variable life patterns, e.g., vacations or business trips. We consider user life patterns for predicting battery lifetime. We divide each day and week into several modes based on a user’s life patterns. If a mobile device has
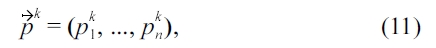
where

is the usage pattern of the

is the use time rate of the
If we predict the battery lifetime of the
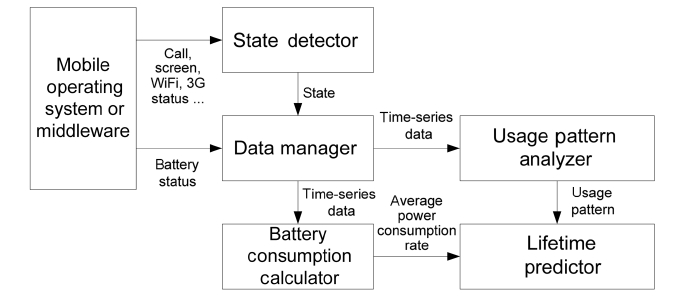
Fig. 2 shows a block diagram of our system for predicting battery lifetime based on usage patterns. The mobile device includes a mobile operating system, state detector, data manager, battery consumption calculator, usage pattern analyzer, and lifetime predictor. In general, a battery’s power consumption is affected by usage patterns that include the operational modes of voice communication, data communication, active LCD, video communication, short message service, running application programs, music listening and standby. Among these operational modes, those of voice communication, data communication, and active LCD have the largest influence on battery consumption. The state detector detects the operational state by collecting call status, WiFi and 3G status, and screen status from the mobile
operating system or middleware. It then provides this information to the data manager, which creates and stores real-time data on battery and use time in each state. The battery consumption calculator, based on the real-time data created by the data manager, calculates an average battery and use time rate for each state. The usage pattern analyzer determines a usage pattern distribution, which represents the time spent in each state. The lifetime predictor, based on the average power consumption rate and the usage pattern, predicts the available battery lifetime.
In this section, we evaluate our proposed method using real usage patterns from smartphones.
To evaluate the proposed method, we present one case study for which there were good prediction results. Firstly, we assume that a mobile device has
where

is the usage pattern of the

is the fraction of operating time that the
represents the probability that the
In Table 1, “ON” indicates an operational mode of the mobile device, and “OFF” indicates a non-operational mode of the mobile device. State S0 occurs when a user is using voice communication (e.g., calling) and data communication at the same time with the LCD in the “ON” state. This is not the current state but a potential future state. In this state, the LCD, voice communication and data communication all affect battery consumption. State S1 occurs when the user is only using voice communication with the LCD in the “ON” state. State S1 is activated from the starting point of the voice communication. In this state, both the LCD and voice communication affect power consumption. State S2 occurs when the user is only using data communication with the LCD in the “ON” state. State S2 is activated from the starting point of data communication. In this state, both the LCD and data communication affect power consumption. State S3 occurs when the user is not using either voice communication or data communication. Only the LCD is in the “ON” state. This corresponds to the standby state when a call is incoming or when the user slides up or flips up the mobile device. In this state, only the LCD affects power
[Table 1.] Possible states of a mobile device
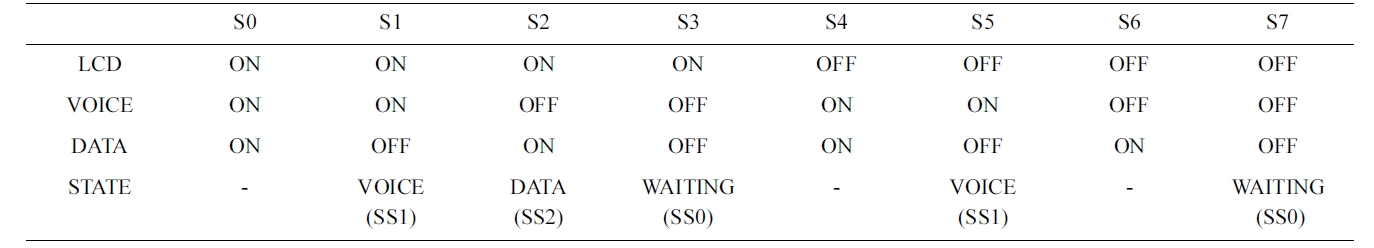
Possible states of a mobile device
consumption. State S4 occurs when the user is using voice communication and data communication at the same time with the LCD in the “OFF” state. This is not the current state but a potential future state. In this state, both voice communication and data communication affect power consumption. State S5 occurs when the user is only using voice communication with the LCD in the “OFF” state. This occurs after the user has started voice communication and a certain amount of time has elapsed. In this state, voice communication affects power consumption. State S6 occurs when the user is only using data communication with the LCD in the “OFF” state. This is not the current state but a potential future state.. In this state, data communication affects power consumption. State S7 occurs when the user is not using either voice communication or data communication with the LCD in the “OFF” state. This corresponds to the standby state when there is no incoming call, when the mobile phone has been slid down or flipped down, or when the mobile phone has simply timed out. In this state, periodic connection with a base station affects power consumption. The problem can be simplified by reducing the number of possible states to minimize the complexity. The bottom row of Table 1 shows the simplified possible states of a mobile device. We merge states S3 and S7 to form state SS0. In this state, a user is not using either voice or data communication and periodic connection with a base station and waiting for calls affect power
consumption. We also merge states S1 and S5 to form state SS1. In this state, a user is only using voice communication and this affects power consumption. Finally, we define the state S2 as state SS2. In this state, data communication affects power consumption.
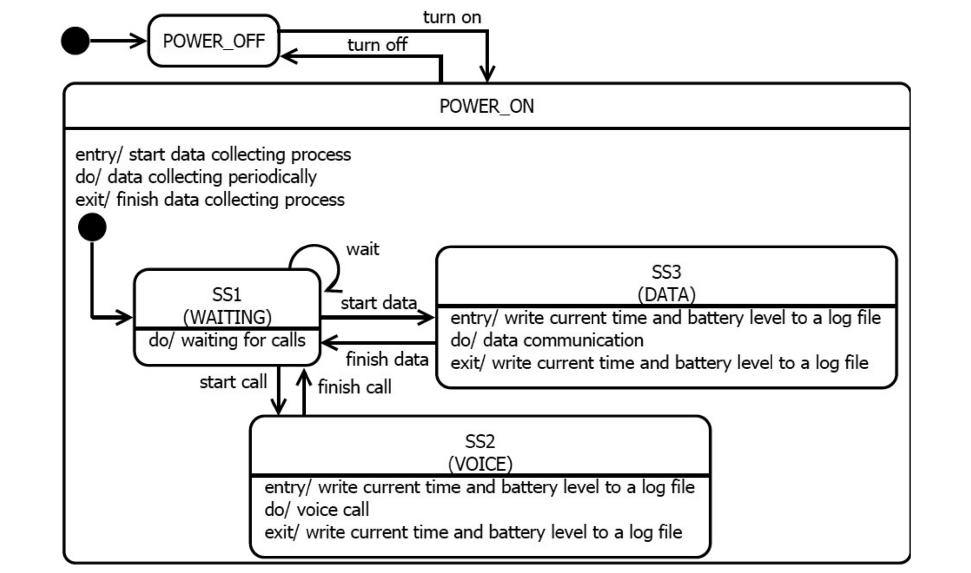
Fig. 3 shows a state transition diagram of a mobile device after simplifying the possible states. Initially, a mobile device starts from SS1 with the power on and waits to receive a call. When a user starts data communication, the current state is changed to SS3, and when they finish, the current state returns to SS1. When the user starts a voice call, the state is changed to SS2, and when they finish, the state returns to SS1. Based on these states and state transitions, we will show how we can pre-dict the battery lifetime if the average battery consumption rate and usage patterns are known by monitoring data from real smartphones.
In this section, we present our experimental trials for predict-ing battery lifetime by collecting real data from an Android smart phone, which is one kind of mobile device. In this experi-ment, we show that users have different usage patterns and our method provides better prediction results than static prediction methods in terms of personalization. Currently, we are still col-lecting a large volume of battery usage data from various partic-ipants. We present our experimental setup and ongoing work.
Firstly, we implemented a data collecting application for ana-lyzing user usage patterns. Our application was written in Java and runs on any Android-based platform. It periodically records the following information to a log file. Currently, it is scheduled to store the information every second.
Timestamp. The timestamp for the date and time of the measurement.
Screen status. Whether the screen (LCD) status is in the “ON” state or “OFF” state.
WiFi status. Whether the WiFi status is in the “ON” state or “OFF” state.
3G status. Whether the 3G status is in the “ON” state or “OFF” state.
Voice call status. Whether the voice call status is in the “ON” state or “OFF” state.
Battery status. The remaining battery power, temperature, voltage, and charging status as reported by the Android platform.
We also implemented a server system to collect log files from smart phones. The data collecting application sends the log file to the server system and then removes it from the smart
phone. When we collect log files, we also collect a device spec-ification and a device ID by using the phone number. We do not collect the phone number directly but convert it to a hash value, which we are not allowed to inversely convert due to privacy concerns. Firstly, we implemented the application on the project homepage (Battery Logger Project, http://dpnm.postech.ac.kr/battery) on February 17, 2011. To obtain users for the study, we made an announcement that we were seeking anonymous vol-unteers, using an online bulletin board for our campus, and we posted online advertisements to social network services such as Twitter or Facebook to obtain more users outside campus. Over-all, we collected 40 users from March to April, 2011 (We are still collecting usage logs for our future work). For this paper, we used the logs from the 20 users with the longest total recorded time. The data from these 20 users is 1.5 Gbytes and 1.26 Mbytes per log on average.
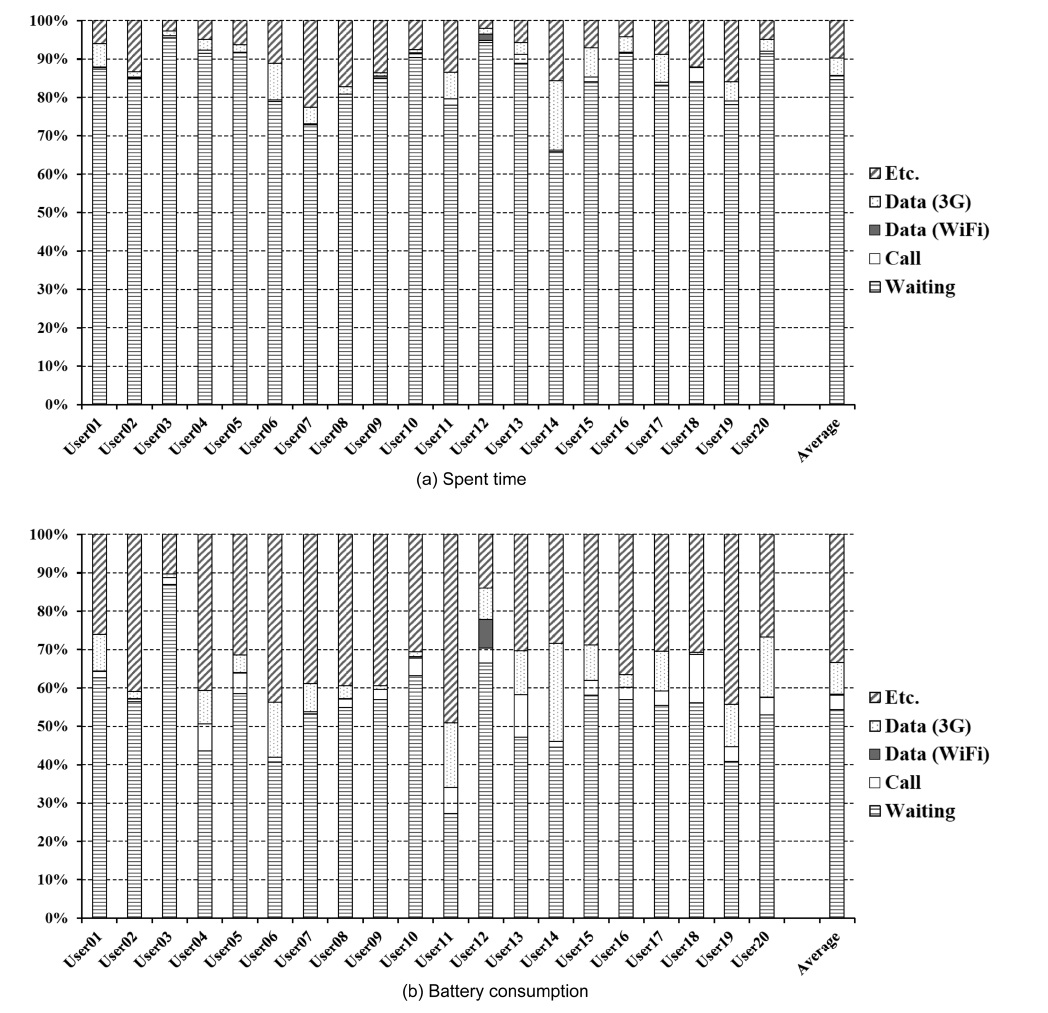
Fig. 4 shows a comparison of individual users’ time and bat-tery consumption for five operational states: 1) waiting, 2) voice call, 3) data communication via WiFi, 4) data communi-cation via 3G, and 5) other. From the comparison of time spent in each state (Fig. 4a), we can see that each user spent a differ-ent amount of time in each state. The state where a user spent more time will be used more in the future based on Zipf’s law [10] and users have their own long-term usage patterns. Hence, we assume that this usage pattern is one of the user’s character-istics. The ultimate goal of our study is to make an analytic model of user smartphone usage behavior. Fig. 4b shows the battery power consumed in each state for individual users and the differences between the time patterns shown in Fig. 4a. This chart shows that battery consumption differs in each state. As shown in Fig. 4a, most users spent more time on average in the waiting state, but every user had their own usage pattern.
The average battery consumption rates
of each state based on the collected time-series data are as follows:
If the usage pattern is given as Fig. 4a, we can define
for User12, User14, and User18 as follows:
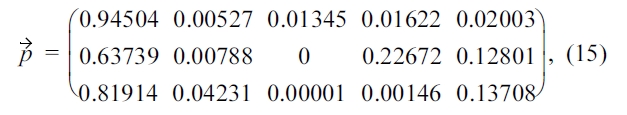
where the row and column values represent the usage pattern of each user and each state, respectively: column 1 is Waiting, col-umn 2 is voice call, column 3 is WiFi, column 4 is 3G, and col-umn 5 is other. For example, User12 spent more time in the WiFi state than other users. User14 spent more time in the 3G state, and User18 spent more time in the voice call state. To pre-dict the battery lifetime of users with different usage patterns, we compare our proposed method with a method based on a static value derived from the arithmetic mean of all battery con-sumption rates.
The average battery consumption rate based on the arith-metic mean is about 0.2006. However, the following are the average battery consumption rates for each user by our pro-posed method.
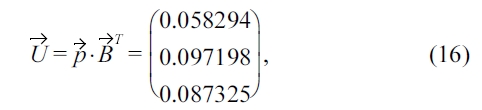
where the average battery consumption rates of User12, User14, and User18 are 0.058294, 0.097198, and 0.087325, respec-tively. From this case study, we can present different battery consumption rates for each user, based on their usage patterns. Furthermore, we can adaptively predict the battery lifetime of a mobile device using dynamic usage patterns.
Predicting the battery lifetime of mobile devices is important to minimize battery consumption at the application level. In this paper, we have proposed a prediction model based on usage pat-terns, such as the battery consumption rate when making voice calls, using data communication, or waiting for calls. We have also shown the usefulness of our proposed method through a case study.
In future work, we hope to offer a more concrete validation of this method using log data that we continue to collect from end users. We will show usage pattern distributions, battery life-time prediction results for each user, and comparisons with other prediction methods. We will also develop and deploy a mobile application to provide personalized battery management for mobile devices including battery lifetime prediction. Ulti-mately, we will contribute to personalized power management for mobile devices.