Vehicular Ad Hoc Networks (VANETs) are highly dynamic and unstable due to the heterogeneous nature of the communications, intermittent links, high mobility and constant changes in network topology. Currently, some of the most important challenges of VANETs are the scalability problem, congestion, unnecessary duplication of data, low delivery rate, communication delay and temporary fragmentation. Many recent studies have focused on a hybrid mechanism to disseminate information implementing the store and forward technique in sparse vehicular networks, as well as clustering techniques to avoid the scalability problem in dense vehicular networks. However, the selection of intermediate nodes in the store and forward technique, the stability of the clusters and the unnecessary duplication of data remain as central challenges. Therefore, we propose an adaptable destination-based dissemination algorithm (DBDA) using the publish/ subscribe model. DBDA considers the destination of the vehicles as an important parameter to form the clusters and select the intermediate nodes, contrary to other proposed solutions. Additionally, DBDA implements a publish/subscribe model. This model provides a context-aware service to select the intermediate nodes according to the importance of the message, destination, current location and speed of the vehicles; as a result, it avoids delay, congestion, unnecessary duplications and low delivery rate.
Nowadays, Vehicular Ad Hoc Networks (VANETs) are widely used by the applications of intelligent transportation system (ITS) to disseminate information related to public safety (e.g., accident warnings), dynamic local information (e.g., maps, location of the cheapest gas stations, available parking areas) and road warnings (e.g., ice, oil, water, low bridges). VANET requires a reliable communication system to support disconnections in sparse networks and to handle the scalability problem in dense networks. A VANET communication system should be smart and efficient, following the patterns and behavior of the vehicles to disseminate the information where it is needed at the appropriate moment based on the nearby context, interests and geographic location of vehicles. Dissemination of information requires intermediate nodes (i.e., guards, relay nodes, custodians or carriers) to store and forward the information. Many recent studies have focused on the dissemination of information, using the store and forward technique to provide a reliable communication system. These studies have focused on the distri-bution of information over all available paths (e.g., [1-6]) or over specific network paths (e.g., [7-11]). Each study has proposed different criteria for selecting intermediate nodes and disseminating information. Flooding [1] is one of the best known methods of information dissemination but it has several problems such as congestion and high rate of unnecessary duplication of data, due to all the vehicles receive all the data. Some alternatives have considered the selection of intermediate nodes to reduce these problems. The efficiency of these alternatives depend of the methods and variables used in the selection of intermediate nodes; certain solutions (e.g., [5,9-11]) consider the vehicular density, the direction of the vehicles, the connectivity and the delays of the paths as key variables for the selection of the nodes. Additionally, many investigators have considered the message context to mainly disseminate information to the interested vehicles and to classify the information in order to ensure delivery of the messages within the required time (e.g., [2-4]). However, these studies do not consider the destination of the vehicles and the group mobility patterns. Therefore, they select intermediate nodes based on the current location of the vehicles without knowing what path the vehicles will follow. Furthermore, they do not take advantage of the fact that the vehicles sometimes travel in groups to a certain destination when the dissemination of information occurs.
We propose an efficient
DBDA behavior was evaluated using a real-world scenario with information of 4,000 taxis in Shanghai city; this information provides realistic vehicular traces to made several simulations. The simulation results reveal outstanding performance in terms of delivery rate, overhead and delivery delay. It could be confirmed that the destination and group mobility patterns are valuable elements for the selection of custodians to improve the delivery rate and decrease the congestion and delivery delay during the dissemination of information.
The rest of the paper is structured as follows. Section II provides an overview of the approaches related to the dissemination algorithms. In Section III, we explain the scenario, the network model and the assumptions of the proposal. In Section IV, the destination-based dissemination algorithm is described. Section V includes performance and evaluation of the proposal. Section VI discusses other factors of the model. Lastly, Section VII contains our conclusions.
The selection of custodian nodes is widely recognized as an important and distinctive element for the dissemination of information. There are several methods concerning how to select the custodian nodes and disseminate the information.
The direction-aware function driven feedback-augmented store & forward diffusion (DFD-FSFD) [5] method selects the custodian nodes and disseminates the information based on a propagation function that encodes the destination areas of each message as well as the roads it should follow to reach such areas. The function can be determined based on information regarding average road traffic. It is a spatial-temporal relevance function to limit the diffusion of advertisements. Messages should be steered towards the areas within the communication range in which the function returns the lowest values. The route to the destination is the result of the function at each routing hop. DFD-FSFD evaluates the angle between the direction of node movement and the gradient of the propagation function. However, DFD-FSFD is concentrated on the direction of the vehicles rather than the destination of the vehicles.
Context assisted routing (CAR) [8] addresses the disconnections (i.e., permanent topology holes issue) by converting the road infrastructure into a weight-oriented graph. The graph is used in the forwarding decisions and in the predictive location updating algorithm. CAR proposed a mobile network partitioning method in square geographic regions, and nodes in the region are responsible for generating, receiving, storing and disseminating specific traffic context data (static or dynamic data) in the region. Likewise, the connected dominating set (CDS) [9] used a graph with junctions of the roads to explore the possibility of information exchange at the intersections of road segments where different roads join each other. In order to disseminate the information, CDS implements a query message method, taking into account the direction and speed of the vehicles, as well as the density and the connectivity of the path. CAR and CDS utilize geographic forwarding by mainly focusing on network connectivity but they are not designed to target delay sensitive applications.
Whereas, connectivity-aware minimum-delay geographic routing (CMGR) [10] considers the communication delay, adapting the idea of a beaconing period. CMGR also assumes that vehicles are equipped with digital maps that include detailed locations of streets and junctions (i.e., graph of the road). This method selects the most appropriate route according to the direction of the vehicles, the delay, bandwidth and connectivity of the route, assuming that the density along the path does not change. Another example of a method designed to target delay sensitive applications is PROMPT [11]. This method determines the paths by considering the total path delay and fairness, not just the network connectivity. Additionally, it implements a packet train technique where the transmitter can bundle multiple packets to the same destination and network traffic statistics. PROMPT employs traffic statistics to gather information of the network connectivity but the statistics become stale after a time due to potential changes in route selection and traffic demands.
These methods have emphasized maintaining the path by which information is sent, considering the geographic position, density, connectivity and delay of the paths to select the path. On the other hand, in [2-4] the information is sent through available paths, and the content of the message (e.g., customer preferences and vehicles priorities) is considered when sending the information.
Kosch et al. [2] proposed a method, which takes into account different contexts for a benefit-oriented message dissemination scheme. This method computes the relevance of the messages based on the vehicle context (e.g., the current situation of the vehicular network, current connectivity of the VANET), the message context (e.g., the amount of time elapsed since the message was generated), and the information context (e.g., the interest that other vehicles may have in the information). Similarly, vehicular event sharing peer-to-peer architecture (VESPA) [4] considers the relevance of the messages to drivers based on the concept of encounter probability (EP). EP considers the spatial and the temporal aspects of the information to implement a classification of events. The calculation process of EP includes the distance between the vehicles and the position of the event, the delay, aging penalty and direction. If the EP value obtained is greater than a certain diffusion threshold, the message is rebroadcast. However, these methods usually focus on the direction of the vehicles, rather than the destination and group mobility of the vehicles. The direction is not as accurate as the destination of the vehicles is.
In contrast, hybrid publish-subscribe [3] takes into account the destination of the vehicles, proposing a pub/ sub model to disseminate information mainly to subscribers without affecting non-interested vehicles. It computes the utility of the vehicle v with respect to a message m and applies the Dijkstra algorithm to estimate the minimum time (i.e., delay) to reach the home zone. The utility
describes how good a carrier v is at delivering m to its home zone. Although the destination is considered when calculating the delay, little attention has been paid to the group mobility patterns and classification of the messages.
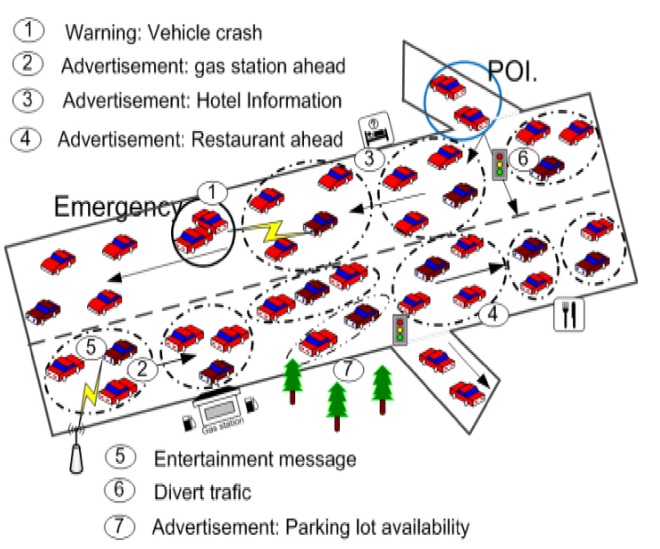
VANET connects the on board units (OBU) of the vehicles with other OBUs and with the fixed communication devices on the road such as base stations (BS). Fig. 1 illustrates a realistic VANET scenario using an ITS. In this system the vehicles exchange messages according to their interests and their current location. As can be seen in the following cases:
Message 1 is a warning about a vehicle crash; this warning has to be disseminated to all the vehicles near the collision zone and the point of interest (POI).
Messages 2, 3, and 4 are advertisements of a gas station, hotel and restaurant, respectively, which should be sent only to interested vehicles.
The advertisement of parking lot availability (i.e., message 7) is disseminated similar to others advertising messages with the difference that it contains more dynamic information due to the short duration of parking availability.
Message 5 includes entertainment information, which is sent from the BS to the interested vehicles.
The traffic light diverts the traffic to avoid congestion in the collision zone when it receives message 6 from the local server.
Therefore, the scenario includes both vehicular to vehicular (V2V) and vehicular to infrastructure (V2I) communications.
The messages are rebroadcast by vehicles to reach the target location or POI, sending the messages to vehicles that probably are not interested. In dense networks, this fact causes the scalability problem, duplication of data and congestion. On the other hand, in sparse networks, it could cause delivery delay and loss of critical data. In order to address these problems, we propose an effective dissemination algorithm based on a clustering formation. This algorithm considers the importance of each message, the context of the environment and the destination of the vehicles to propagate the messages and select the custodian nodes.
In the network three entities are considered: mobile nodes (MN), cluster head (CH), and BS.
Each vehicle has onboard units with a global position system (GPS) or navigation system (NS).
The destination of each vehicle is known. This assumption is realistic for real-world systems because GPS or NS allows drivers to enter their travel destination.
Historical information on the traffic and density of each street is available.
The communication is content-based.
The routing is geographic-based.
To transmit data efficiently, a combination of broadcast data transmission as well as store-and-forward is used.
A publish/subscribe strategy is utilized, in which the CH can be both the information provider (publisher) and the information consumer (subscriber).
The requests to the BS and the dissemination of data to the cluster members are the responsibility of the CH.
Vehicles periodically (at each Δt) exchange information to choose the CH and the affiliations to each cluster.
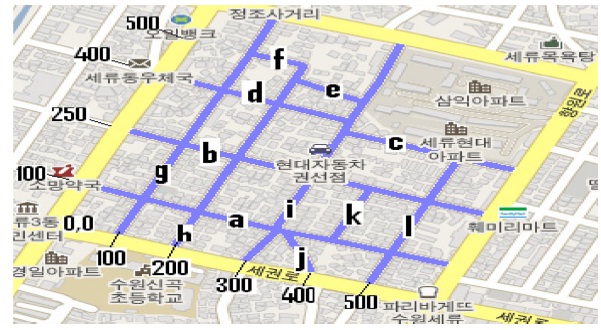
We address the locations (x, y) on the road through regions. Each region comprises a part of the city formed by streets and avenues. All the points that belong to a region are mapped to a coordinate system (x, y) as shown in Fig. 2, in which a region of Suwon, South Korea, with a dimension of 500 × 500 square meters, is mapped to the coordinate system.
We map the position (longitude, latitude and angle) of the vehicles, provided by the GPS or NS, to points (x, y) on the road within a specific region [13]. When a vehicle enters in a new region, it communicates with the local sever to match its current position and destination with the coordinate system of the region.
The regions and vehicles are identified with IDs. The IDs maintenance is addressed through the counting bloom filter (CBF) [9]. Fig. 2 presents an example of IDs
in which letters from “a” to “l” identify each road.
In some cases specifics maps of the roads and junctions of the regions are available. These maps include statistics regarding the density of the junctions. These statistics provide information to draw a detailed graph of the junctions.
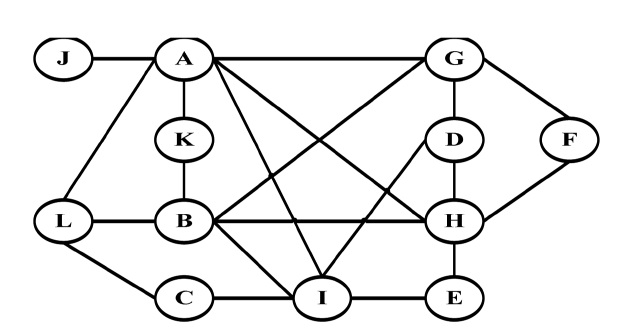
Fig. 3 demonstrates the junctions graph for the Suwon map, in which each vertex or circle represents a road and each edge or line represents junctions between two roads G = {V, E}. This graph is constructed in a similar way to the graphs proposed in CAR [8], CDS [9], and CMGR [10]. However, we incorporate the range of location (x, y) of the road and junctions (i.e., V = {id, x, y, density} and E = {id, x, y, density}) for each region. This range of locations in each vertex and edge is used to compare the destinations of the vehicles, target zones and paths of the messages. The goal of these comparisons is to only send the data for paths that are more efficient in terms of distance and vehicular density. Thus, the main purpose of the junctions graph is the selection of the best paths.
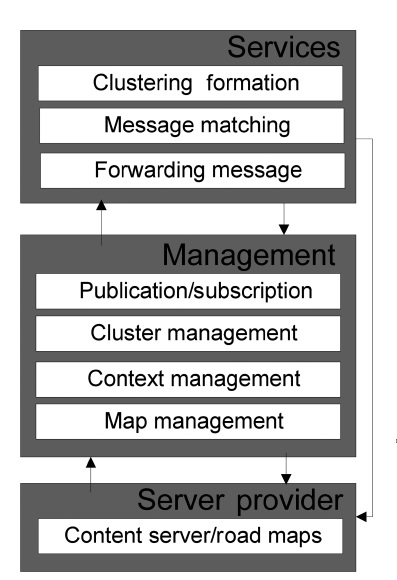
The proposed dissemination algorithm works with two important systems, the clustering formation and the publish/ subscribe strategy. The general architecture for the dissemination algorithm is shown in Fig. 4. The architecture is divided into three main modules (i.e.,
The Services module directly provides the cluster formation, message matching and forwarding message services to the requestors. The requestors are vehicles in general, both CH and MN. The entity who provides the services is usually the CH. However, in some cases these services could be directly provided by the
The
Context management and map management provide services to the publication/subscription and cluster management. The context management addresses the mobility of the vehicles, statistics and context-aware services such as the location of the vehicles (x, y), services, and events of a specific location. The map management is responsible for managing the information related to the detailed maps.
Finally, the
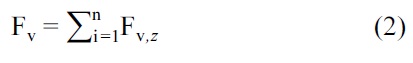
The clustering algorithm operates with the current location of the vehicles in terms of (x, y), speed, relative destination and final destination (Relative destination: it is the nearest destination according to the current region. Final destination: it is the final destination which is registered in the GPS or NS) in terms of (x, y) as parameters to arrange the clusters and select the CH. These parameters are used to calculate the relative values between two vehicles V and Z (

where
In an effort to address the high mobility of VANETs, cluster maintenance is executed. Cluster maintenance comprises the add member, delete member, update mobility changes, change of CH, and the re-clustering opera-
[Table.10] Algorithm 1 Adding members
Algorithm 1 Adding members
tions. These operations are presented from Algorithm 1 to Algorithm 5.
The thresholds related to the density, speed and bandwidth of vehicles are considered in the algorithms.
Density: The cluster should not be big because too many node members may cause overhead, nor too small because very few node members in the cluster increases the number of re-affiliations.
dmax: Maximum number of vehicles allowed in a cluster.
dmin: Minimum number of vehicles allowed in a cluster.
CHmax: Maximum amount of CHs that will form the neighboring cluster in the re-clustering operation.
Speed:
Δ
Bandwidth:
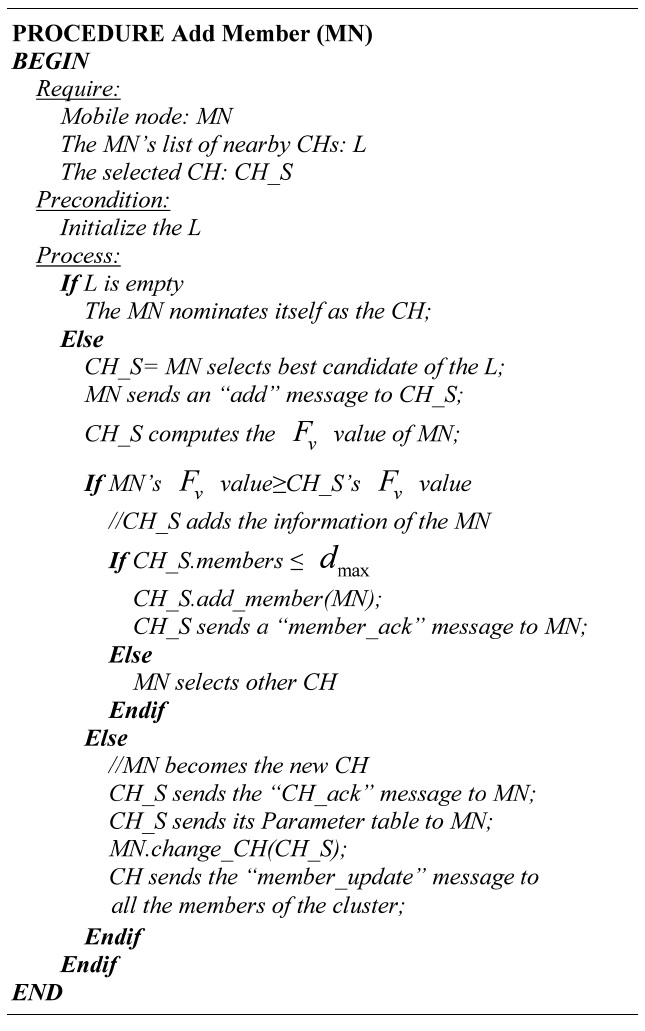
Step 1: Find the candidate CH. The MN selects the best candidate from its own list of nearby CHs. The selection of the CH depends on which has the minimum value of Fv,z between the CH candidates and the MN.
Step 2: Add request. The MN sends an “add” message to the selected CH.
Step 3: Computation of the Fv value. When the CH receives the “add” message, it computes the Fv value of the MN and compares it with its own value.
Step 4: Add the MN. Depending on the Fv values, two cases might occur.
Case 1: The Fv value of the MN is not less than the Fv value of the CH. Therefore, the CH adds the information of the MN to the cluster. The CH
[Table.11] Algorithm 2 Deleting members
Algorithm 2 Deleting members
checks the dmax value and the current quantity of members to avoid violation of the threshold. The CH adds the MN and replies with a “member_ack” message. If a violation of the threshold exists, the MN has to select another candidate to be the CH, starting from step 1.
Case 2: The Fv value of the MN is less than the Fv value of the CH. Thus, the MN becomes the new CH. The CH sends the updated information of all the members with the “CH_ack” message to the MN; consequently, the MN is the new CH. The new CH sends the “member_update” message to all the cluster members.
If the MN cannot locate a CH, it will nominate itself as the CH, forming a new cluster.
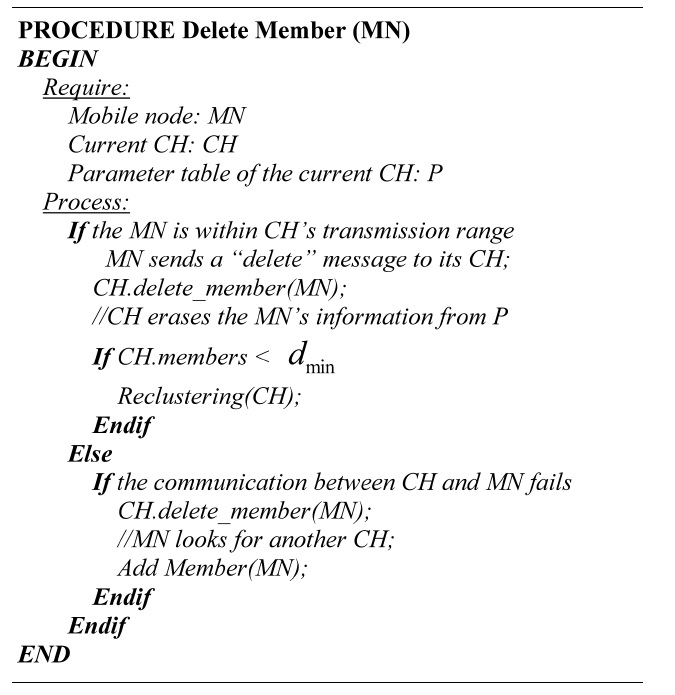
A node member is removed from the cluster if any of the followed cases happen:
Case 1: The MN is within the transmission range of the CH.
Step 1: Delete request. The MN sends a “delete” message to conclude its subscription with the current CH.
Step 2: Erase MN. The CH erases the information of the MN and compares the current number of
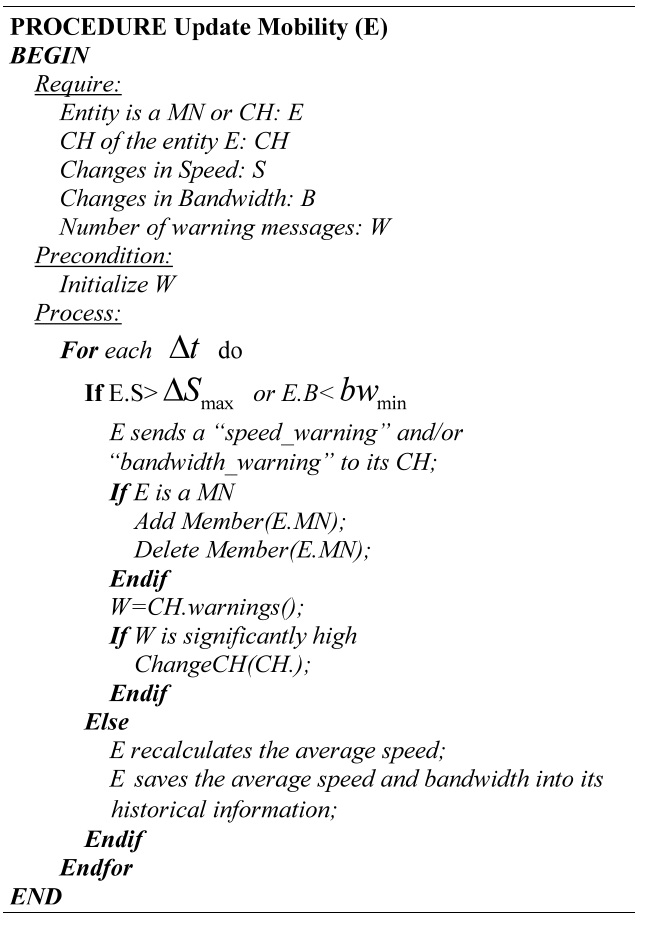
[Table.12] Algorithm 3 Updating the mobility changes

Algorithm 3 Updating the mobility changes
members against the dmin value.
Case 2: The MN is out of the transmission range of the CH.
When a MN is unreachable, both attempt to communicate during the time to live. If the communication fails, the CH deletes the MN’s information and the MN starts to look for another CH.
For every Δt, each entity (CH or MN) verifies if there are changes in the average speed and the bandwidth. If the absolute change in speed is less than or equal to
MN sends a “speed_warning” or “bandwidth_warning” message to the CH. The MN compares the Fv,z value of the current CH with the Fv,z values of the list of nearby CH. If the value is less than the current Fv,z value, the MN is affiliated with the new CH.
CH registers the number of “speed_warning” and “bandwidth_warning” messages received at Δt interval. CH discards repeated messages. If the number of warning messages is significantly high, CH performs the change of the CH.
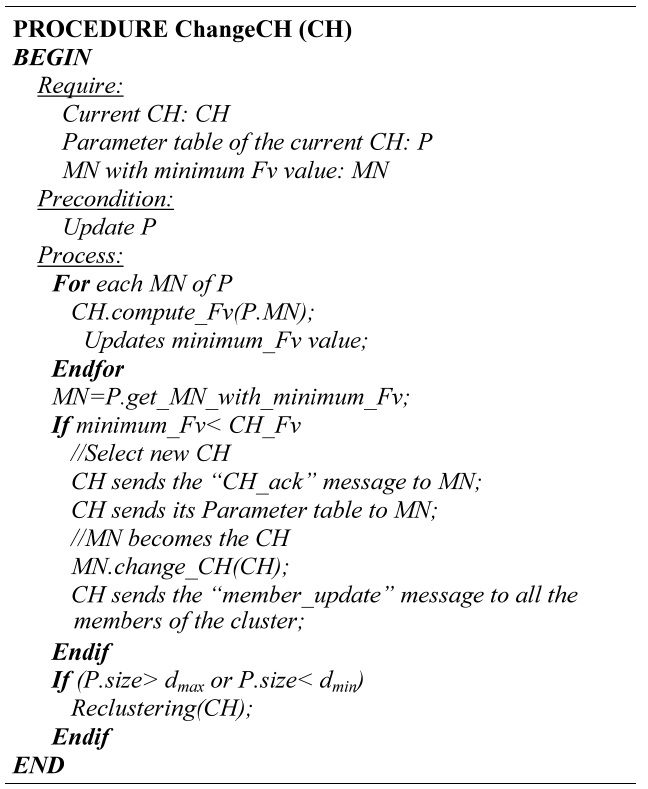
Step 1: Computation of the Fv values. Calculate the Fv
[Table.13] Algorithm 4 Change of CH
Algorithm 4 Change of CH
[Table.14] Algorithm 5 Re-clustering
Algorithm 5 Re-clustering
values for all the MN members of the cluster.
Step 2: Select new CH. If the current CH is not the one with the minimum Fv value, it sends the updated information of the cluster members and the “CH_ack” message to the MN with the minimum Fv value. This MN becomes the new CH and it sends a “member_update” message to all the MN in the cluster.
Step 3: Threshold verification. A verification procedure for the number of members within the cluster is performed, checking the limits dmin and dmax.
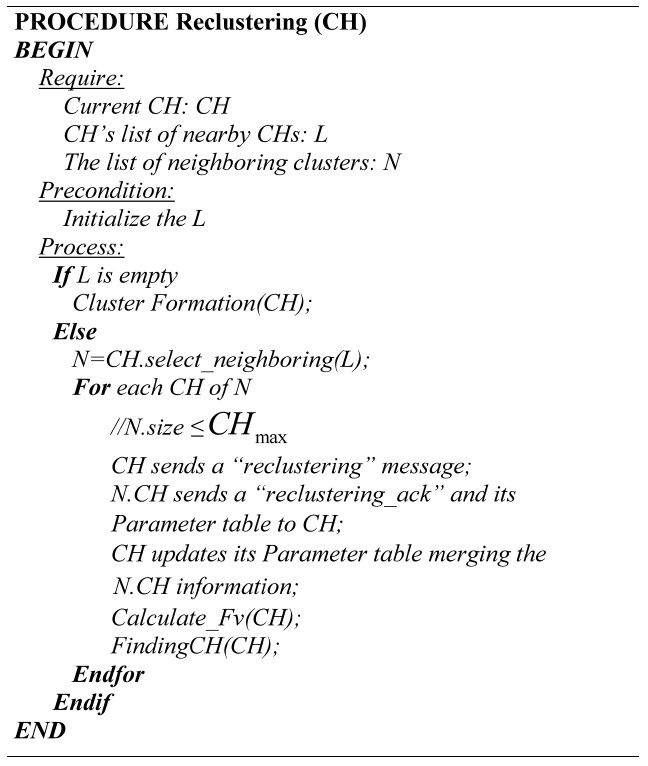
The re-clustering process performs the merging and the division of clusters. Throughout the clustering process, there are some events that determine when to make the re-clustering process.
Event 1: Deleting a cluster member. After the CH deletes a member, it checks the number of members, if the amount of members is less than the dmin value the re-cluster is mandatory.
Event 2: Change of CH. If the amount of the member is less than the dmin value or greater than the dmax value the re-clustering process is executed.
Re-clustering process includes the follow steps:
Step 1: Select the neighboring clusters. The CH which initiates the process selects from its list of nearby CHs the neighboring clusters that will participate in the process. The maximum quantity of CHs must not exceed the CHmax value.
Step 2: Re-clustering request. The selected CH sends his members information and a “reclustering_ack” message, only to the CH which initiated the process. All the information is merged by the CH, which initiated the process.
Step 4: Computation of the Fv values. The collected information is used to calculate the Fv values.
If the CH which initiated the process does not have any near CH, the re-clustering process turns into a cluster formation process.
>
B. Publish/Subscribe Strategy
The subscriptions are divided into automatic and custom subscriptions [3,4]. In [4], the automatic subscriptions are the events relevant to the vehicles, and custom subscriptions are the events relevant for the drivers. Custom subscriptions are specific interests of the drivers, such as, information regarding nearby restaurants, gas stations, parking or hotels. Automatic subscriptions are calculated depending on the current location. For example, the vehicle will subscribe to an accident or traffic warning service that affects the current route.
The CH has a list of the other nearby CH’s, a l. of the subscriptions (automatic and custom).
1) Publication/Subscription Maintenance
The publications and subscriptions are constantly changing based on the current context or environment. Therefore, it is possible to add and delete subscriptions and publications dynamically.
Add subscription: When the CH receives a new subscription from some of its members, it adds the new subscription to the list.
Delete subscription: The CH deletes the subscription from its subscription list if the subscription is not required for any member.
Add publication: When an event (e.g., accident) comes up, the witness node sends a message to its current CH to publish the event.
Delete publication: At each Δt, the CH checks the time to live (TTL) of the publications to eliminate obsolete publications from its publication list and verifies the diffusion area, which is based on the home location, the target location of the publication, and the current location of the CH. The TTL and diffusion area are used to eliminate publications that are not of interest.
In order to generate useful data when two CHs start the message exchange, both CHs share their current publication messages.
2) Match Function
In order to determine which messages match with the interests of the subscriptions, the CH implements a match function.
The execution of the match function constitute the following steps:
Aging threshold: Compares the aging threshold of the message against the time that the message has traveled in the network. Δa quantifies this comparison through Equation (3) where “t” is the current time. The equation shows two cases. When the time that the message is traveling in the network (i.e., current time (t) minus creation time of the message (CT), (t ? CT)) is less than or equal to the TTL, the value of Δα is between 0 and 1; otherwise the value of Δα is greater than the value of TTL [15].
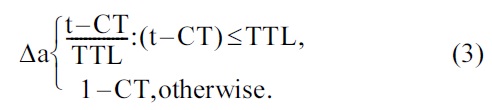
Equation (3) ensures the penalty for all messages that surpass the TTL value.
Priority: It is the calculation for the priority of the message which is a value between 1 to n.
Distance threshold (Δd): The calculation of Δd requires two values: the distance from the target location of the message to the current location and to the relative destination of the vehicle.
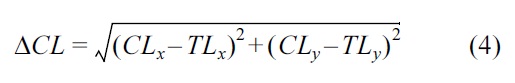
Distance to the current location ΔCL: It is the difference in distance between the current location of the vehicle (CL) and the target location (TL) in terms of (x, y) coordinates [15], calculated using Equation (4).
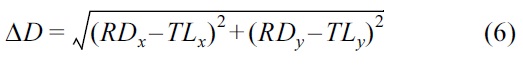
Distance to the relative destination ΔD: It is the difference in distance between the relative destination of the vehicle (RD) and TL in terms of (x, y) coordinates [15]. This difference can be calculated with the information from maps as shown in Equation (5).
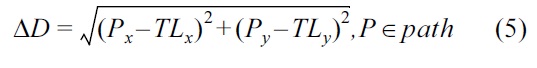
where P is the nearest point to the TL. This point is part of the path of the vehicle. However, in some remote areas, the availability of maps is limited. In this case Δ
This calculation of Δ
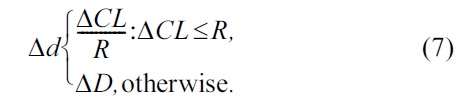
The value of Δd is calculated for each TL by selecting the minimum Δd.
Match Subscription (MS): The match subscription is a binary value, 0 when no subscription matches the message and 1 when at least one subscription matches the message. If the message belongs to the custom category, the match subscription is 1 if ΔCL ≤ R; otherwise it is 0. On the other hand, if the message belongs to the automatic category, the match subscription is 1 if at least one of the lists of subscriptions has the same type of message.
Finally, the relevance of the messages is calculated by taking into account the ageing threshold, the priority, the distance threshold and the match subscription [15].

In Equation (8) the weights w1, w2, w3, and w4 determine the importance of each variable. The messages with the lowest “Relevance” values are the most important messages. The CH selects the messages to be published or deleted according to the “relevance” value. This selection process aims to deliver only the messages that are important or interesting to each vehicle, at the most opportune time in order to avoid congestion, delay and duplication of data.
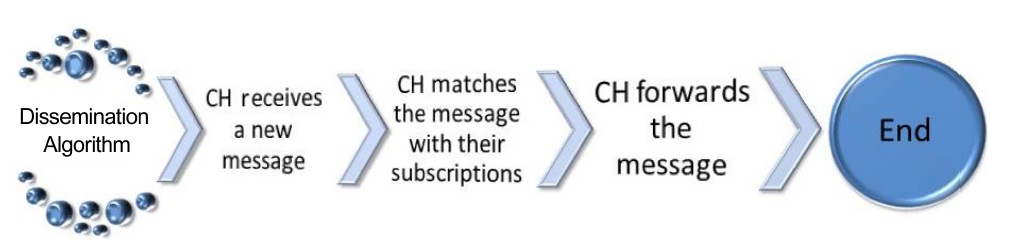
The basic steps of the dissemination algorithm are shown in Fig. 5. The step to match the message against the subscription is implemented by the match function providing the relevance value of the message. This relevance is used to rebroadcast the message to the interested vehicles [12].
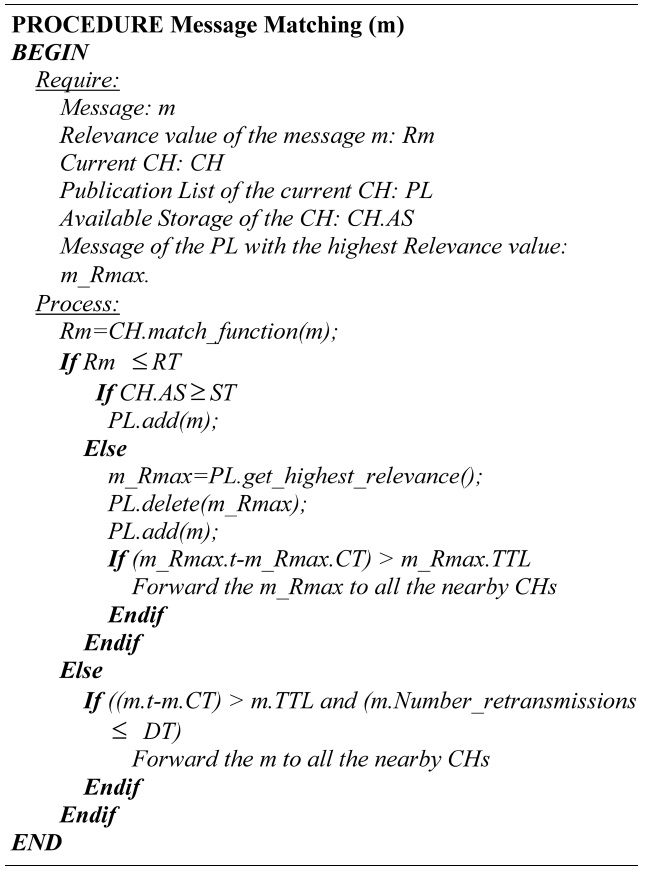
1) Message Matching
After the CH obtains the relevance value, the CH completes the verification to decide if the message will be published (forwarded to its cluster members), forwarded to its neighbor nodes or dropped, by checking the following thresholds:
Relevance Threshold (RT): This threshold determines which messages are important for the cluster members. If the relevance value of the message is less than the threshold, the message has to be published and
forwarded to the cluster members.
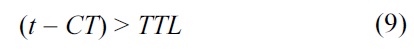
Storage Threshold (ST): Before publishing a message, the CH verifies if the available storage is greater than or equal to the storage threshold. When the available storage is less than the storage threshold, the CH deletes the publication with the highest relevance value and adds the new message. Furthermore, the deleted publication is forwarded to all the nearby CHs, if the condition presented in Equation (9) is true.
Dissemination Threshold (DT): The goal of this threshold is to dynamically adjust the algorithm according to the vehicular density in order to avoid congestion in dense networks and packet loss in sparse networks. The CH determines the number of
[Table.15] Algorithm 6 Message matching
Algorithm 6 Message matching
retransmissions in regards to the messages depending on the vehicular density.
Algorithm 6 illustrates how the CH executes the process of message matching.
In an effort to rebroadcast or propagate messages efficiently, we consider two scenarios. 1) Information is propagated within the TL or POI, and 2) information is propagated out of the TL (delivery-IN and delivery-OUT [5]). In the first scenario, the goals are to send the automatic subscriptions to all vehicles (i.e., broadcast) within the CL and send the custom subscriptions only to the interested vehicles using the “Relevance” value. A variation of the flooding dissemination is implemented, in which the CH sends the messages to all its neighbors and each CH rebroadcasts the messages to its clusters members.
The second scenario is more complicated. The CH must select the best carriers or custodians of the messages to reach the TL (POI) (e.g., multicast, geocast, and unicast) and to minimize delivery of messages that are not of interest. Selection for the best carriers includes the following tasks:
a) Density measures: The dissemination algorithm takes advantage of road statistics to calculate the density. Vehicular density is an essential factor to ensure a high delivery ratio because we need to select a path with good connectivity that is dense enough to reach the target location but not so dense that it will generate overhead and cause a low bandwith. Therefore, we used a similar version of the method proposed in CMGR [10] to calculate the connectivity in the network through the average expected value of the density over a certain period of time T (TρV). In order to calculate this value, we define the variables that describe the rate of change in the neighboring area of the vehicle V (rV) and the density in the neighboring area of the vehicle V (ρV). rV is calculated using statistics and ρV is calculated using message exchanges as can be seen in Equation (10).
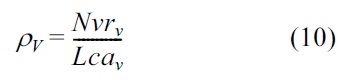
where Nvrv is the number of vehicles in the transmission range of V, and Lcav is the length of the coverage area.
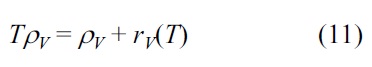
The density of the neighboring area for vehicle V during a certain period of time T (TρV) is calculated through Equation (11).
Additionally, the number of retransmissions for messages can be adjusted according to the density and the priority of the messages through a forwarding method, which only rebroadcasts updates of information at the junctions (graph-based predictive location service) [8] when dense scenarios and low priority messages are present. Furthermore, when two vehicles are rebroadcasting the same messages, the forwarding method selects the vehicle which has a better location (x, y) with respect to the TL to rebroadcast the message. When this occurs, the vehicle with the worst location stops re-diffusion of the message.
b) Path management: In an effort to avoid congestions caused by flooding dissemination, vehicles can forward the data only through specific paths on the road. Selection of the paths is implemented with information provided by the road maps (e.g., number of lanes, junctions in the road). This method is similar to the method presented in CDS [9] and CAR [8]. However, we consider the (x, y) location of each junction in order to select the best path in terms of the shortest distance to the POI and average speed (The Dijkstra algortihm is used to calculate the shortest path and highest conectivity). To improve the performance of the algorithm, it is possible to implement an aggregation algorithm such as TrafficView [16] to disseminate the information in bundles.
c) Custody transfer: For the purpose of reducing the packet loss and delivery delay in sparse networks when there is no path having sufficient connectivy, the algorithm implements a store and forward technique by selecting a custodian to carry the messages. The selection of the custodian depends on the relevance of the message as well as the current speed and storage capacity of the vehicle. In order to reduce the delivery delay of important messages, critical messages have priority over non-critical messages. When a custodian of a specific message is leaving the POI; it has to transfer the message to another custodian. In an effort to ensure the delivery of the messages, an acknowledge mechanism is performed. In this mechanism the current custodian has to carry the message until it finds another custodian which assumes responsibility for the message. In addition, we implement a carry-and-forward network (CafNet) [17] to take advantage of the infrastructure. Thus, messages are sent across an intermittently connected network through the BS or hot spots similar to the VPN proposed in CAR [8]. However, in dense networks, our solution avoids the formation of bottlenecks that can occur in the BS or hot spots by classifying the messages through the Relevance value. This classification prioritizes critical data.
Algorithm 7 summarizes the forwarding method. As can be seen in this algorithm, the message
[Table.16] Algorithm 7 Forwarding message
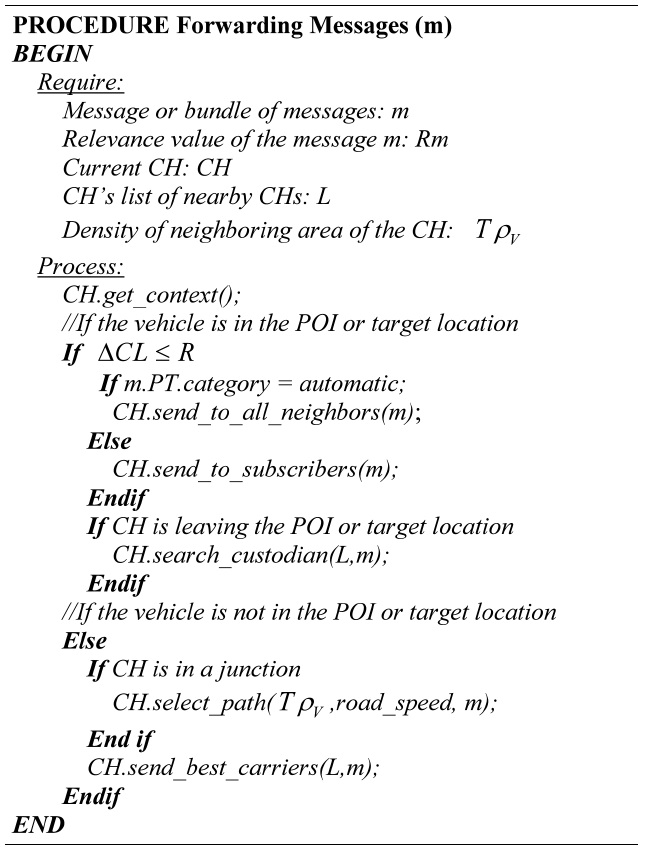
Algorithm 7 Forwarding message
message or a bundle of messages with the same target location.
We evaluated the proposal through a set of simulations. These simulations were developed in Java JDeveloper since a generic simulator is difficult to use, due to the diversity and flexibility of the scenario.
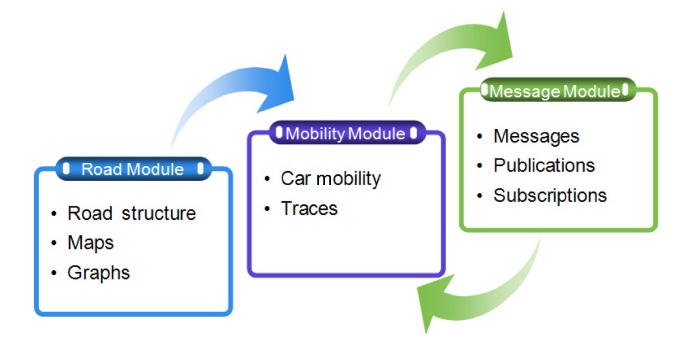
Fig. 6 illustrates the basic structure of our simulator. The initial input for each module is a group of files, which are loaded when the simulation begins.
The
Additionally, this module includes detailed maps of the road for the regions. These maps form the junction graph G = {V,E}.
The
The mobility module addresses all instances of vehicles
and their movements or traces. The traces can be generated automatically by selecting random initial positions and destinations or generated through input files. The input files include information on the traces of each vehicle.
In order to perform these simulations, we included the information of 4,000 taxis in Shanghai obtained from the Wireless and Sensor Networks Laboratory of Shanghai Jiao Tong University [9]. This data consists of a collection of GPS information that includes the real-time locations of taxis in the urban city of Shanghai. The GPS information includes the ID of the taxi, the longitude, latitude and angle of the current location of the taxi, speed of the taxi, and the time that the GPS record was sent. This information provides real-time information on the taxis, fitting each GPS register to road maps, with interpolation help in cases when the data obtained by GPS did not provide a clear trajectory. Additionally, we modified these data by adding a destination to the taxi’s trajectory.
The
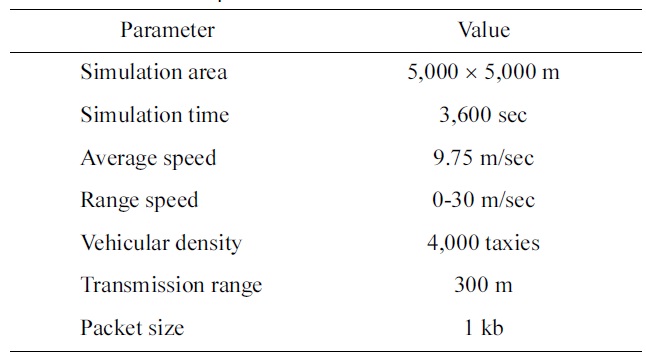
The general parameters that we used during the simulation are listed in Table 1.
[Table 1.] Simulation parameters

Simulation parameters
Each taxi followed its trajectory. Upon reaching its destination, the taxi was removed from the network and inserted from its initial location. This process was repeated during the simulation time. The taxis were grouped in clusters assuming the availability of a detailed road map. The metrics considered in our performance evaluation are: delivery ratio (% of delivered messages), overhead (average number of retransmissions per message), and delivery delay (delay of the delivered message).
In an effort to evaluate the dissemination algorithm, we simulated sparse networks and dense networks, in which a new message is generated every 120 seconds. Forty percent of the messages were custom subscriptions, 40% were non-critical automatic subscription, and 20% were critical automatic subscriptions. The TTL of each message is 300 seconds.
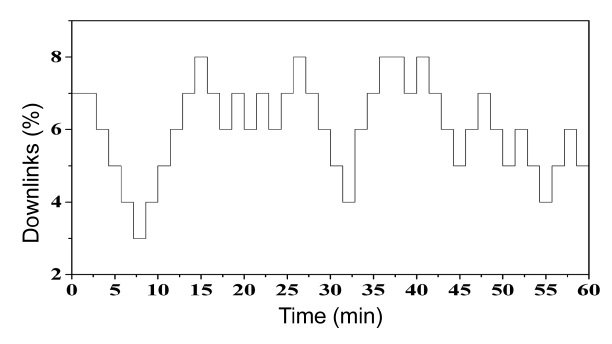
In addition, we included intermittent links [18] to test the behavior of the algorithm in sparse networks. Fig. 7 shows the patterns of the intermittent link over the course of one hour.
For the purpose of this study we assumed a vehicular density between 30 and 35 vehicles per km2 during rush hours and between 10 and 15 vehicles per km2 during low density hours. This assumption is validated according to the information from the taxis.
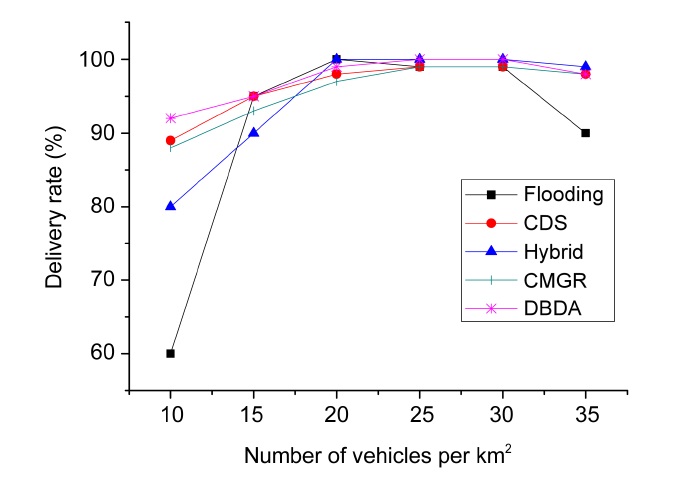
Fig. 8 presents the delivery rate percentage of our DBDA compared with the flooding, CDS, and hybrid publish/subscribe and CMGR algorithms. We vary the number of vehicles per square kilometer (km2). This figure exhibits a clear trend; when the vehicular density is low, the delivery rate decreases. The same behavior occurs when the vehicular density is high. This behavior is due to intermittent links at low vehicular density and congestion at high vehicular density. As revealed in Fig. 8, flooding dissemination demonstrated the worst performance because it does not address the disconnections or the scalability problem. On the other hand, with low vehicular density, the other algorithms implement a store and forward strategy. The hybrid publish/subscribe employs a metric based on the delay (time to reach the POI) that is
similar to the connectivity metric of the CDS and CMGR. A significant difference is that CDS and CMGR consider the density and delay to have a higher delivery rate than the hybrid publish/subscribe. DBDA employs a context metric based on the relevance of the messages, destination and speed of the vehicles. DBDA also considers the connectivity of the path and takes advantage of the group mobility through the cluster dissemination. Therefore, DBDA had outstanding performance with low vehicular density. When the vehicular density is high, most algorithms had good performance, probably because they avoid congestion. In contrast, the flooding algorithm does not have any control to prevent the scalability problem.
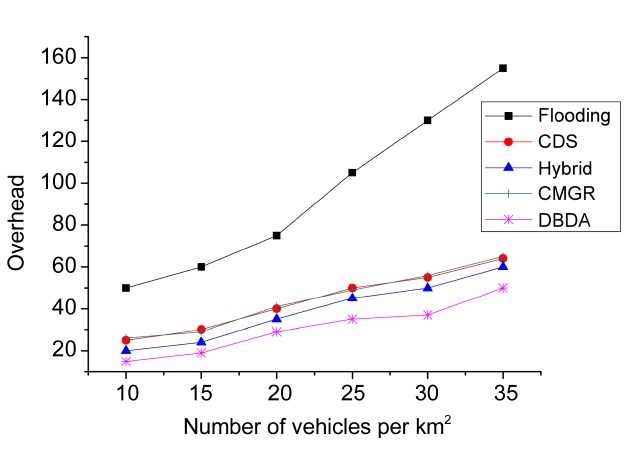
The overhead of the algorithms, in terms of the average number of retransmissions per message, is shown in Fig. 9. As can be seen in this figure, all the methods present an upward trend. This suggests that the overhead is directly proportional to the vehicular density. The DBDA had the lowest overhead for different vehicular densities (i.e., number of vehicles per km2). It is highly likely that the method of forwarding through clusters reduces the overhead. Furthermore, the publish/subscribe strategy (based on the interests of the vehicles) and the method with dynamic adjustment of the retransmission rate based on the vehicular density and the priority of the message also contribute to reduce the overhead in dense networks (e.g., 35 vehicles per km2). Hybrid publish/subscribe, CDS and CMGR had a similar trend in the overhead. However, the slight reduction in overhead regarding hybrid publish/subscribe may be caused by the distinction between the interested and non-interested vehicles.
Flooding dissemination had high overhead. Fig. 9 shows that the overhead increases sharply above a vehicular density of 20 vehicles per km2. This is because the vehicles rebroadcast the message to all the neighbors.
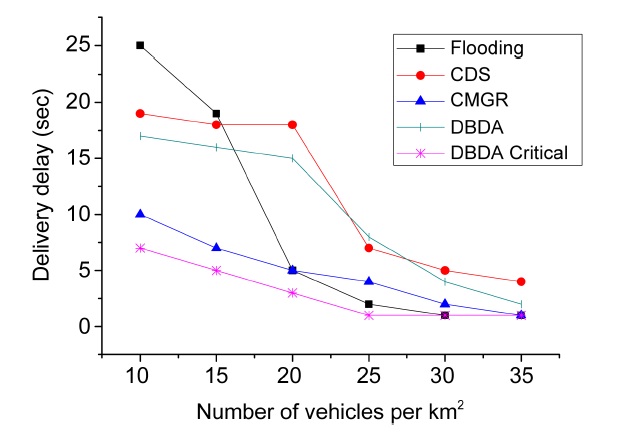
Fig. 10 displays the average delivery delay for each message according to the vehicular density of the net-
work for flooding, CDS, CMGR, DBDA and the DBDA critical method. One of the challenges of these methods is to maintain the delivery delay of the messages as low as possible. However, an overall increase in the delivery delay is inevitable since low vehicular density reduces the opportunity for message exchanges. When the number of vehicles per km2 is low (i.e., between 10 and 15 vehicles per km2 ) the delivery delay is highest. In contrast, when the number of vehicles per km2 is between 25 and 35, the delivery delay declined and remained steady.
As revealed in Fig. 10, the flooding method revealed a drastic change in the trend. It had the worst delivery delay (i.e., global maximum) at 10 km2 but also had the best delivery delay (i.e., global minimum) at 30 km2. This steep fall probably reflects a lack of store and forward technique.
In addition, the delivery delays of CDS and DBDA had similar values, performing better when the vehicular density is high. However, the fall was less steep than with the flooding method. On the other hand, CMGR had a signif
icant low delivery delay when the vehicular density was low due to infrastructures (gateways). Similarly, DBDA had the lowest delivery delay when it disseminates critical messages (i.e., DBDA critical) and the vehicular density is probably low because it takes advantage of techniques such as CafNet and the match function, which prioritize the dissemination of critical messages.
The main purpose of this study is to disseminate information in an appropriate context. This means that the data forwarding method should be able to adapt the message exchanges based on the network conditions in order to distribute the information among the neighbors. For example, data forwarding methods should based on the importance of the message, density of the road and speed of the vehicles. An appropriate data forwarding method will decrease congestion in dense networks and reduce the low delivery rate in sparse networks.
Overall, the destination-based algorithm (DBDA) provides accurate knowledge in regards to the future situation of the vehicle since the destination determines what information is of interest to the vehicle. Additionally, this algorithm leverages group mobility patterns by considering the destination of the vehicles. The assumption of a known destination is unpopular but nowadays, with advances in technology and the increased use of NS or GPS, drivers can register their destinations. The problem with this assumption is related to encouragement in regards to the willingness of users to input their destinations. In an effort to encourage users to input destination data we suggest an advertising campaign. Furthermore, some proposals include this assumption (e.g., hybrid publish/ subscribe [3]). This suggests that the known destination assumption will become popular.
In general, DBDA consists of two aspects, the clustering formation and the publish/subscribe strategy. The clustering formation leverages group mobility to improve resource consumption, load balancing and scalability problems during the exchange of messages. Notwithstanding how high mobility and rapid changes in network topology limit the performance of the clustering algorithm; this study suggests that including the destination of the vehicles will decrease the effects of high mobility and network topology changes. The simulation results reveal that the destination of the vehicles is a key factor in group mobility. Messages are delivered in a clever and efficient way. In addition, the proposed cluster formation could provide more storage capacity to store messages by exploiting the resources for all the members of the cluster. This is important because in reality, storage capacity is limited (cf. contrary to the assumption of unlimited storage capacity presented in hybrid publish/subscribe [3]).
Despite all the advantages provided by clustering algo-rithms, some approaches such as VESPA [4] argue that it is difficult for nodes to collect up-to-date neighborhood information. This suggests that the clustering approach might be less effective when neighboring nodes do not have a destination in common or if the speed difference among neighboring nodes is very different. However, in this scenario the performance of DBDA is the same as the performance of proposals which do not consider cluster formation.
On the other hand, the publish/subscribe strategy offers the prioritization of messages considering the location context of the vehicles and the content of the message. According to the simulation results, this strategy decreases the unnecessary duplication of data, congestion and high delivery delay. Furthermore, in an effort to take advantage of the available infrastructure (i.e., BS, hot spots) the information could be sent over a wired infrastructure network, which is similar to the VPN tunnel proposed in CAR [8]. However, in dense scenarios the BS or hot spots can become bottlenecks. The publish/ subscribe strategy has addressed bottleneck problems by categorizing the messages according to the relevance of each message. The relevance value of the messages determines which messages are sent through the wired infrastructure. With that in mind, critical messages (i.e., the messages with the lowest-relevance value) have priority.
It should be noted that this strategy has been primarily concerned with categorizing the messages. It would seem, therefore, that further investigations are needed in order to ensure the fairness of the relevance value regarding the messages.
The simulations of this study do not include multiple regions. Therefore, future works could include simulations over multiple regions in order to determine the best size for each region. The size of each region is important because in the selection of the paths, the Dijkstra algorithm is used, and the complexity of the Dijkstra algorithm is O(n2), where n = |V| is the total number of vertices in the graph. Thus, it is useful to have an optimum value of n to avoid high complexity in the solution of the Dijkstra algorithm.
Data dissemination in VANETs requires dynamic and intelligent decisions based on context to work in sparse and dense scenarios in order to ensure reliable communication despite rapid node mobility. We propose a DBDA to address scalability, unnecessary duplication of data and congestion problems in a dense network. DBDA also considers low delivery rate and high delivery delay in sparse networks through the dynamic selection of custodians, cluster-based forwarding and prioritization of messages based on context. The performance evaluation has demonstrated that DBDA offers outstanding performance by leveraging the destination of vehicles and using road maps to disseminate information. Even in the worst case when there are no available maps, the match function provides good performance by taking message context and mobility into account.