In this study, three pilot-scale plants with the capacity 30 m3/day were designed and set up to treat reservoir water for the production of drinking water. Three treatment processes were compared in the pilot testing: process 1 (coagulation- flocculation- sedimentation-sand filtration- ozone- BAC); process 2 (coagulation- flocculation- sedimentation- microfiltration-ozone- BAC); and process 3 (coagula-tion-flocculation- sedimentation- sand filtration- GAC). The quality of water has been evaluated on the basis of selected parameters such as turbidity, color, consumption of KMnO4, dissolved organic carbon (DOC), trihalomethane formation potential (THMFP), geos-min and 2-MIB. A detailed assessment of performance was carried out during a five months operation. Process 2 was found to have better removal efficiency of DOC, THMFP, geosmin and 2-MIB than process 1 and process 3 under identical conditions, although the removal rate of color was found to be the same in the three cases.
Drinking water is normarlly produced by removing various compounds in natural surface water. Due to the serious pollution of surface water and stricter drinking water standards, drinking water quality from the conventional treatment process may not be at a satisfactory level. Membrane technology has been con-sidered as a substitute for conventional drinking water treatment for effective retention of particulates, bacteria, and some viruses [1, 2]. In particular, microfiltration (MF) and ultrafiltration (UF) technologies are receiving more attention than the Reverse Os-mosis (RO) system due to their lower energy consumption, and their economic and easy operation [3, 4]. Ozone is one of the most effective oxidants and disinfectants for drinking water pro-duction. Moreover, it can strongly oxidize saturated and unsatu-rated bonds in organic compounds. It has many other benefits such as the removal of natural and synthetic organic compounds (i.e., taste and odor compounds, and pesticides), the avoidance of halogenated disinfection-by-products (DBPs) formation, and improved flocculation by preozonation [5].
The activated carbon adsorption process has been applied to remove DBPs. Before the granular activated carbon pro-cess, ozone was applied to oxidize refractory organic matter, which increased the biodegradability of substances. The GAC bed adsorbs small organic compounds and DBPs following the ozonization process [5, 6]. GAC has a large interfacial area that adsorbs compounds associated with chlorinated compounds (Trihalomethanes, THMs, and Haloacetic Acids, HAAs ), pheno-lic compounds, dyes, toxic metals and substances which cause biological after growth [7].
The Cheon-Sang water treatment plant (Ulsan, Korea) is the supplier of drinking water for the Ulsan area, of which the population is over 1 million. The raw water of the Cheon-Sang water treatment plant is drawn from a nearby reservoir. The wa-ter is polluted due to the discharge of agricultural and industrial wastewater in the intake area of the reservoir, which is currently in the eutrophication process. Currently, the Cheong-San water treatment plant employed conventional treatment processes, in-cluding prechlorination, coagulation, sedimentation, rapid sand filtration, and disinfection. The conventional treatment process-es could not completely remove the contaminants concerned. In order to search suitable treatment processes to upgrade the exiting facilities, a pilot plant was built in the Cheon-Sang water treatment plant. The performance of these treatment processes were compared on the basis of seletcted parameters such as tur-bidity, alkalinity, color, consumption of KMnO4, dissolved organ-ic carbon (DOC), trihalomethane formation potential (THMFP), geosmine, and MIB.
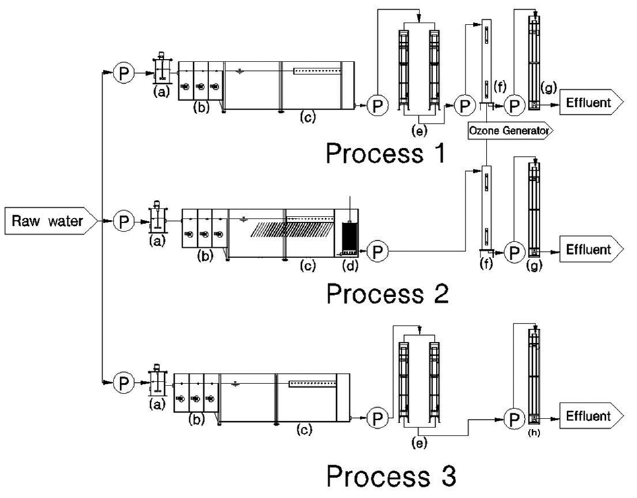
The pilot scale plant was set up at the Cheon-Sang water treat-ment plant. Three treatment processes were operated in this test and the performance assessment of the pilot plant was carried out over the five months. Fig. 1 shows the schematic diagram of the pilot plant used in this study. The raw water used in this treat-ment was taken from a nearby reservoir, and was divided into three processes: coagulation- flocculation- sedimentation- sand filtration- ozone- BAC (process 1); coagulation- flocculation-sedimentation-membrane filtration-ozone- BAC (process 2); and coagulation- flocculation- sedimentation- sand filtration-GAC (process 3). The flow rate of the influent for each process was 30 m3/day. Polyaluminum chloride (PACl) was diluted by 20 times and was used as a coagulant, and the feed flow rate was 2.5 mL/min. Flocculation was performed with a volume and de-tention time of 0.76 m3 and 36.41 min, respectively. The depth of the gravel layer was 300 mm, and that of the sand (effective size of 0.45-0.7 mm) layer was 1,100 mm in the sand filter bed of processes 1 and 3. Backwashing of the sand filter was carried out every other day and GAC column backwashing was also per-formed twice a week. The MF membrane used in process 2 was produced by KOLON, Korea, with a membrane surface area of 20 m2, and a pore size of 0.1 μm (Cleanfil-S20HP). The membrane was operated at the feed flow rate of 20.83 L/min, a permeate flow rate of 18.75 L/min, and a trans-membrane pressure of 0.03 MPa. Backwashing and chemical cleaning of MF was carried out regularly for preventing fouling. The GAC column of each pro-cess was filled to a 2,500 mm height (Shin Ki Chemicals, Yangsan, Korea ) with an empty bed contact time (EBCT) of 4.3 min.
The ozone generator (WEDECO Series GSO/SWO 2088; Xy-lem Water Solution, Herford, Germany) was operated with a flow rate of 0.5-3 mg/L. The flow rate of raw water was 20.83 L/min. Thus, the entire capacity of the pilot plant was about 90m3/day.
Raw water and permeate samples from each process were collected every week. Samples were taken simultaneously from all the processes. pH and temperature were measured using a pH meter (Horiba D51; Horiba Ltd., Kyoto, Japan). Turbidity was measured using a portable analyzer (Hach 2001AN; Hach, Loveland, CO, USA). These parameters were measured at the sampling sites. Samples including a raw water sample were car-ried to the laboratory, pre-filtered with a 0.45 μm filter to remove particles, and stored in a refrigerator at 4℃ for the analysis. The alkalinity, color, and KMnO4 were measured according to the standard methods [8].
DOC concentrations were analyzed by the Non-purgeable Organic Carbon (NPOC ) method using a Total Organic Carbon (TOC) analyzer (Sievers 5310C; General Electric Co., Boulder, CO, USA). UV254 absorbance was measured with a Shimadzu UV-1240 ultraviolet-visible (UV/VIS) spectrophotometer (Shi-madzu, Tokyo, Japan). Mn was measured using Inductive Cou-pled Plasma-Mass Spectrometry (ICP-MS 7500; Agilent, Santa Clara, CA, USA).
Concentrations of THMs were analyzed using a head space method using a gas chromatograph (6890N, Agilent) coupled with a micro-electron capture detector (ECD). The make-up gas used was high purity nitrogen, and the specification of the capil-lary column was 30.0 m × 0.53 mm I.D. × 3.0 m (DB-1, Agilent). In the THMFP measured process, NaClO (Hanwha, Seoul, Ko-rea) was used as the disinfection agent. Calibration curves were constructed prior to the analysis of THMs with different diluted standard solutions of CHCl3, CHCl2Br, CHClBr2, and CHBr3. MIB and geosmin analyses were conducted using solid phase micro-extraction and gas chromatography-mass spectrometry [8].
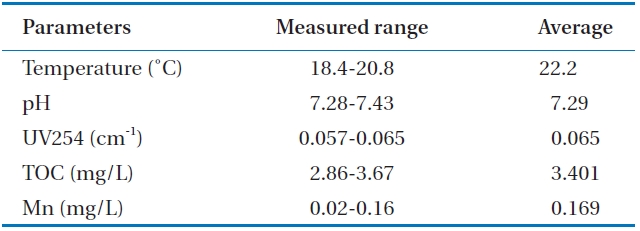
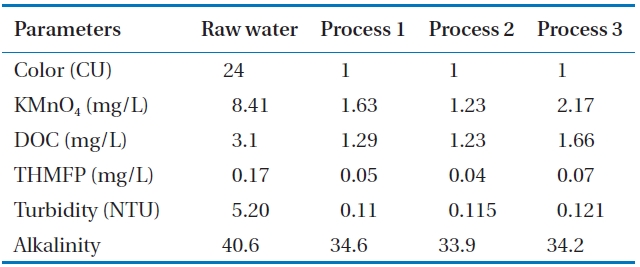
Table 1 shows the raw water quality characteristics in this study. Raw water was taken from a nearby lake. A relatively fair water quality was maintained because there are not many pol-lution sources in the uptake area of the lake. The temperature was moderate during the experiment. TOC levels were within an average range over the year.
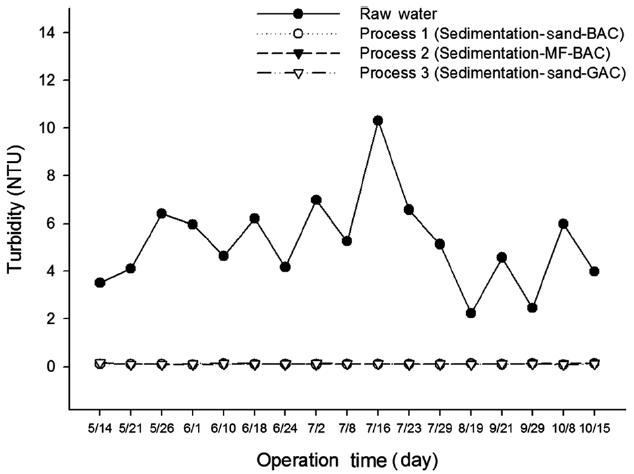
Fig. 2 shows the turbidity concentrations of the raw water and finished water from various processes. The average value of turbidity is presented in Table 2. Finished water from pro-cess 1 achieved the lowest average turbidity (0.11 NTU) as well as the least measurement variation. Process 2 treated water had a slightly higher turbidity (0.115 NTU) than that of process 1. The average turbidity of process 3 was 0.12 NTU, and its mea-surement variations became larger at the same time. Due to enhancement of coagulation performance by ozone oxidation,
[Table 1.] Characteristics of raw water quality

Characteristics of raw water quality
process 1 and process 2 showed somewhat higher removal rates of turbidity than those of process 3. Even though turbidity re-moval efficiency was shown to be the best in process 1, the dif-ferences between the processes are within measurement error.
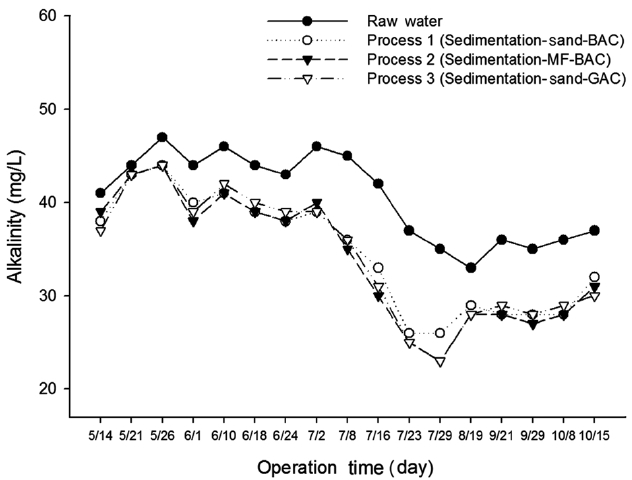
The average alkalinity of the water from various treatment processes is shown in Table 2 and its measured concentration is shown in Fig. 3. The alkalinity of treated water from process 2 was 33.9 mg/L, whereas the alkalinity in process 3 was slightly higher than that from process 2. The alkalinity of the treated water of process 1 was 34.6 mg/L on average. Alkalinity was sufficiently maintained to keep the pH within the range of good coagulation in all processes.
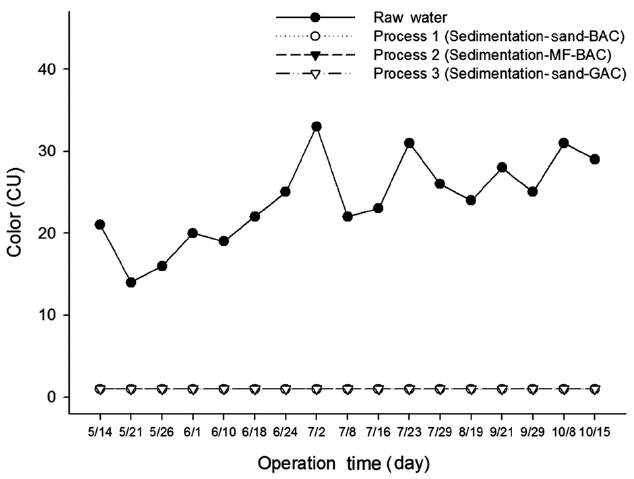
Natural color is classified as a secondary contaminant of po-table water, although there is no record that the color of water is harmful to human health [9]. However, the problem with color is the loss of public confidence in the quality of potable water. The recommended limit of natural color in drinking water is 1 [10].
Fig. 4 shows the measured value of color according to the three treatment processes. It can be seen from the figure that the color of raw water ranged from 21 to 29 CU with an average value of 24 CU. Color was 1 CU with a removal efficiency of 98% after the treatment of process 1, process 2, and process 3. Natural color of the lake water may be sufficiently removed to gain the drinking water quality standard by coagulation and flocculation, sedimentation, and sand filtration or microfiltration even with-out ozonation.
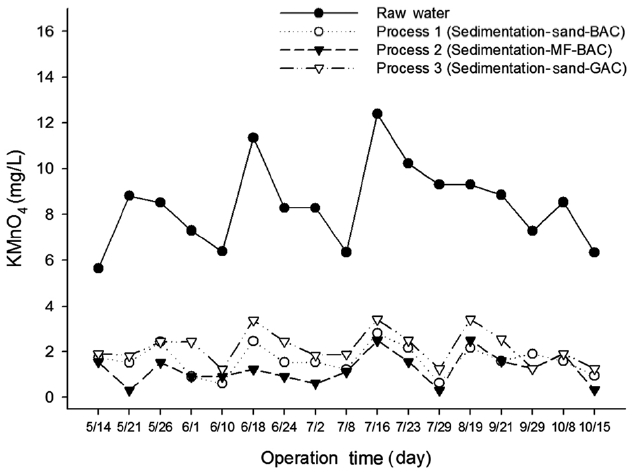
The presence of oxidizable organics or inorganics in water reduces disinfection effectiveness. As a surrogate parameter, permanganate is measured because permanganate will be con-sumed in the oxidation of organics and inorganics. Permanga-nate oxidizes a wide variety of inorganic and organic substances in the pH range of 4 to 9. Under typical water conditions, iron and manganese are oxidized and precipitated, and most con-taminants that cause odors and tastes, such as phenols and algal organic matter, are readily degraded by permanganate [9]. In this study, KMnO4 was used as an oxidant to check the consumption rate for removal of these materials. Fig. 5 shows the consumption rate of KMnO4. Consumption of KMnO4 in processes 1, 2, and 3 was 1.63, 1.23, and 2.17 mg/L, respectively (Table 2). The lowest value in process 2 indicates that a lower amount of KMnO4 was required for oxidation of organic and inorganic materials pres-ent in water. Process 1 and process 2 showed higher KMnO4 re-moval rates than process 3 because process 1 and process 2 used
[Table 2.] Average water qualities of raw water and finished water from various processes
Average water qualities of raw water and finished water from various processes
ozonation while process 3 did not, which indicates that ozone reduced the KMnO4 consumption potential in treated water.
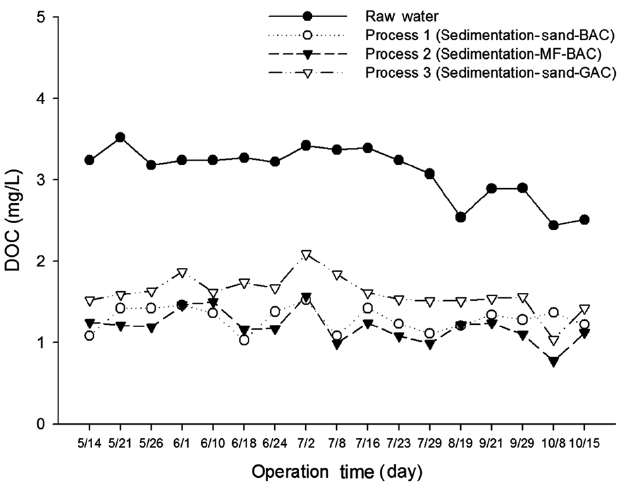
DOC is commonly used as a parameter for the formation potential of DBPs, as some organic compounds in natural wa-ters form DBPs. The DOC variation of the raw water and treated water from three treatment processes are shown in Fig. 6. The DOC values of raw water ranged from 2.51 to 3.24 mg/L, with an average of 3.1 mg/L. The average value of DOC for treated water for processes 1, 2, and 3 was 1.29, 1.23, and 1.66 mg/L, respec-tively (Table 2). It was observed that up to 61% reduction of DOC was found for treatment process 2, followed by treatment pro-cess 1 with a removal efficiency of 58%. Process 3 had the lowest removal rate of DOC (47%). This may be attributed to the fact that the incorporation of microfiltration with GAC in process 2 retains higher molecular weight organic compounds from water than in the sand filtration of process 1. The removal efficiency was low due to the absence of the ozonation process in process 3. The results demonstrate that ozone oxidizes DOC material in water. Also, the straining effect of the DOC material of process 2 is higher in the membrane than in the sand bed.
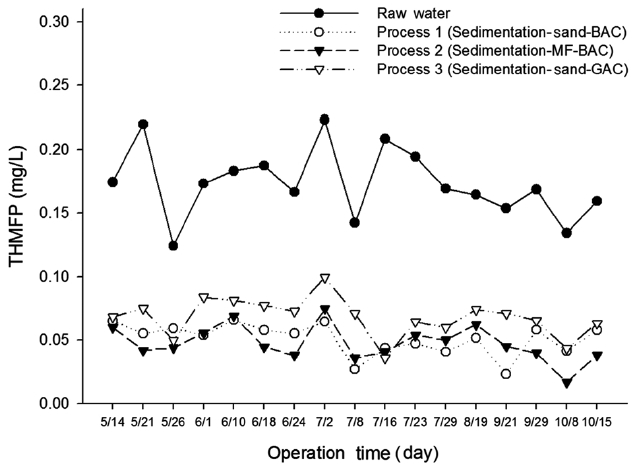
The possible production of THM by Dissolved Organic Mat-ter (DOM ) with chlorine was assessed in terms of THMFP. Fig. 7 shows the measurement variation of the THMFP obtained from treated waters and raw water from processes 1, 2, and 3. The THMFP of raw water ranged from 0.13 to 0.17 mg/L, with an average value of 0.17 mg/L. It can be seen from Table 2 that the THMFP was lowered to 0.05 mg/L (70%) after treatment in pro-cess 1, whereas in processes 2 and 3 it was reduced to 0.04 mg/L (77%) and 0.07 mg/L (59%), respectively. The low THMFP value implies a high THM precursor’s removal efficiency in process 2. Process 2, in which the membrane was incorporated, showed higher removal efficiency than any other treatment process. This implies that using a membrane system with GAC would reduce the humic contents in the filtrates, resulting in mitigation of the formation of DBPs in final chlorination. The removal efficiency of THMFP showed a similar pattern to that of DOC. It may be assumed that the ozone removed the THM precursors to some extent.
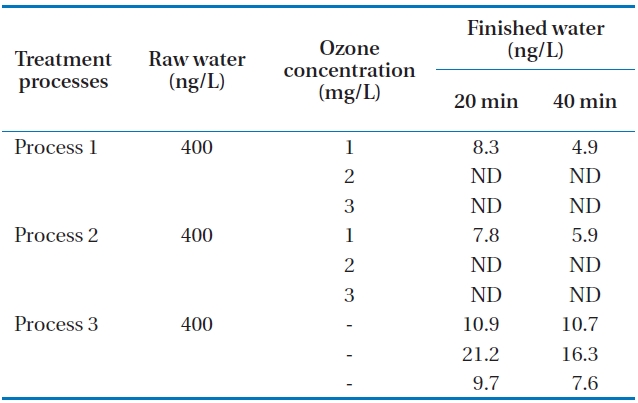
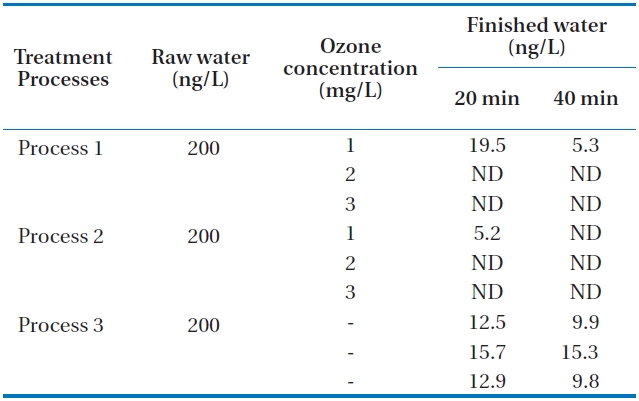
Tastes and odors of drinking water have long been of concern as they account for many consumer complaints. MIB (2-methyl-isoborneol) and geosmin (trans-1, 10-dimethyl-trans-9-decalol) are two of the most common tastes and odors. Both compounds are volatile saturated tertiary alcohols and impart an earthy/musty odor that can be detected at extremely low concentra-tions of between 10 and 20 ng/L [6, 11]. Neither MIB nor geos-min is readily removed by conventional water treatment, thus advanced treatment processes such as ozonation and activated carbon are required. Additional processes incorporating oxida-tion or adsorption are generally required to remove these dis-solved organics including geosmin and MIB. Activated carbon has been shown to be an effective adsorbent for the removal of MIB and geosmin [12]. In this study, the raw water was spiked with 400 ng/L of geosmin and 200 ng/L of MIB for one hour. The movement of spiked water body through the units of the pilot plant was carefully calculated. Then, samples of each process were taken during the middle part of the passing period of spiked water body to minimize experimental error. The concentrations of the two samples are the limits which occur in early summer at the reservoir. Samples were taken in the finished water (GAC ef-fluent) of the three processes at 20 and 40 minutes after the total retention period of each process. The total hydraulic retention time periods of the three processes are about 7 hours, 5 hours and 55 minutes, and 6 hours, respectively. The measured con-centrations in finished waters from each process are presented in Tables 3 and 4. It can be seen from the table that as the ozone concentration increases, the concentrations of the two materi-als were not detected at higher ozone concentrations of 2 and 3 mg/L for processes 1 and 2. It was observed under the com-parable condition that the removals of geosmin and MIB were higher in process 2 than in processes 1 and 3. This may be due to the incorporation of membrane filtration in process 2. The extremely low value of these compounds in processes 1 and 2 indicates that the incorporation of ozonation and activated car-bon could enhance the removal of these compounds. Process 3 without ozone application could not remove geosmin and MIB in the final finished water. It was also revealed that over 2 mg/L of ozone application with GAC could remove geosmin and MIB by about 100% even when they occur in the upper limits of con-centrations of the two materials.

Concentrations of geosmin in various processes at 20 and 40 minutes after the total retention periods

Concentrations of MIB in processes 1 2 and 3 at 20 and 40 min after the total retention periods
Investigations have been performed to compare removal effi-ciencies on the basis of water quality parameters such as turbid-ity, alkalinity, color, KMnO4 consumption, DOC, THMFP, geos-min, and MIB in three different treatment processes. The highest removal efficiency of DOC, THMFP, geosmin, and MIB and lower consumption rate of KMnO4 was obtained in the coagulation-flocculation-sedimentation-microfiltration-ozone-BAC process (process 1) than in the coagulation-flocculation-sedimentation-sand filtration-ozone-BAC process (process 2) and in the coag-ulation-flocculation-sedimentation-sand filtration-GAC process (process 3) . Process 1 showed a slightly higher reduction rate in turbidity when compared with that in processes 2 and 3. The removal efficiency of color was similar in the three applied treat-ment processes. Ozone might oxidize and break down the or-ganic matter which was then removed more successfully by the microbial community in GAC. Thus, the removal rates of DOC and THMFP were higher in the ozonated treatment processes. The incorporation of microfiltration in process 2 was found to have higher removal efficiencies in most of the water quality pa-rameters.