The production of solid waste increases with an increase in the standard of living. The increase of food waste has resulted in serious environmental pollution problems. Food waste typically has a bulk density and water content of 1.0 ton/m3 and 80-85%, respectively, and is composed of biodegradable organic waste. Food waste easily decays, which produces a bad smell and leachate when collected and transported. Because of the high salinity (about 3%) of food waste, it cannot be easily composted. In the case of landfills, the leachate in food waste results in environmental pollution, such as undergroundwater pollution, and must be treated leachate, which incurs a treatment cost.
The most widely used resource recovery methods of food waste are composing and forage crops. Every year, organic leachate increases due to the flush and dewatering process used to remove salt in the resource recovery process. 50% of the food waste leachate created through treatment is discharged to the ocean discharge or placed in a land disposal in Korea. Because of its very cheap cost, discharge to the ocean has increased every year. Food leachate only needs to be connected to a wastewater treatment plant or food leachate treatment plant, but was treated using a public plant is burdensome since this type of discharge is monitored. In public and private treatment plants, the portion of ocean discharge portion for total food waste is 22% and 81%, respectively. Ocean discharge of food waste, food leachate, livestock manure, sludge of wastewater, etc will be prohibited in Korea by the London Dumping Convention and the international convention for marine pollution prevention. Thus, there is an urgent need to develop alternative methods of dealing with leachate food waste [1].
The ministry of environment is currently preoccupied with the problems associated with ocean discharge. In addition, resource recovery plans to deal with organic resources that had been dumped in ocean are currently being developed in energy policies. In addition, research on biogas production from anaerobic digestion of organic resource is being developed as an energy policy.
This study was carried out to examine the performance of new digestion system (NDS) and to determine the optimum hydraulic retention time (HRT), treatment efficiency rate, and biogas production of the NDS.
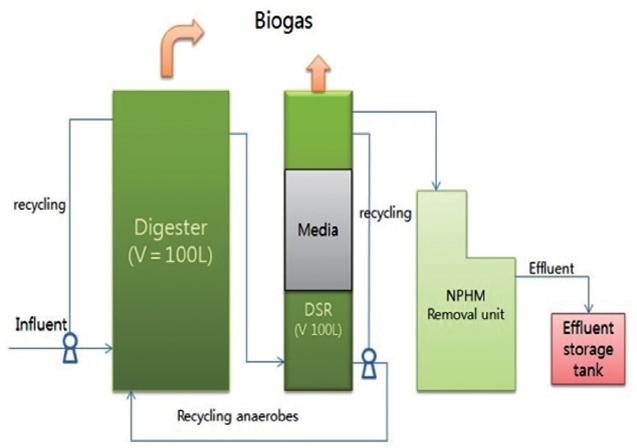
Fig. 1 shows the configuration of the NDS, which consists of an anaerobic reactor, a digested sludge reduction (DSR) unit, and nitrogen, phosphorus, and heavy metals (NPHM) removal unit connected in series. The anaerobic reactor recovers biogas from the biological conversion of organic substrates following hydrolysis, fermentation, and methanogenesis steps. The anaerobic reactor used was made of stainless steel and was 0.3 m in diameter and 1.70 m in height, and the effective volume of the reactor was 100 L. The reactor was automatically controlled using a thermostat for thermal digestion, in which the temperature was maintained at 36℃.
DSR is a technology that improves specific gravity of currently unsettleable suspended solids (SS) in the effluent of an anaerobic reactor by conglomerating anaerobes to SS. The specific gravity ?improved SS/anaerobe-conglomerate settled in the DSR as a thickened sludge, which can then be pumped back (recycled) to the digester for addition hydrolysis and biodegradation. Thus, using the DSR the amount of anaerobes (2.1-3.3%, total solids [TS]) can be increased, so that hydrolysis of SS can be activated to produce more biogas and remove almost all organics. The DSR was 0.28 m in diameter and 1.50 m in height, and the effective volume of the reactor was 100 L. The reactor was made of polyvinyl chloride and was not equipped with a temperature controlling unit. The reactor was partly filled with cross-flow media with a specific surface area of 102 m2/m3. The effluent line was located 1.30 m from the bottom of the reactor. The effective volume of the reactor was 80 L.
In the NPHM unit, when the DSR effluent fell free, the pH increased due to the rapid degasfication of CO2. Thus, ammonium ions were removed by ammonia stripping, and phosphate-phosphorus was removed by forming a struvite at high pH. In the lab, the NPHM unit was 1.0 m in height; however, in the field, the unit should be over 7 m in height to improve the efficiency rate. The effluent was allowed to fall freely through a staging flower pots, filled with media. This allowed the struvite to extend to the HRT. The media used in the NPHM unit was 2.5 cm in length, 1.5 cm in diameter with a plastic tube type. Biogas produced from the anaerobic reactor and DSR unit was collected. After collecting biogas from air balloons that were 1.5 m in diameter, the gas was measured using a gas flow meter. The mixing and returning pumps, which were 0.5 hp mono flux type pumps, were used in the system.
2.2. Reactor Operation and Experimental Method
Food waste leachate was acquired from Daejeon City’s KunKodong food waste forage factory. The average chemical oxygen demand (CODcr)/L, biological oxygen demand (BOD)/L, TS/L, volatile solids (VS)/L, total nitrogen (TN)/L, total phosphorus (TP)/L, and NaCl/L values of the leachate were 124,525 mg, 80,952 mg, 113,381 mg, 94,166 mg, 2,118 mg, 236 mg, and 4,130 mg, respectively, and the variation in raw leachate was quite wide [2]. The concentration of these components in leachate have been shown to vary and depend on the resource recovery facilities [3].
Seeding microbes of reactors collected from an anaerobic digester at Daejeon City’s wastewater treatment plant were used in the anaerobic reactor and DSR unit. The seeding was mixed and circulated after three days without leachate feeding. In the beginning of the operation period, the feeding was increasing from 0.5 L per day to 3.3 L per day and the biogas production was maintained a constant gas flow. The effluent of each reactor was sampled and analyzed. The food waste leachate was fed intermittently to an anaerobic reactor in increasing steps of
3.3 L/day, 5 L/day, and finally 10 L/day, which corresponded to an organic loading rate of 4, 6, and 14.2 kg COD/m3/day, respectively.
The methane portion was analyzed using thermal conductivity detector (TCD) on a gas chromatography (shimadzu GC-14A; Chabrian Technical, Tampa, FL, USA). Using a microsyringe from a gas bag, 1 mL sample of gas and 0.2 mL feed sample size were picked up. A standard gas of CH4 80%, CO2 20% manufactured by Korea Research Institute of standard and science was used. Produced biogas was calculated at a standard condition (0℃, 1 atm standard temperature and pressure [STP]) and pH was measured using pH meter. NH3-N was analyzed using spectrophotometer (DR 2700; HACH, Loveland, CO, USA). COD, TS, and VS were measured using standard methods [4] and alkalinity, BOD, TN, and TP were measured using Korean standard methods [5].
3.1. Variation of pH and Alkalinity
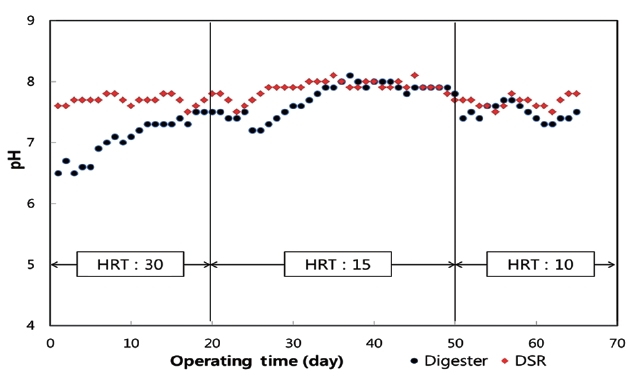
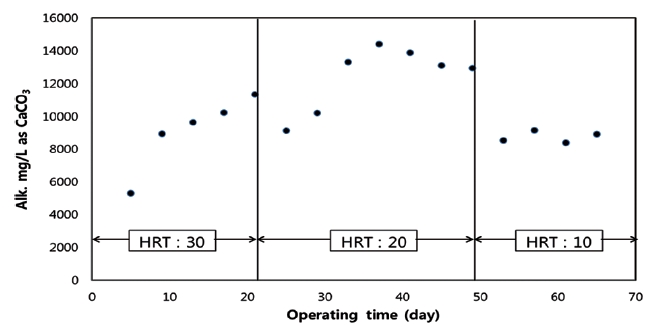
Fig. 2 shows the variation of pH by HRT. The pH of the influent was about 4.4. The pH only varied from 7.1 to 8.0 during the operation time, but there was a difference in pH at the beginning of the operating time. The pH was within the optimal range during the operation, which was 6.8-7.4, at methane production. Fig. 3 shows the variation in alkalinity at the anaerobic digester. At 30 days HRT, the pH was between 7.1 and 7.5, but was 6.5 at the beginning of the operation, and alkalinity ranged from 8,940 to 9,640 mg/L. The pH was low at the beginning because of the acid forming microbes that were present after the temperature sensitive methane forming microbe were no longer present when the internal temperature was raised to 70℃. At that temperature, the operating pump broke.
At 20 days HRT, the pH increased from 7.5 to 8.1 with operation time, and the alkalinity increased from 13,330 to 14,400 mg/L. At 10 days HRT, the pH decreased from 7.4 to 7.6 because the organic loading rate was high. The pH was maintained over 6.8, which inhibited the activity of methane forming microbes.
However, methane forming microbes were active because of the accumulation of volatile fatty acid caused by acid forming microbes, and the production rate of acid forming microbes was faster than methane forming microbes when the organic loading rate was suddenly increased. The alkalinity was ranged from 8,380 to 8,920 mg/L, which was believed to be decrease by the volatile fatty acid, but was not affected during reactor operation. In this study, the alkalinity ranged from 8,940 to 14,400 mg/L, which was high compared with 1,000 to 5,000 mg/L at the general anaerobic digester. The alkalinity depended on the characteristics of the wastewater. In a previous study [6, 7], alkalinity was maintained between 7,468 mg/L and 9,300-9,900 mg/L, but there were issues with operation.
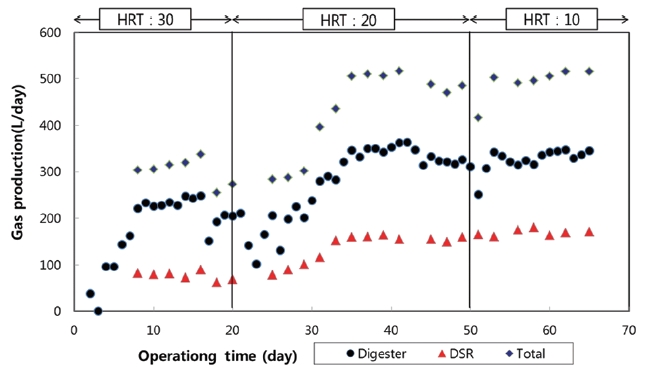
The variation in biogas production depended on the different HRT, as shown in Fig. 4. At 30 days HRT, biogas was constantly produced after the microbes were activated for 10 days during the operation period. Flow of biogas ranged from 300 to 337 L/ day (average, 316 L/day), and the methane content ratio was about 75.7%. At the 20 days HRT, the flow of biogas ranged from 505 to 517 L/day (average, 510 L/day), and the methane content ratio was about 70.5%. At 10 days HRT, the flow of biogas ranged from 491-516 L/day, which was similar to the flow observed for 20 days HRT, and the methane content ratio was about 68.1%.
The methane content ratio decreased slightly as HRT decreased, organic loading rate increased, and biogas production increased, while the influent flow increased. But at 10 days HRT, biogas production was did not significantly increase because the digestion efficiency rate was low due to a high organic loading and the toxicity of the increasing NH3-N concentration.
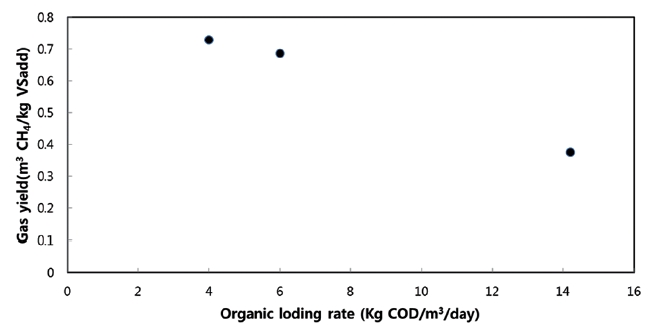
Fig. 5 shows the gas yield as a function of the organic loading rate. The removed biogas production of food waste leachate was 0.38-0.73 m3 CH4/kg VS added, which was higher than 0.2-0.6 m3 CH4/kg VS removed from sewage sludge [8]. At 30 days and 20 days HRT, the gas yield was 0.729 and 0.686 m3 CH4/kg VS added (0.6 m3 CH4/kg COD removed), respectively, but was 0.375 at
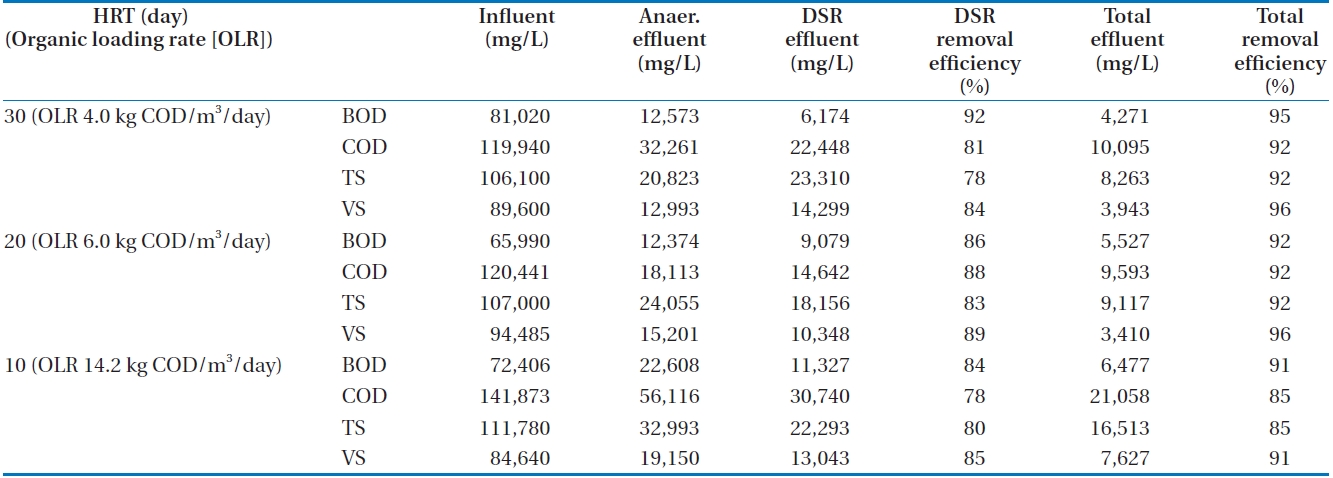
[Table 1.] Food waste leachate treatment and biogas production in each region
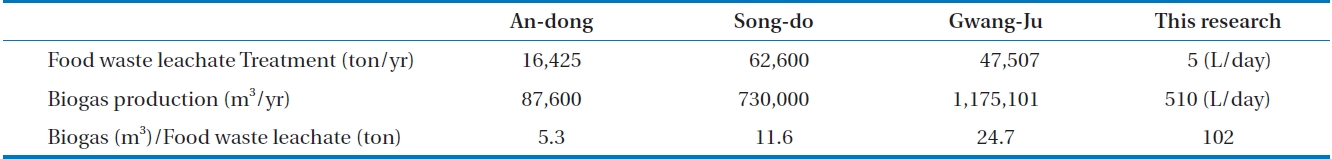
Food waste leachate treatment and biogas production in each region
10 days HRT, which was similar to the values observed for the sewage sludge. In the digester at 20 days HRT, 102,328 mg COD/L was removed to produce 350 L/day (70% of total) of biogas and in the DSR, only 3,471 mg COD/L was removed, which produced 158 L/day of biogas. Biogas production in this study was higher than others study, which only contained 0.289 [9] and 0.24 m3 CH4/kg VS added [10].
Table 1 shows the biogas production in the domestic region relative to this study. Biogas production in this study, which was reported as m3 biogas per m3 food waste leachate, was 102. This was 4.1 times higher than the food waste resource recovery facility. It was previously reported that a highly anaerobic efficiency reactor produced 65 m3/m3 food waste leachate at 23 days HRT [11]. Thus, the rates achieved in this study were 1.5 times higher than previously published values.

The variation and organic matter removal efficiency rate by hydraulic retention time (HRT)
Table 2 shows the variation and organic matter removal efficiency rates by HRT under stable conditions (BOD, COD, TS, and VS).
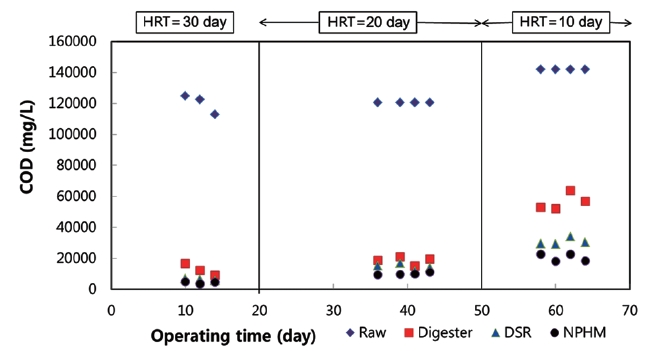
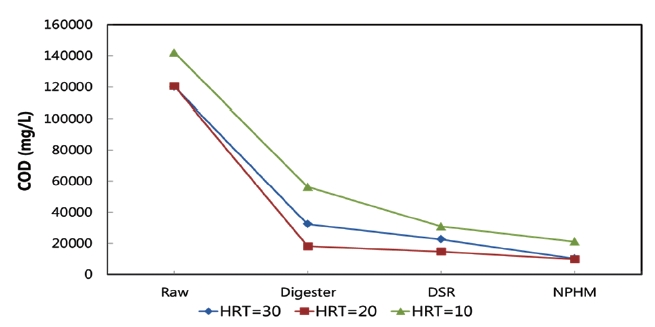
In the case of COD, the average concentration of waste food leachate was 127,418 mg/L (119,940-141,873 mg/L). Fig. 6 shows the variation in COD in operation time by HRT. Fig. 7 shows the variation in COD concentration at unit process by HRT. The removal efficiency rate decreased when the HRT decreased. The organic loading rate also decreased. Effluent from the anaerobic digester and DSR digester depended on the HRT (30, 20, and 10 days) and the average removal efficiency rate was 22,448 mg/L for 81%, 14,642 mg/L for 88%, and 30,740 mg/L for 78%, respectively. The final effluent from the NPHM was 10,095 mg/L for 92%, 9,593 mg/L for 92%, and 21,058 mg/L for 85%. The COD removal efficiency rate was slightly higher at 20 days HRT than 30 days HRT. Another study reported COD removal efficiencies of 73-75% at an organic loading rate of 4.6-5.4 kg COD/m3/day by using combined food waste and landfill leachates [12].
Table 3 shows the nutrient removal efficiency rate by HRT using TN, NH3-N, TP for the target nutrient analysis.
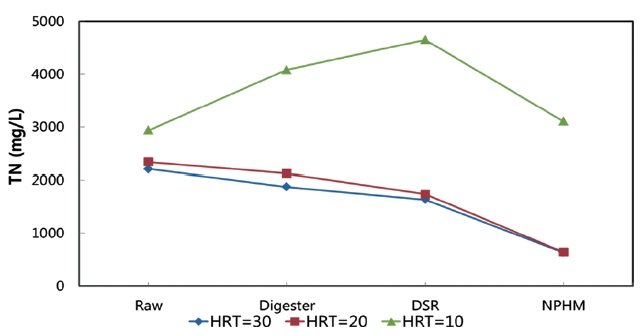
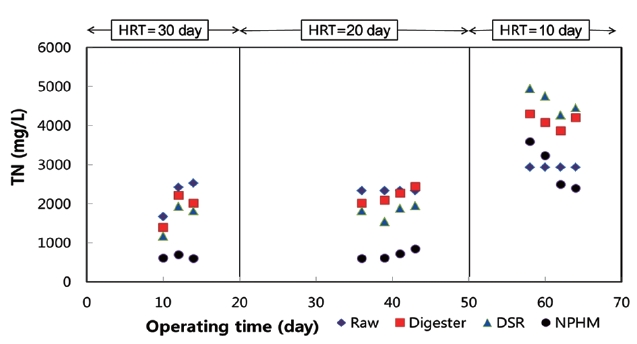
Figs. 8 and 9 show the variation of TN concentration according to the operation time by HRT and at unit process by HRT, respectively. The TN and NH3-N concentration in the waste food leachate were 2,492 mg/L and 751 mg/L, respectively, and the ratio of NH3-N per TN was about 30%.
At 30 days HRT, the effluent of DSR contained 1,638 mg/L TN and 1,247 mg/L NH3-N, which meant that the TN concentration decreased by 26% and the NH3-N concentration increased. The final effluent was 634 mg/L TN and 395 mgL NH3-N, and the removal efficiency rate of each was 71% and 49%, respectively.
At 20 days HRT, the effluent of DSR contained 1,743 mgL TN and 1,427 mgL NH3-N, which demonstrated that 25% of the TN was removed, which was similar to the value observed at HRT 30 days; however the NH3-N concentration increased. The final effluent was 641 mgL TN, corresponding to a 73% removal efficiency rate, which was slightly higher than the rate observed at 30 days HRT. The NH3-N content was 478 mgL, corresponding to a 28% removal efficiency rate, which was lower than the rate observed 30 days HRT. At 10 days HRT, the effluent of DSR contained 4,652 mg/L TN and 3,990 mgL NH3-N, which was very high was and may explain why the TN loading of the waste food leachate increased. The final effluent consisted of 3,103 mg/L TN and 2,527 mg/L NH3-N, which corresponded to a relative small removal efficiency rate.
NH3-N was hardly removed after the anaerobic process, but rather continued to accumulate. At 10 days HRT, NH3-N levels were 5 times higher than in the raw leachate. In the case of 30
[Table 3.] Variation of nutrient concentration by hydraulic retention tim (HRT)
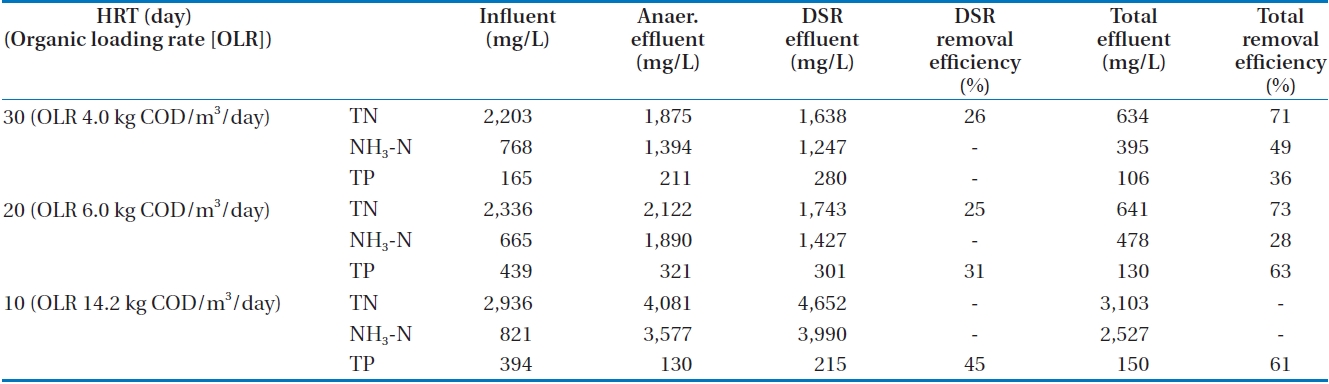
Variation of nutrient concentration by hydraulic retention tim (HRT)
days and 20 days HRT, the removal efficiency rate of the NPHM is were 49% and 28%, respectively. But at 10 days HRT, it was 3 times as high.
Thus, NH3-N had accumulated during the anaerobic process. After going through NPHM, the removal efficiency rate decreased. The height of the NPHM was lower than 1 m, which cannot cause an increase in pH and ammonia-stripping. If the height of the NPHM was higher than 3 m, the NH3-N removal efficiency rate would have been much higher.
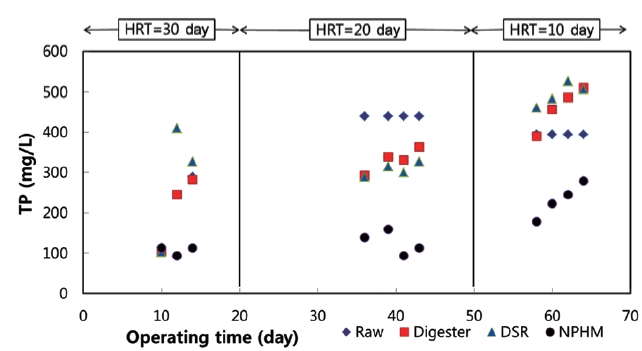
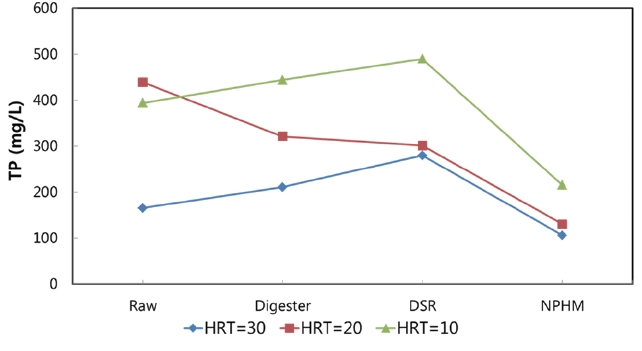
Figs. 10 and 11 show the variation of TP concentration according to operation time by HRT, and at unit process by HRT,
respectively. The average TP of waste food leachate was 236 mg/L (165-439 mg/L). However, during the anaerobic digestion process, the TP concentration increased
At 30 days HRT, the average TP concentration of the influent was 165 mg/L; however, after the anaerobic digestion process the average concentration of the effluent increased to 280 mg/L. Furthermore, the concentration of the final effluent was 106 mg/L, which indicates a 36% removal efficiency rate. At 20 days HRT, the concentration of the effluent treated by the anaerobic digestion process was 301 mg/L and 31% was removed. Consequently, the average concentration of the effluent from NPHM was 130 mg/L and 63% was removed. At 10 days HRT, the average TP concentration of the influent was 394 mg/L, and the effluent of anaerobic digestion contained 215 mg/L, which corresponds to 45% removal of TP. The concentration of the final effluent was 150 mg/L, which means the removal efficiency rate was 61%. The reason for the still-low-removal efficiency in this experiment was that the NPHM was too low. If the height of the NPHM was higher, some struvite salt would be created and the TP removal efficiency would increase. Another study also reported a low TN removal efficiency rate, but the TP removal efficiency rate was 81%, which was higher than in this study [11].
The removal efficiency of organic matter based on COD during anaerobic process was 79-88% and 4-10% in NPHM. The total removed ranged from 86-92%. This suggests that almost all of the organic matter could be removed during the anaerobic process. And based on COD, to maintain a removal efficiency rate of over 90%, the organic loading rate must be kept below 10 kg COD/m3/day. The HRT would depend on the influent HRT, which was recommended for 12-15 days. At 20 days HRT, which had the best efficiency rate, the TN removal efficiency rate was 25% during the anaerobic process and 48% in NPHM. The TP removal efficiency rate was 31% during the anaerobic process and 32% in NPHM. Total removal of TN was 73% and total removal of TP was 63%. When the organic loading rate was increased, the biogas production slightly decreased. The biogas produced at 20 days HRT, which corresponded to a gas yield of about 0.686 m3 CH4/kg VS added (0.6 m3 CH4/kg COD removed) and methane content ratio of 70.5%, was 102 m3 biogas per 1 m3 waste food leachate.