In the last few decades, population exposure to volatile organic compounds (VOCs) has become a great concern because of the prevalence of these species in various microenvironments, their detrimental health effects, and their role in atmospheric chemistry. Urban atmospheric VOCs result mainly from human activities such as the exhaust from motor vehicles and other combustion processes utilizing fossil fuels, petroleum storage and distribution, painting, solvent usage, and other industrial processes [1-3]. Several researchers have reported that these compounds are generally detected at higher concentration levels in urbanized cities than in rural areas [4, 5]. Many VOCs are toxic or potentially toxic to humans [6], and atmospheric VOCs act as precursors for the formation of secondary air pollutants such as ozone, aldehydes, and organic aerosols [7-9]. Furthermore, atmospheric VOCs, along with other pollutants, can penetrate indoors, thereby influencing the indoor concentration levels and elevating health risks of urban populations [10]. These characteristics of VOCs have led to the development of control measures for the reduction of atmospheric VOCs.
The establishment of effective control strategies for atmospheric VOCs requires the identification of characteristics of ambient VOCs in the target areas. A single strategy established in a city cannot always be applied to other cities, since the profile of ambient concentrations are different from one city (or country) to another due to various factors such as emission type and strength and meteorological conditions [11, 12]. Thus, the application of different control methods for different land-use types would be effective. It is noteworthy that the production of metals is one of the principal human activities emitting VOCs [13-16]. For example, the production of steel and iron utilizes a series of inter-linked processes such as ballast furnaces, coke ovens, sintering, oxygen steelmaking, casting, and rolling, which are closely associated with the emissions of VOCs and other air pollutants. The city of Pohang has an iron and steel industrial complex (ISIC) that includes the Pohang Iron and Steel Co., Ltd. (POSCO), which is one of the most competitive steel companies in the world today. As such, it is hypothesized that the Pohang area may represent different characteristics in ambient VOC concentrations compared to residential or residential/commercial areas of other cities. Nevertheless, this hypothesis has never been investigated.
The present study was performed mainly to examine this hypothesis by evaluating the characteristics of ambient VOCs in Pohang, a Korean city with a strong metal industrial presence, using
long-term monitoring data. For comparisons, the VOC characteristics for a residential (RES) and a commercial/residential combined (CRC) area in the metropolitan city of Daegu were also investigated. The selected target VOCs are all classified as hazardous air pollutants [6], and they included 13 species: benzene, 1,3-butadiene, carbon tetrachloride, chloroform, 1,1-dichloroethane, ethyl benzene, methyl chloroform, perchloroethylene, styrene, toluene, trichloroethylene, o-xylene, and m,p-xylene.
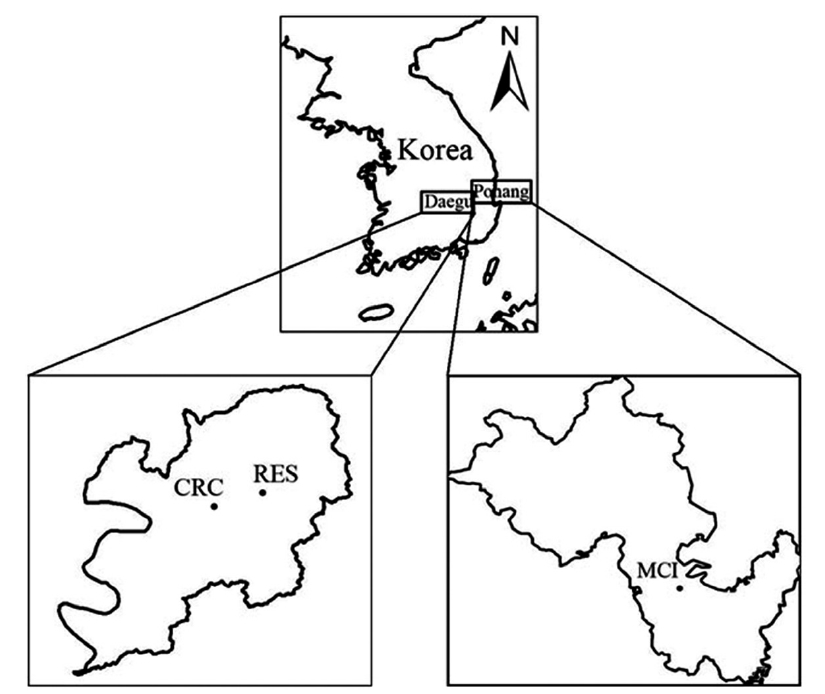
The location of the study cities and the monitoring locations are shown in Fig. 1. Pohang, with a population of 0.5 million and an area of 333 km2, is located on the southeastern coast of Korea (129 degrees east longitude and 36 degrees north latitude), about 360 km from Seoul. The ISIC occupies 20 km2 of the area, with POSCO occupying 8.9 km2. Additionally, approximately 1,800 other non-ferrous metal, iron, and steel ferro-alloy manufacturing companies are located in the ISIC. The ambient air VOCs are monitored at a height of 1.8 m above the roof of a four-story office building located near the center of the ISIC in the Janghungdong area.
Daegu, with a population of 2.5 million and an area of 885 km2, is also located at about 129 degrees east longitude and 36 degrees north latitude. The Daegu monitoring sites included a residential area (Manchondong) and a combined residential and commercial area (Daemyeongdong). Ambient VOCs in these areas are monitored at a height of 1.8 m above the roof of a twostory elementary school and a three-story office building.
As of December 2010, the number of vehicles registered in Pohang and Daegu were as follows: 145,756 and 676,738 passenger cars; 3,960 and 22,596 taxicabs; 11,748 and 47,639 buses; 36,619 and 160,068 trucks; and 1,961 and 1,489 special cars, respectively. Most of these passenger cars and motorcycles consume gasoline, while the buses and taxis mainly use diesel-fuel and liquid petroleum gas (LPG), respectively.
VOC measurements have been performed over a 1 hr period under the regulations of the Korea Ministry of Environment (KME). A combined system of an on-line thermal desorption unit and a gas chromatography/dual flame ionization detector is utilized to measure the concentrations of individual VOCs. All procedures for both the air sampling and analysis, including quality control and quality assurance, follow the standard method suggested by the National Institute of Environmental Research [17]. Method detection limits (MDLs) for most VOCs were ≤ 0.34 μg/ m3, but ranged from 0.02 to 0.93 μg/m3. Data were only included in the analysis when 80% or more of the values were available for each year at any of the stations. We performed statistical analyses on monthly 4 hr VOC data monitored from January 2006 to February 2009. The VOC concentrations of measurements below the MDLs were set equal to 1/2 of MDLs of the respective VOCs. Meanwhile, O3 and NOx monitoring data for the study areas were obtained from Air Korea (http://www.airkorea.or.kr).
The statistical analyses were performed using SAS software ver. 9.1 (SAS Institute Inc., Cary, NC, USA) on a personal computer. The Shapiro-Wilk statistical test was employed to evaluate the normality of the data. The data were then analyzed using a paired
3.1. Ambient VOC Concentrations by Different Land-Use Types
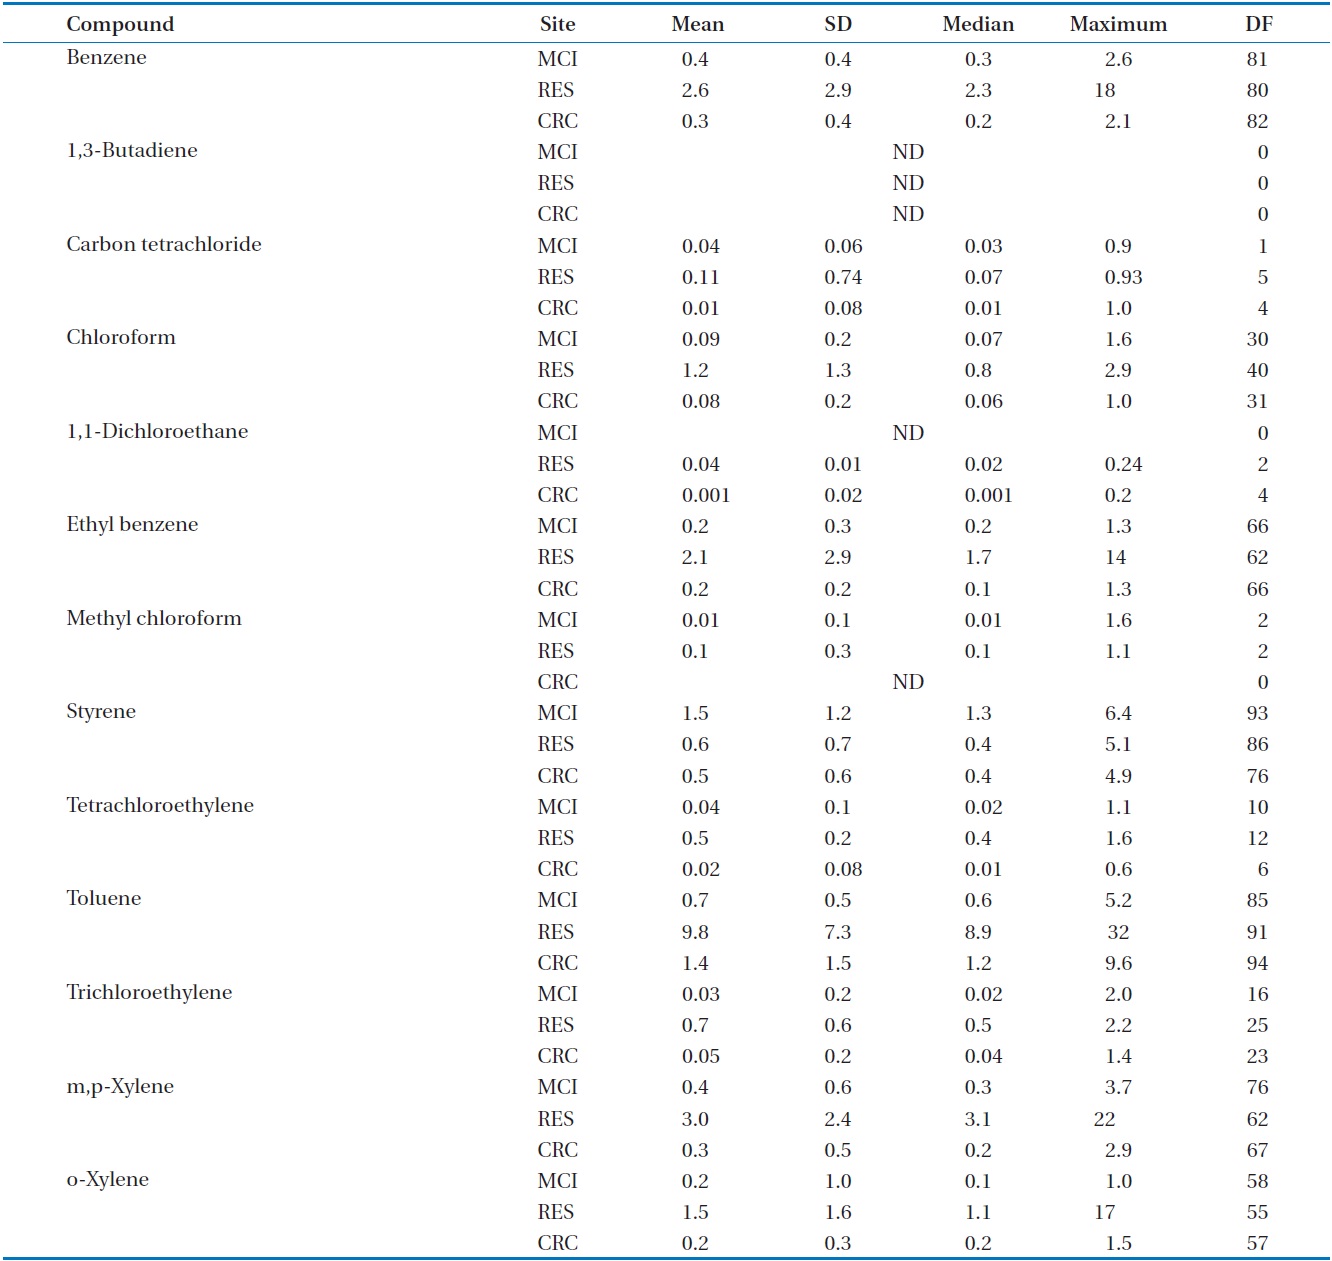
Since the distributions of all the results for the ambient VOC concentrations were right-skewed with higher arithmetic means than median values, it would seem that the data were log-normally distributed. Consistently, a statistical test of normality (Shapiro-Wilk statistics) indicated that the data were log-normally distributed for most cases. The detection frequencies of VOCs monitored in different land uses are presented in Table 1.

Statistics of ambient volatile organic compound concentrations (μg m-3) and detection frequency (DF, %) in metal industryconcentrated (MCI), residential (RES), and commercial/residential combined (CRC) sites
From now on, abbreviations of the target compounds presented in Table 1 are used for convenience. For all types of land use, aromatic VOCs (benzene, ethyl benzene, styrene, toluene, m,pxylene, and o-xylene) exhibited higher detection frequencies (55-94%) compared to other target VOCs. Similarly, Nguyen et al. [18] reported a higher detection frequency for many aromatic VOCs than for chlorinated or oxygenated VOCs at an urban monitoring station in Seoul, Korea. However, 1,3-butadiene was not detected at any land sites. This is mainly due to the use of Tenax (Supelco, Bellefonte, PA, USA) adsorbent used for VOC sampling [19]. This assertion is supported by the finding that Tenax is not appropriate for 1,3-butadiene because of its high reactivity on the surfaces of this adsorbent [20, 21]. Martin et al. [21] have recommended Carbopack X as an appropriate adsorbent for ambient 1,3-butadiene sampling.
Table 1 also represents the statistics of ambient VOC concentrations monitored for different types of land use. Aromatic compounds were predominant in the VOC groups in all land uses. The predominance of aromatic VOCs in metal industry-concentrated area (MCI) was consistent with that of Tsai et al.’s study [14]. Depending upon the land-use type, toluene and styrene were the two most abundant VOCs. For example, RES revealed a maximum toluene concentration of 32 ppb, while MCI did a maximum styrene concentration of 6.4 ppb. It is noteworthy that MCI exhibited lowest concentrations for most target VOCs. A possible explanation for this result is that the source strength of VOC emissions could be greater in RES and CRC than in MCI. As such, it is suggested that, although the production of metals is known as one of the human activities that emit VOCs [13-16], this industrial activity would not be a significant source for ambient VOCs in Pohang. Rather, traffic and gasoline-associated (gas stations and gasoline-storage tanks) emissions are more likely major sources of ambient VOCs even in this city, since they contribute substantial VOC emissions in many urban areas [5, 22, 23]. This assertion is supported by the finding that aromatic VOCs, which are well known as motor vehicle exhaust markers [24], were major contributors of VOCs in the study areas. The high ambient concentrations of aromatic VOCs appeared to be attributable to their high proportion in domestic gasoline supplied by the 5 Korean petroleum companies. According to the Korean Ministry of Environment, the average proportion of aromatic constituents is 21%, with benzene at 0.4%; toluene, 11%; ethyl benzene, 5.6%; and xylenes, 4%. In addition, the higher toluene concentration in both RES and CRC areas is presumably attributed to some spurious gasoline that was sold illegally during the experimental periods of the present study. Although information on the exact amount is unavailable, the consumption of spurious gasoline would be much higher for Daegu than for Pohang on the basis of the number of vehicles registered in the two cities, as described above. The proportion of toluene in the spurious gasoline has been reported to be about 50% by volume, which is much higher than that of gasoline (11%) sold legally in Korea. Accordingly, greater use of spurious gasoline in Daegu would elevate toluene concentrations in RES and CRC areas.
Meanwhile, ambient concentrations of most VOCs were higher for the RES area than for the CRC area. More emissions from motor vehicles were generally expected for CRC areas compared to typical RES areas [24]. One possible explanation is that the wind conditions might have been more favorable in the RES location for the transport of VOCs from nearby roadways or other polluted areas, although this speculation needs to be confirmed.
3.2. Temporal Variations in VOC Concentrations
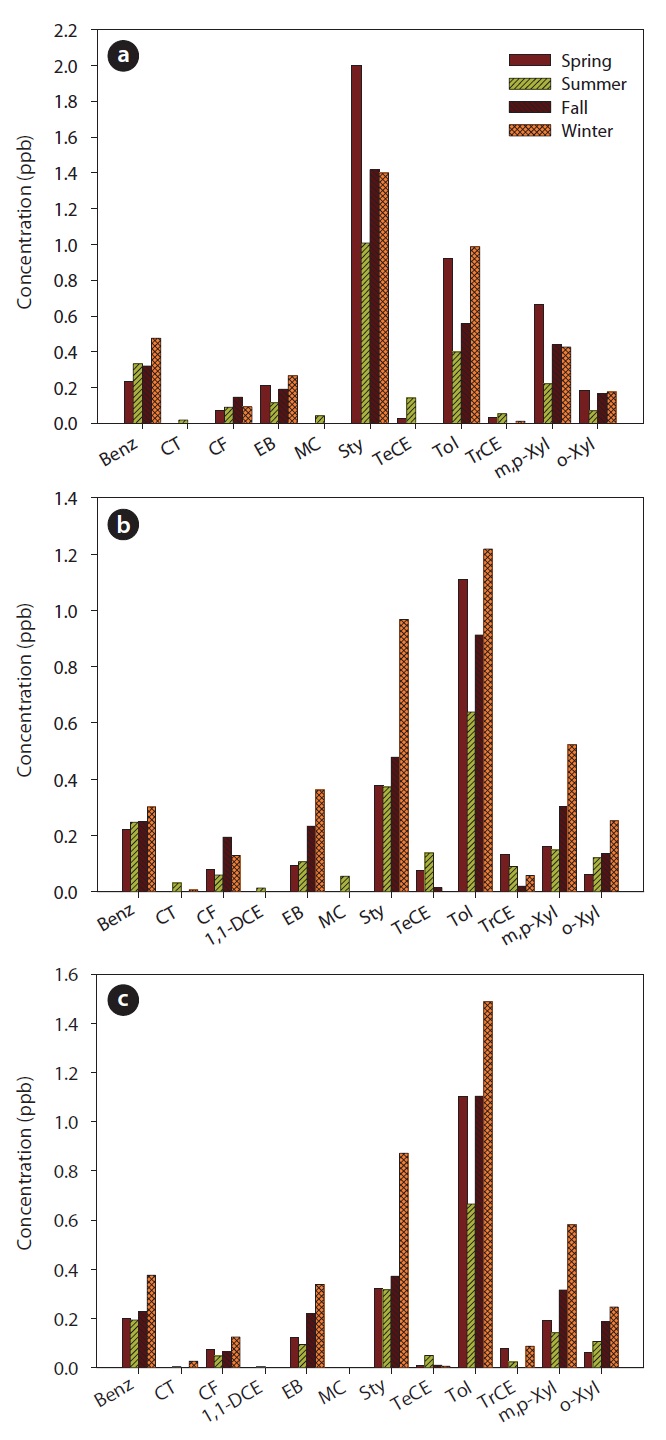
Fig. 2 exhibits variations in monthly mean VOC concentrations monitored in different land uses. In most cases, the ambient concentrations of aromatic VOCs were higher in the winter and spring seasons than the summer and fall seasons, whereas those of chlorinated VOCs did not show any distinctive variations. The elevated VOC concentrations for the winter and spring seasons can be explained by meteorological conditions and emission amounts. Dispersion and dilution of air pollutants through horizontal transport and vertical mixing, respectively, are important meteorological parameters that influence atmo-spheric air quality near emission sources. Temperature inversions result in stable atmospheric conditions, which limit vertical air mixes, constraining pollutants near the surface. Moreover, temperature inversions occur frequently in the cooler seasons, exacerbating the impact of emissions from industry and traffic
[25, 26]. Accordingly, the greater frequency of temperature inversion in the winter would cause higher VOC concentrations. In addition, the lower combustion efficiency of gasoline and fossil fuels for heating associated with a cold ambient temperature [27, 28] is also attributed to the elevated wintertime concentrations.
Seasonal patterns similar to those found in the present study were also found over much of the United States and Europe [29, 30]. Meanwhile, the elevated VOC concentration in the spring might be due to a low wind speed compared to other seasons, since it was at a minimum in the spring in both Daegu and Pohang [19]. However, further study is recommended to confirm this assertion.
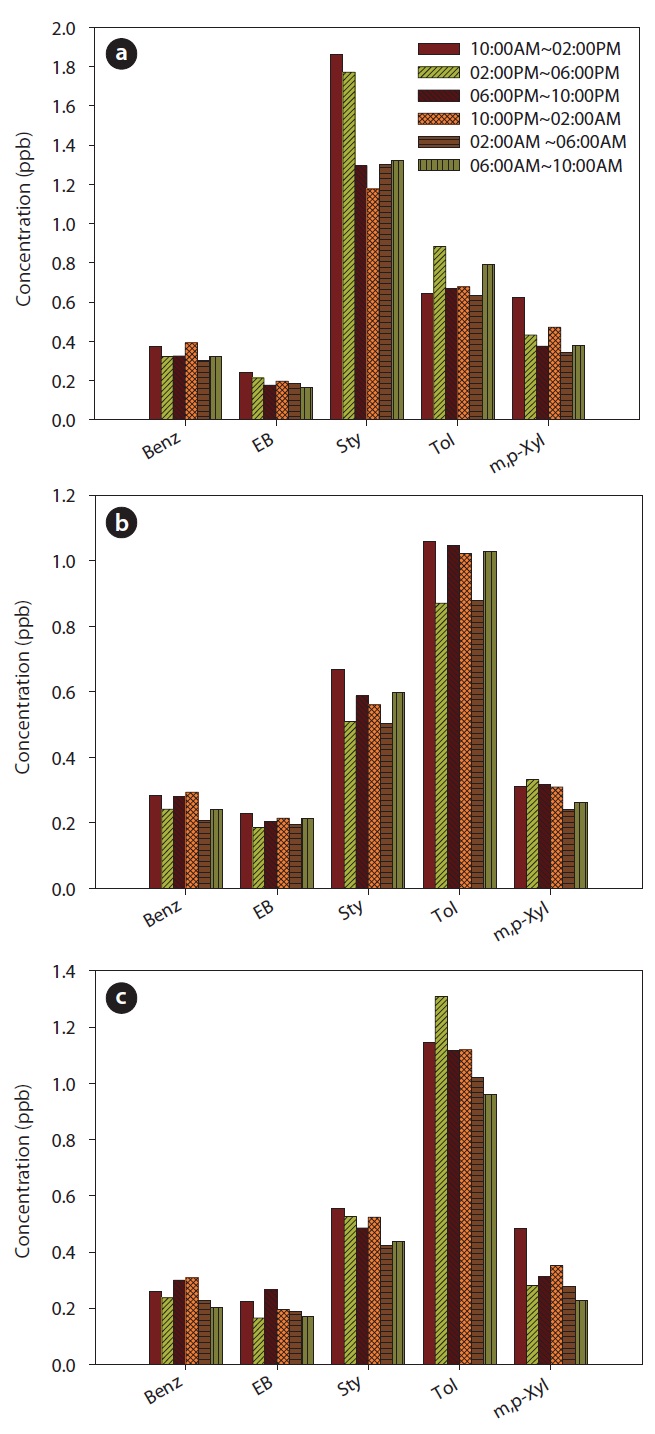
Diurnal variations of VOCs were presented in Fig. 3. The twenty-four hr of the day were divided into six subgroups (10:00 AM-02:00 PM; 02:00 PM-06:00 PM; 06:00 PM-10:00 PM; 10:00 PM-02:00 AM; 02:00 AM-06:00 AM; and 06:00 AM-10:00 AM). In most cases, higher concentrations were observed during daylight hours. A similar diurnal trend has also been reported for several countries [30-32]. This pattern of increases in concentrations during daylight coincided with patterns of typical daily human activities, with higher activities in industrial works and traveling during daytime. However, temperature inversions occur mostly during nighttime. These factors lead to more accumulation of VOCs emitted from ground sources and, in turn, elevate VOC levels during the nighttime. Meanwhile, atmospheric photochemical reactions of VOCs occur during the daytime when sunlight is available [33, 34]. This reaction can reduce daytime VOC concentrations. Nevertheless, the higher VOC concentrations for daytime suggest that neither the temperature inversion during nighttime nor photochemical reaction effects would be enough to outweigh the effect of higher daytime VOC emissions on ambient VOC concentrations.
3.3. Comparison of Ambient VOC Concentrations between Different Industrial Land-Use Types
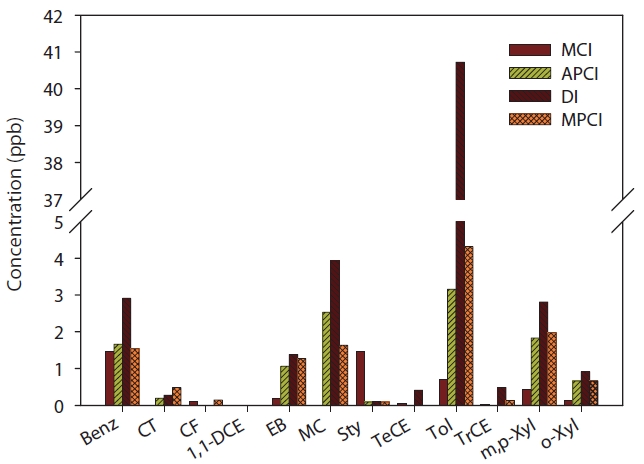
The ambient VOC concentrations monitored in the MCI were compared with those of other industrial areas, which were reported by Lee [19]. Fig. 4 presents ambient mean VOC concentrations (ppb) in the MCI, as well as in automobile parts product industry-concentrated (APCI), dyeing industrial (DI), and me-chanical parts product industry-concentrated (MPCI) sites. The APCI, DI, and MPCI were located in western, northwestern, and northern areas of Daegu, respectively. For all VOCs, the ambient concentrations for MCI were significantly lower than those of other industrial areas. Because metal-production activities are still one of the human activities emitting VOCs [13-16], the lower VOC levels obtained from the MCI may not always suggest that metal-production activities are not a significant source for ambient VOCs as much as the other three types of industrial activities. A further study is recommended to confirm our results, since we could not obtain all information necessary to understand the

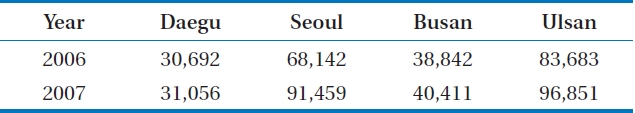
Estimated annual volatile organic compound emissions (ton) in major metropolitan cities in Korea for 2006 and 2007

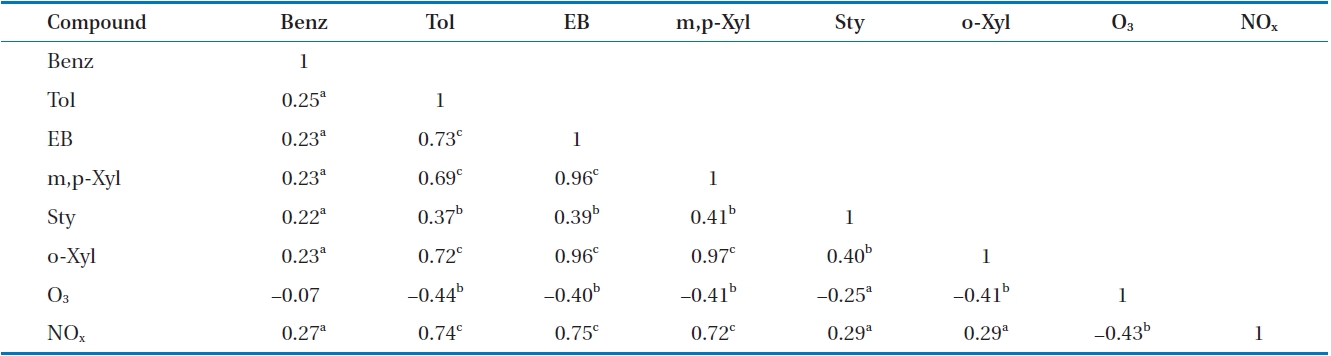
Spearman correlation of ambient major volatile organic compounds, ozone, and nitrogen oxide
difference in ambient VOC concentrations for the four different industrial types. Nevertheless, it is noted that toluene was a predominant VOC in all the industrial areas, and the ambient toluene concentrations were substantially higher for DI compared to other industrial types. This may be explained by the report that this compound is primarily employed in dyeing and finishing processes, although information on these exact amounts is unavailable [13].
3.4. Comparison of Daegu with Other Metropolitan Cities
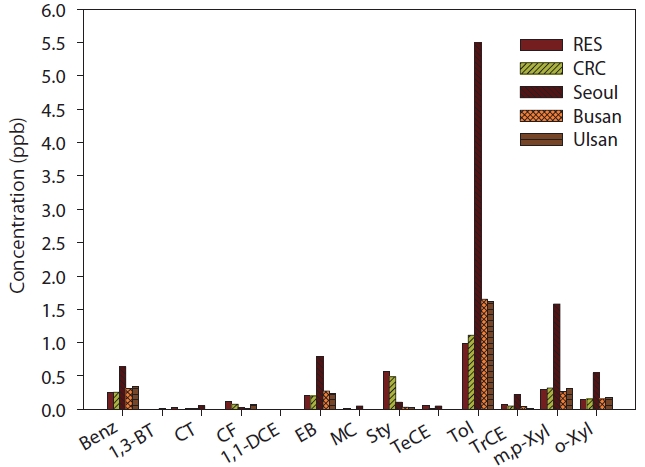
The ambient VOC concentrations monitored in the RES and CRC areas were compared with those of other Korean metropolitan cities, which were reported by Lee [19]. Fig. 5 illustrates the ambient mean VOC concentrations in the RES and CRC areas of Daegu and in the RES and commercial sites of three other metropolitan cities in Korea (Seoul, Busan, and Ulsan). These three cities are the capital of Korea, the second largest city in Korea, and a chemical and petrochemical industry-concentrated Korean city, respectively. They have a population of 10.4 million with an area of 605 km2, 3.6 million with an area of 767 km2, and a population of 1.2 million with an area of 644 km2, respectively. Similar to the industrial areas, toluene was the most abundant VOC in these metropolitan cities. For most target VOCs, the RES and CRC areas in Daegu had lower concentrations than the RES and commercial sites of the other cities. This difference can be explained by VOC emissions from the cities, which were reported by Lee [19]. Table 2 exhibits annual VOC emissions in the four cities. Similar to the ambient VOC concentrations, the VOC emission amount was lowest for Daegu. However, the highest VOC emissions were shown in Ulsan, where the ambient concentrations for most VOCs were lower in comparison to Seoul. This suggests that VOC emission is not likely the only parameter for ambient VOC concentrations. As such, the inter-city difference in ambient VOC concentrations would be a reflection of the combined effects of such driving parameters as vehicle type, driving speed and fuel composition, and regional environmental conditions such as temperature and dispersion or turbulence variability [19].
3.5. Correlation of VOCs, Ozone, and Nitrogen Oxides in Ambient Air
Table 3 reveals the correlation of ambient concentrations monitored in Daegu for major VOCs, O3, and NOx. Six aromatic VOCs that presented high detection frequencies and relatively manhigh ambient concentrations were chosen for this test. The monitoring data obtained from the RES and CRC areas in Daegu were combined for this statistical analysis, since both O3 and NOx average ambient concentrations for both the RES and CRC complex sites in Daegu were available. The ambient aromatic VOC concentrations were all significantly correlated, thereby suggesting a similar source(s) for these compounds, primarily traffic emissions [22-24]. The correlations between the ambient target compounds, except for the correlation between benzene and ozone, were statistically significant. The correlation between VOCs suggests a presence of common source(s) for ambient VOCs. The correlations between these VOCs and O3 and between NOx and O3 may be attributed to the photochemical reactions in atmosphere, since VOCs and NOx are known as two major precursors for the generation of atmospheric O3 in the presence of sunlight [36, 37]. Moreover, in many urban areas, O3 tends to accumulate rapidly when NOx and VOC emissions from traffic and industry are high [13, 16, 38, 39]. As such, the correlation between VOCs and NOx can be ascribed to common sources such as traffic and industrial emissions. Meanwhile, the insignificant correlation of benzene with ozone may be due to the lower reactivity of benzene with NOx compared to other VOCs [40].
The present study examined whether a metal-industrialized city (Pohang, South Korea) presents different characteristics in ambient VOC concentrations when compared to RES and/or CRC areas of another city (Daegu, South Korea). A major finding is that for most target VOCs, ambient concentrations in the metal- industrialized city were lower than for the RES and/or CRC areas. In addition, for all VOCs, the ambient concentrations for the metal-industrialized city were significantly lower than those of other types of industrial areas (ACPI, DI, and MPCI). Accordingly, industrial activities would not be a significant source for ambient VOCs in the metal industry-concentrated city, although the production of metals is known as one of the human activities emitting VOCs. Aromatic compounds were predominant VOC groups in the metal industry-concentrated city as well as for other types of land use. The ambient concentrations of aromatic VOCs exhibited a seasonal variation with a higher trend for the winter and spring seasons, and a diurnal variation with a higher pattern in the daytime. The correlations between the ambient target compounds were statistically significant, except for the correlation between benzene and ozone.