Worldly consumption of fossil fuel has multiplied greenhouse gas emission, which has stimulated researchers’ interest in development of renewable energy instead of traditional energy sources. Biogas production from municipal solid wastes or organic wastes is one of the renewable energy sources and is getting more attention because of the attractiveness of simultaneous waste treatment and electrical generation [1, 2].
However, to use biogas as an energy source, several trace compounds such as hydrogen sulfide, ammonia and siloxanes should be removed [3]. Among these compounds, siloxanes have negative influence on the capability and life duration of generators [4]. Siloxanes are a subgroup of silicones, containing Si-O bonds with organic radicals (mostly methyl-groups) bound to Si [5]. The structure of the siloxane is linear or cyclic. Several technical methods (e.g., adsorption, gas chilling, and absorption) are commercially available to remove the siloxanes today [6]. In adsorption, the most widely used method, various adsorbents and different conditional variables (e.g., flow rate, temperature, and concentration) have been applied to find an optimal condition for increasing adsorption capacity [6-8]. For the traditional searching procedure, one conditional variable at a time is changed without any changes to other variables for finding an optimal condition. This method may produce a certain optimum stage, however, interdependent influence or relations for various conditional variables are not considered in general.
Therefore, an alternative searching procedure involving a statistical tool (e.g., factorial experimental design and response surface methodology [RSM]) should be adopted to solve this complexity [9]. RSM is a collection of mathematical and statistical techniques used to model and analyze problems in which a response of interest is influenced by several variables [10].
In this study, characteristics of the siloxane adsorption with various flow rates and temperatures were analyzed using alumina as an adsorbent of the siloxane. To improve the conventional test method which searches for the effect of each variable, RSM was applied to investigate the individual and interactive effects of flow rate and temperature on adsorption capacity.
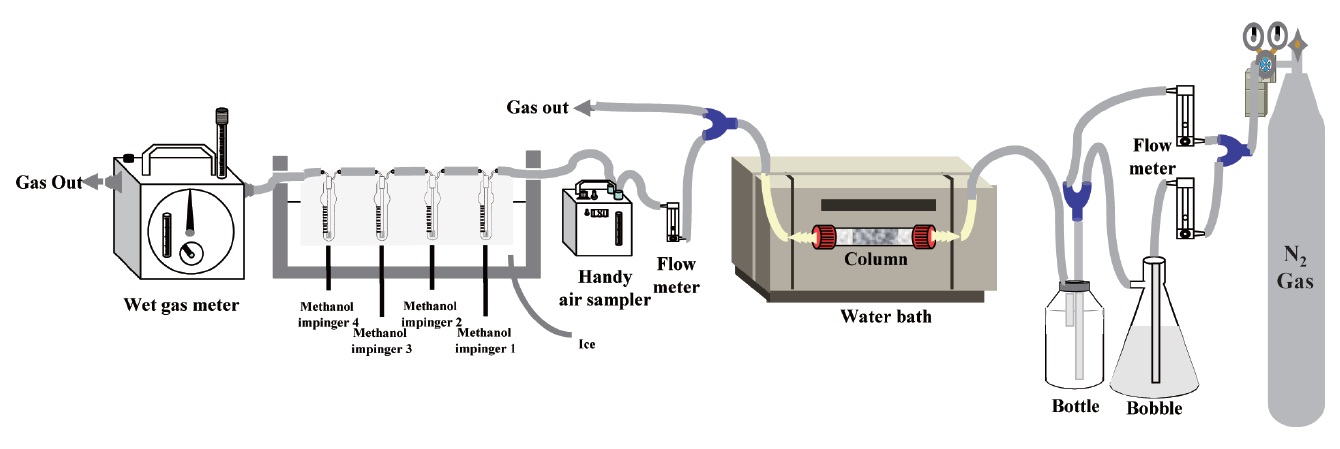
The experimental equipment for this study is presented in Fig. 1. Activated alumina (Duksan Co., Ansan, Korea), an adsorbent of siloxane, was circular-shaped with a white color and its density was 0.6 g/cm3. The setup consisted of an adsorption column (12 mm, diameter; 120 mm, length) filled with 5 g of dried granular activated alumina (65.7% porosity) heated until 300℃ for approximately 2 hr. The gas used in this column was adsorbed
in three impingers containing 6 mL of methanol. The inside of an ice box was steadily kept at a lower temperature of 4 ± 2℃. The gas flow rate into the impingers was 100 mL/min constantly, with discharging of extra gas to the outside. In the last part of the impingers, a wet gas meter was installed to keep the total gas input constant. A gas chromatography/mass spectrometry (GC-MS) system (QP5050A; SIMADZU, Kyoto, Japan) equipped with a ZB-5 column (0.25 μm × 0.25 mm × 30 m; Zebron, Newport Beach, CA, USA) was operated to analyze the siloxane stored in three impingers.
In this study, octamethylcyclotetrasiloxane (D4; Acros Organics, Fair Lawn, NJ, USA) and decamethylcyclopentasiloxane (D5; Merck-Schuchardt, Hohenbrunn, Germany) were used as
[Table 1.] Central composite design
Central composite design
siloxane test materials and are major components of siloxanes in biogas. To generate constant input concentration of the siloxane without any dependence of input gas rate and gas temperature, nitrogen gas is injected into two parts separately. One part of nitrogen gas injection was fed to a glass bottle containing a standard siloxane solution (D4, 100 ppm; D5, 70 ppm), and it was mixed with the other nitrogen gas injection before being introduced into the adsorption column. The siloxane solution was vaporized into the nitrogen gas. The average concentration of the injected siloxane mixture to the adsorption column was 250 μg/m3. Teflon pipe (5 m) was installed between mixing chamber and adsorption columns in a water bath for constant gas temperature.
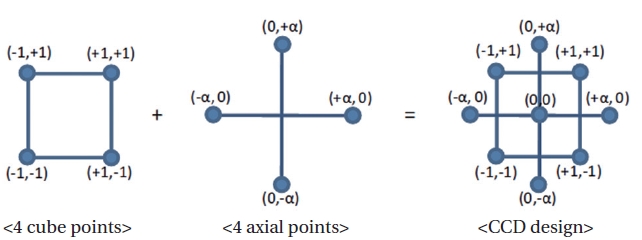
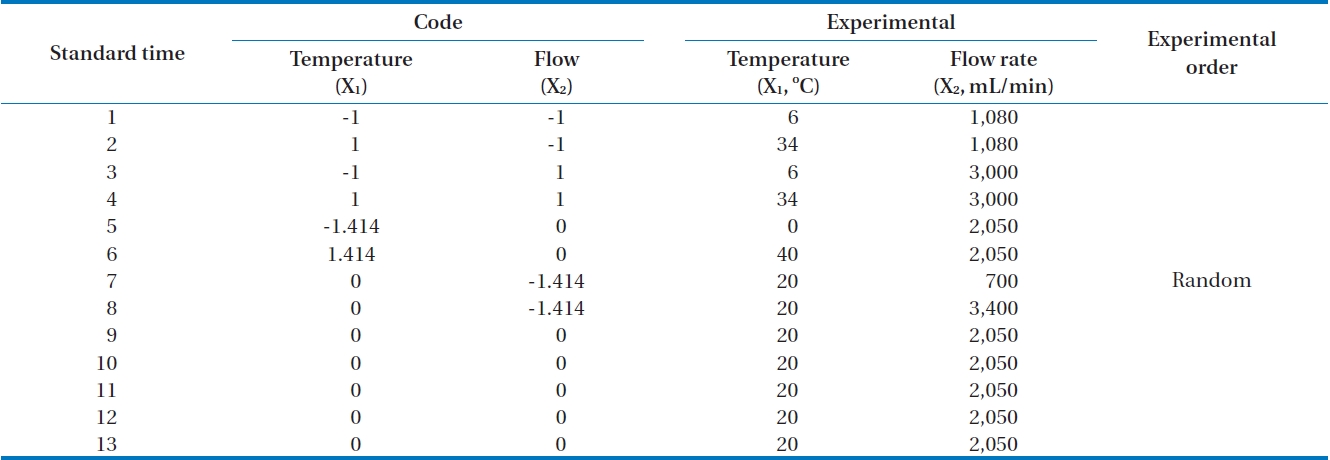
2.2. Central Composite Design and Data Analysis
A central composite design is a second order factorial design including a central point and axial points [11]. If the number of independent variables is k, the points of factorial experiments are 2k and axial points are 2k. Therefore, if the number of repeats at a central point is n, the total number of experiments is 2k+2k+n. As an example, Fig. 2 shows four (2k = 4) points as cube points, four (2k = 2) axial points, and one center point (0, 0). Therefore if k is equal to 2, the minimum number of experimental points is 9 for central composite design.
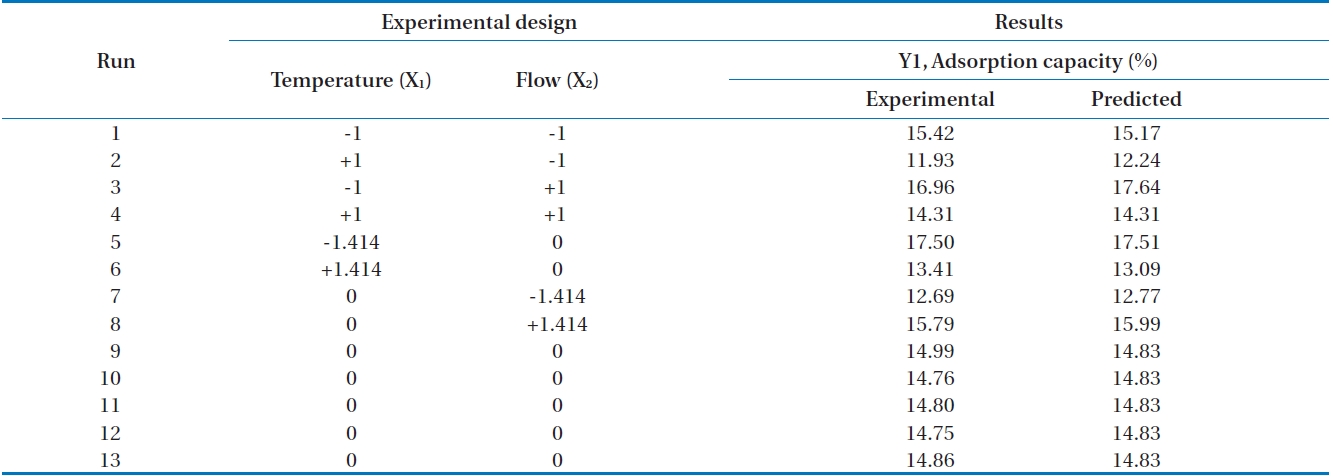
In this research, the applied flow rate and adsorption temperature as independent variables with the siloxane adsorption capacity as a dependent variable were examined with 13 experiments (Table 1). A central point was replicated 5 times in order to investigate experimental error.
Factorial design levels were codified from -1 to +1. The usage of axial point (
The experimental design was analyzed using the RSM. The variables, X
xi = (Xi- X* i )/ΔXi (1)
Where,
xi: dimensionless coded value of an independent variable
Xi: actual value of an independent variable for the i-th test
X* i: actual value of an independent variable at the central point
ΔXi: step change
Regression analysis for the experimental results was performed using Minitab software ver. 14 (Minitab Inc., State College, PA, USA), and Eq. (2) was applied to search the optimum conditions.
Y=β0 + β1X1 + β2X2 + β11X1 2 + β22X2 2 + β12X1X2 (2)
Where,
Y: predicted response
X1, X2: independent variables
β0: constant coefficient
β1, β2: linear coefficients
β11, β22: quadratic coefficients
β12: interaction coefficient
3.1. Adsorption Capacity of Siloxane
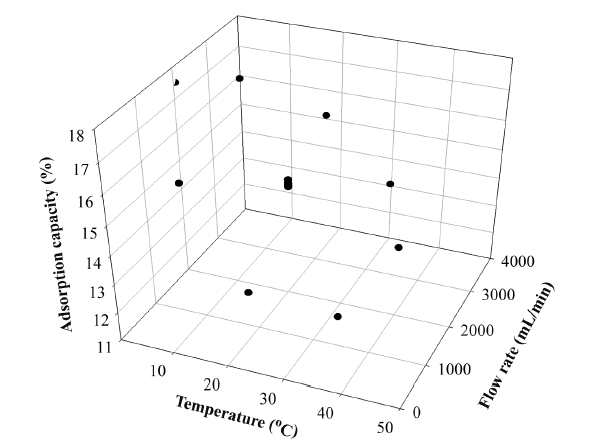
In this study, as an index of the adsorption performance, the adsorption capacity (the weight of the adsorbed siloxanes/the weight of the adsorbent) was calculated [7]. The results of the siloxane adsorption capacity depending on various flow rates and temperatures in the adsorption column filled with activated alumina are shown in Fig. 3. The 1,080 mL/min of flow rate with two separate temperatures, 6℃ and 34℃, produced adsorption capacities of 15.42% and 11.93%, respectively. The temperature of 6℃ produced better adsorption capacity. When flow rate was fixed to 2,050 mL/min with various temperatures (i.e., 0℃, 20℃, and 40℃), adsorption capacities were 17.5% (0℃) and 13.41% (40℃), respectively. The results of the adsorption capacity when flow rate was 3,000 mL/min with temperatures of 6℃ and 34℃ were 16.90% and 14.31%, respectively. From these experimental results, we clearly see that reduced temperature provides better conditions for the adsorption capacity with fixed flow rate. Ricaurte Ortega and Subrenat [13] reported that the increase in the temperature reduced the adsorption capacity. The reason for decreased adsorption capacity when temperatures were increased might be that the adsorption process between siloxane and activated alumina relies more on physical than chemical adsorption.
Alternatively, we tried to study the pattern of fixed temperature with various flow rates. When temperature was fixed to 20℃ with diverse flow rates (700 mL/min, 2,050 mL/min, and 3,400 mL/min) the adsorption capacities were increased to 12.69%, 14.75-14.99%, and 15.7%, respectively.
Adsorbates must be transported through the boundary layer that surrounds the adsorbents when gas is flowing past them. The distance of transport is determined by the flow rate past the adsorbent. Higher flow rate results in shorter distance. Therefore, when gas flow rate was increased, the siloxane was transported more quickly through the boundary layer. After passing through this boundary layer, siloxane was transported more quickly through the adsorbent’s pores to the available adsorption sites. This rapid diffusion into pores of adsorbent might generate more reactions on the adsorbent with increased adsorption capacity [14].
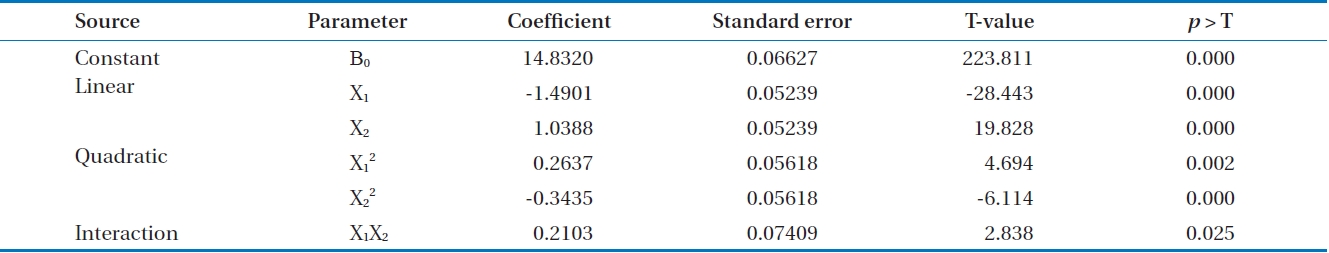
Based on the above results, second order polynomial equations for the adsorption capacity fitted in terms of coded and uncoded factors were obtained, as shown in Eqs. (3) and (4):
Parameter estimate from coded data
Y=14.832-1.5828X1+1.1483X2+0.2151X1 2-0.2049X2 2-0.1372X1X2 (3)
Parameter estimate from uncoded data
Y=13.6726-0.1341X1+0.00233X2+0.00108X1 2-2.2497×10-7X2 2-1.0167×10-6X1X2 (4)
Where, X1 and X2 represent temperature and flow rate, respectively.
Table 2 shows experimental results and predicted values with ranges of 11.93-17.50% and 12.24-17.64%, respectively.
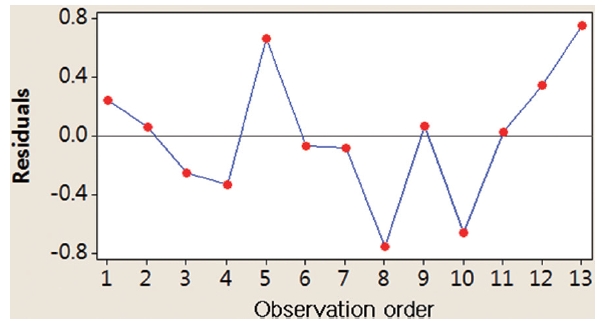
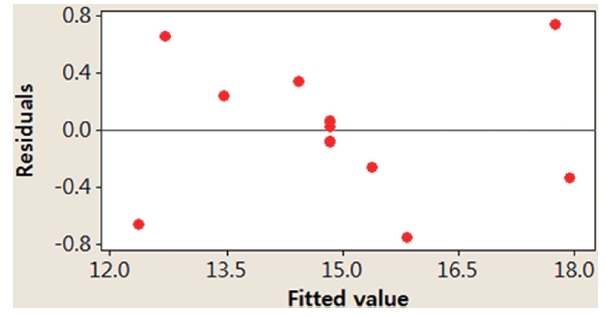
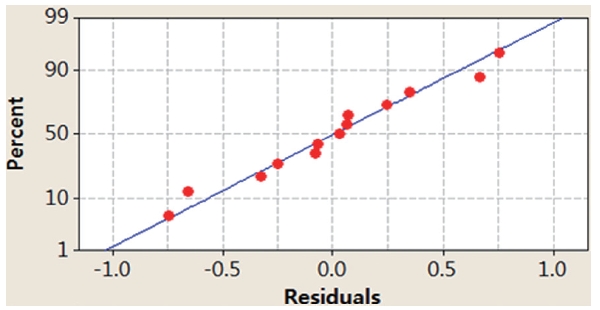
In this study, we applied two different methods (i.e., graphical and numerical methods) to validate the model. Graphical methods utilize residual analysis between the values of dependent variables and predicted values from a regression equation. Fig. 4
[Table 2.] Central composite design and the results obtained

Central composite design and the results obtained
[Table 3.] Analysis of variance results for the adsorption capacity
Analysis of variance results for the adsorption capacity
presents randomly distributed residuals and predicted values in a scatter diagram within ± 0.8. In Fig. 5, each residual is plotted against an index of observation orders of data, which was used to check for any drift in the process. As previously shown in Figs. 4 and 5, we are not able to see any pattern of residual distribution. From this result, we may say thatdual is independent. Fig. 6 is a graph to check the normality distribution of the residuals. In this figure, experimental points are close to the center cross line, which means the test follows the normal distribution relatively well.
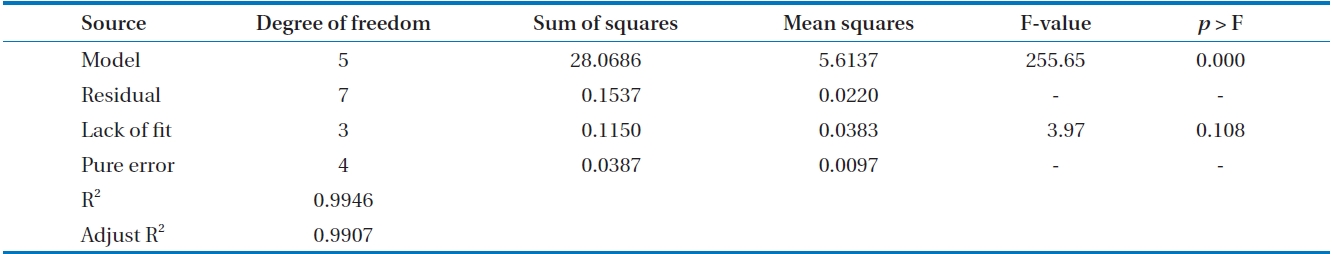
The model was then checked using a numerical method employing analysis of variance (ANOVA). The results of ANOVA are shown in Table 3. The value of
[Table 4.] Estimation of the second-order response surface parameters (coded unit)

Estimation of the second-order response surface parameters (coded unit)
[Table 5.] Confirmation experiments at optimum conditions

Confirmation experiments at optimum conditions
variation of the data around the fitted model. When the
3.4. Optimization and Verification of the Model
The
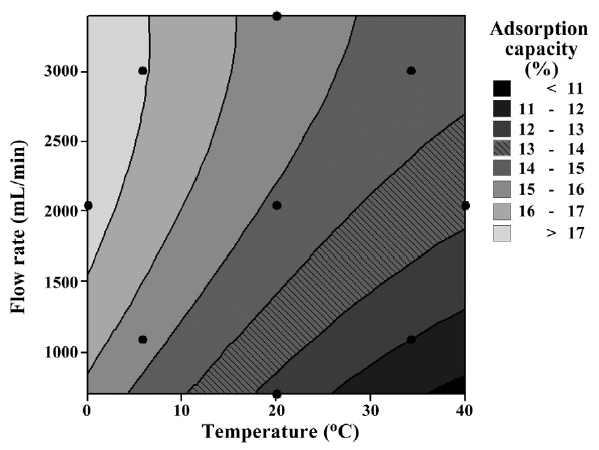
In Fig. 7, a two contour line graph shows the effects on adsorption capacity based on flow rate and temperature. The optimum status (i.e., temperature below 5℃ and flow rate over 1,500 mL/min) for adsorption capacity was presented in the two contour line graph. In the case of response surface graph, depending on the shape of the response surface, we can find the optimum conditions. However, this study had some difficulties in finding the optimum conditions under the given conditions because the contour lines are raised continuously. It seems more research is necessary to find the optimum conditions under 0℃.
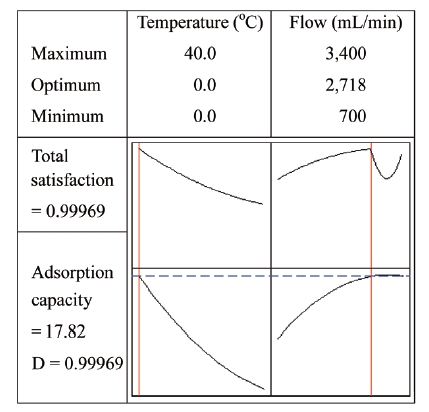
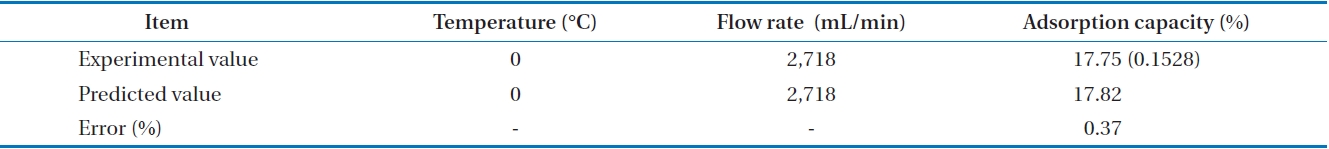
The optimum conditions under the given conditions were predicted using Minitab software. Fig. 8 shows the optimum values at the top of the graph at 0℃ and 2,718 mL/min, with a maximum adsorption capacity (17.82%).
In order to verify the model, experiments were performed to compare the experimental results with corresponding predicted values. Table 5 shows that the experimental adsorption capacity of 17.75% and the predicted value of 17.82% corresponded well. The experiment results were close to the model prediction. Additionally, this study confirmed that the RSM method is appropriate for optimizing the adsorption capacity.
This research applied response surface methodology to find the optimum conditions of temperature and flow rate for siloxane adsorption capacity in activated alumina as an adsorbent. The results are shown below: 1) With faster flow rate, increased temperature minimizes siloxane adsorption capacity on activated alumina because the adsorption mechanism has a preference for physical adsorption instead of chemical adsorption relying on activate energy; 2) Under the conditions of constant temperature, flow rate and adsorption capacity have a positive relation. When gas flow rate was increased, siloxane was transported more quickly through the boundary layer. After passing through this boundary layer, siloxane was transported more quickly through the adsorbent’s pores to the available adsorption sites. This rapid diffusion into pores of adsorbent might generate more reactions on the adsorbent with increased adsorption capacity; 3) From statistical analysis on siloxane adsorption capacity, second order polynomial equations were confirmed by the ANOVA result, with a p-value lower than 0.05; and 4) In numerical optimization, optimal conditions (i.e., 0℃ and 2,718 mL/min for temperature and flow rate, respectively) were obtained with 17.82% adsorption capacity. Additionally, the three verification tests showed small error rate (0.37%) using the obtained model.

![Central composite design (CCD): 4 cube points, 4 axial points, and 5 replicates at the central point (0,0) [12].](http://oak.go.kr/repository/journal/11614/E1HGBK_2012_v17n2_117_f002.jpg)