Environmentally friendly and more efficient methods to produce energy are currently under intense research and development. Pyrolysis/gasification technology is an energy conversion technique, which produces syngas (synthesis gas) from various waste resources, such as biomass, solid waste, organic sewage sludge, and etc. However, tar is generated during the pyrolysis or gasification process. The tar is a hydrocarbon compound, which can be easily condensed under an ambient condition, and is consisted of aromatic compounds having benzene rings [1, 2]. Especially, condensed tar can cause corrosion problem from an organic acid and generates obstacle in pipelines. This will hinder the maintenance and operation of the facility.
Tar removal technology can be divided into in-pyrolysis gasifier technology (IPGT) and technology after pyrolysis gasifier (TAPG). The IPGT does not require additional facility for tar removal, and adopts the improvement in the operating conditions and gasifier design technology. Through these researches, production of syngas, with low tar concentratiom, should be achieved, but numerous limitations, such as facility scale-up, and installation of expensive and complex thermal decomposition gasifier, are remained [3, 4].
The TAPG can be broadly categorized into physical and chemical methods [1, 5, 6]. The physical methods employ wet scrubber, cyclone, filter, wet electrostatic precipitator, and adsorption tower. The chemical methods employ catalytic and thermal cracking, partial oxidation, and plasma reactors. The wet scrubbing has been widely used for tar removal, but wastewater has to be treated in order to avoid environmental pollution, using a large plant, and this incurs a relatively high cost. The catalysts are extremely sensitive to the contaminants, such as sulfur, chlorine, and nitrogen compounds, generating in gasification of biomass. Also, they can get deactivated due to coke formation, and high cost should be considered during its usage at high temperatures.
As an alternative to this, basic study on low temperature pulsed plasma for tar removal has been conducted to resolve the formation of tar, during the biomass pyrolysis. Compared to the conventional thermal and catalytic cracking, plasma discharge shows the higher removal efficiency, due to the formation of radicals. However, high cost of preparation of pulse power supply and short life cycle is the key for improvement [7].
A gliding arc discharge has been utilized for the hydrogen rich gas production from fossil fuel and biogas, and for decomposition of volatile organic compounds (VOCs), and shows a greater potential, compared to the others. It is widely acknowledged to be more commercial for reforming and VOCs reduction [8-11]. However, there is almost no gliding arc discharge applied to tar
removal in product pyrolysis gas.
As major features, it is easy to control the operating conditions and has high decomposition efficiency for tar destruction, along with high energy efficiency. Therefore, it should be accepted as a new alternative method with feature of environmentfriendliness.
In this study, a gliding arc plasma reformer was developed for the decomposition of tars in the product pyrolysis gas. In addition, the benzene and naphthalene were selected as major tar compounds in the pyrolysis gasification of the sewage sludge, and was tested with parameters that could effect the decomposition efficiency of the tars and energy efficiency.
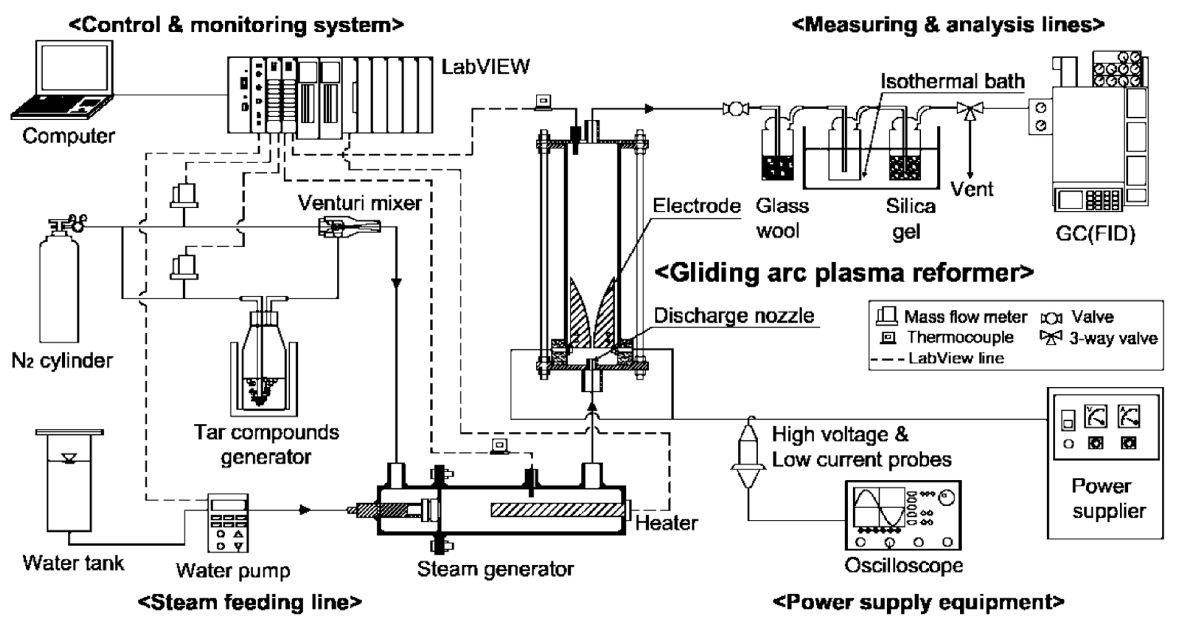
Fig. 1 shows a schematic of experimental setup for tar compound decomposition test. The experimental setup consisted of a gliding arc plasma reformer, steam feeding line, power supply equipment, measuring and analysis line, and a control and monitoring system.
The gliding arc plasma reformer consisted of a quartz cylinder (55 mm in diameter and 200 mm in length) to see the inside and for insulation, having three diverging knife-shaped electrodes in 120 degrees. The electrodes length was 95 mm, and gap distance between electrodes was 3 mm. An electrode support was made of ceramic (Al2O3 weight 96%) for fixation and insulation of the electrodes. A gas injection nozzle was set on the ceramic plate, and the diameter of the nozzle was 1.5 mm.
The steam feeding line consisted of a steam generator and a water pump. For the steam supply, distilled water in the water tank is fed by the water pump (STEPDOS03; KNF, Balterswil, Switzerland). The feed water should be changed to steam in the steam generator. The water pump controls the steam amounts.
The power supply equipment consisted of a power supplier (UAP-15K1A; Unicorn Tech., Anyang, Korea) and an electric instrument, having a high voltage probe (P6015; Tektronix, Beaverton, OR, USA) and a low current probe (A6303; Tektronix) with an oscilloscope (TDS-3052; Tektronix). The power supplier supplies 3 phases of alternating current (AC) to the plasma reformer, and the electric instrument determines an electric power by measuring the voltage and current in the two probes.
The measuring and analysis line consisted of sampling line, including a glass wool bottle, a silica-gel bottle and an analyzer, including a gas chromatography (GC-14B; SHIMADZU, Kyoto, Japan) with FID detector and capillary column (J&W DB-1, 15 m x 0.25 mm I.D., 0.25 μm; Agilent Technologies, Palo Alto, CA, USA).
The control and monitoring system consisted of a LabVIEW 8.6 (National Instrument, Austin, TX, USA) and a computer. The LabVIEW monitors the temperatures in each part, and controls water pump, heater of steam generator, and nitrogen gas flow rate.
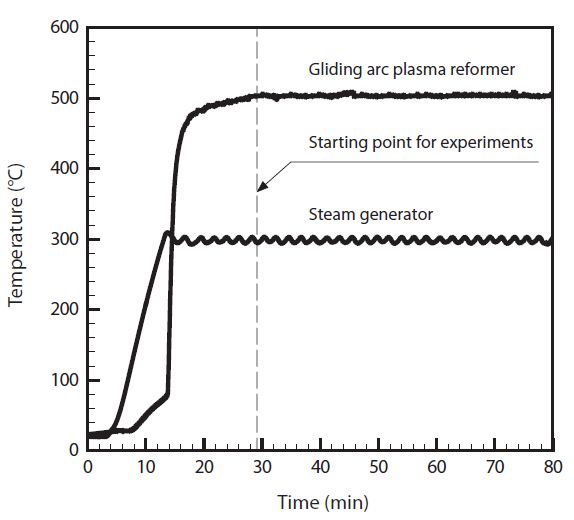
The nitrogen in a N2 cylinder was fed through the dilution line to purge the plasma reformer. The tar compound generator and steam generator were heated up to the setting temperature, respectively. Also, nitrogen was fed through the feeding line, and water was fed through the water pump to the steam generator. After stabilizing the temperature for each part, the experiments were achieved, as shown in Fig. 2. Sampling of tar compound was made at the sampling port, located on the inlet and outlet. Soot and water in the sampling gas were removed at glass wool and silica gel bottles. The dried gas sample was entered to flame ionization detector (FID) injection port of the gas chromatograph for gas analysis. Analysis condition of the gas chromatograph was maintained as 200℃ for the injector and 280℃ for the detector. Oven temperature is raised from 40℃ to 320℃ at 10℃/ min, and stabilization status is analyzed for the next 20 min.
As parametric experiments, steam feed amount (steam to
carbon ratio, S/C ratio), input discharge power (specific energy input, SEI), total feed gas amount, input tar concentration were selected as factors that can impact on tar decomposition efficiency. The range of variables is shown in Table 1, including the optimum case.
Tar decomposition efficiency showing the degree of tar destruction, among the feed gas is calculated according to Eq. (1) [12].
where, [VC]inlet is the input tar concentration (%), and [VC]exhaust is the tar output concentration (%).
Equation for energy efficiency of the reformer is shown in Eq. (2) (i.e., mass of tar removed per unit energy consumed) [12].
where, [MC]removal is the removal tar concentration (g/m3), Q is the
[Table 1.] Experimental conditions for parametric studies and optimum cases
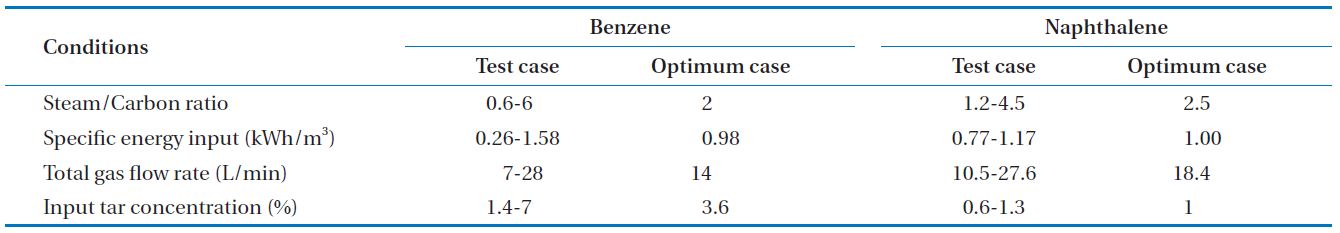
Experimental conditions for parametric studies and optimum cases
[Table 2.] Experimental results at the optimum conditions
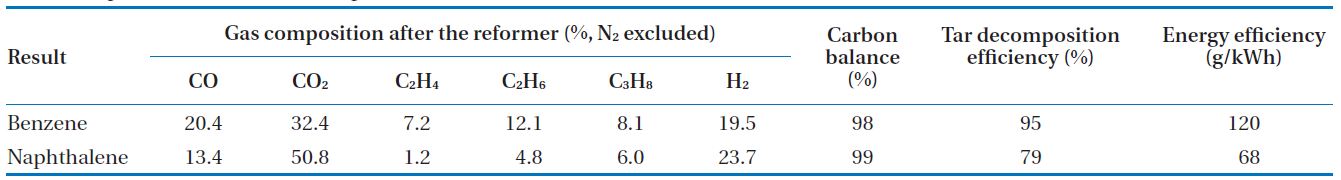
Experimental results at the optimum conditions
total gas flow rate (m3/h1), and IP is the input electric power for plasma discharge (kW).
SEI is denoted as the ratio of input electric power, and a total gas flow rate, and is shown in Eq. (3) [12].
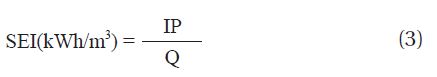
SEI was varied from 0.26 to 1.58 kWh/m3 by controlling the power ranging from 0.22 to 1.33 kW.
Carbon balance, which represents the carbon mass, as follows in Eq. (4) [13].
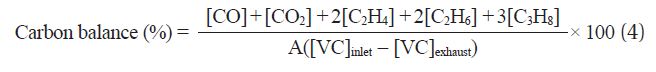
where [CO], [CO2], [C2H4], [C2H6], and [C3H8] are the concentrations of each ingredient (%), and A is the carbon constant. (i.e., benzene = 6, naphthalene = 10)
In this study, a gliding arc plasma reformer for tar destruction, among the pyrolysis product gas from sewage sludge was developed. For this purpose, tar compounds were tested according to test conditions. Experimental conditions and optimal conditions are shown in Table 1. The experimental conditions in each parameter were taken for test rages, maintaining a stably plasma discharge. The optimal case was the conditions showing the maximum tar decomposition and energy efficiencies, and the results are presented in Table 2. For benzene, the decomposition efficiency and energy efficiency were 95% and 120 g/kWh, respectively. In addition, carbon balance showed 98%. For naphthalene, the decomposition efficiency, energy efficiency, and carbon balance were 79%, 68 g/kWh, and 99%, respectively.
The light gases that were produced from the benzene and naphthalene decomposition included H2, CO, and CO2, C2H4, C2H6, C3H8. In addition, the carbon balance did not reach 100% because the heavy hydrocarbon, nitric tar products (HCN and CN), the carbon black, and etc., from the benzene and naphthalene conversion products, were not considered [14].
3.1. Effect of Steam Feed Amount
Fig. 3 shows the tar decomposition efficiency and energy efficiency by the change of steam feed amount (S/C ratio). The carbon black formed at less than the specific value of S/C ratio in the plasma reformer. Further, at higher than the specific value of S/C ratio, the temperature decrease of the steam evaporator was noticed from the increased amount of water. Therefore, S/C ratios in these experiments were varied from 0.6 to 6 in the benzene tar, and from 1.2 to 4.5 in the naphthalene tar. Tar decomposition efficiency was gradually increased with S/C ratio, and show the maximum values. After that, those are gradually decreased.
Steam injection on plasma discharge in the reformer leads to the direct formation of hydroxyl radicals (OH*), which is generated by the radiolysis of water [15].
H2O → H++OH*+e- (5)
Increase in steam, during discharge, shows the increment of hydroxyl radicals, which react with benzene and naphthalene for the destruction. That is why the tar decomposition efficiencies are increased gradually.
However, the steam also has an adverse effect on tar re-
moval, due to its electronegative characteristics, as seen in the figures. Too many water molecules limit the electron density in the plasma reformer and quench the activated chemical species [12]. Therefore, controlled humidity is essential for tar decomposition. For the benzene tar, energy efficiency is significantly increased with S/C ratio, and slightly decreased after a maximum value of 142 g/kWh at 4.5 of S/C ratio. For the naphthalene tar, the energy efficiency is raised up to 63 g/kWh at 3.5 of S/C ratio. After this peak point, the efficiency is decreased gradually. The reason why the energy efficiency in the naphthalene decreases more drastically is that the decrease of naphthalene decomposition was much lower than one of the benzene decomposition.
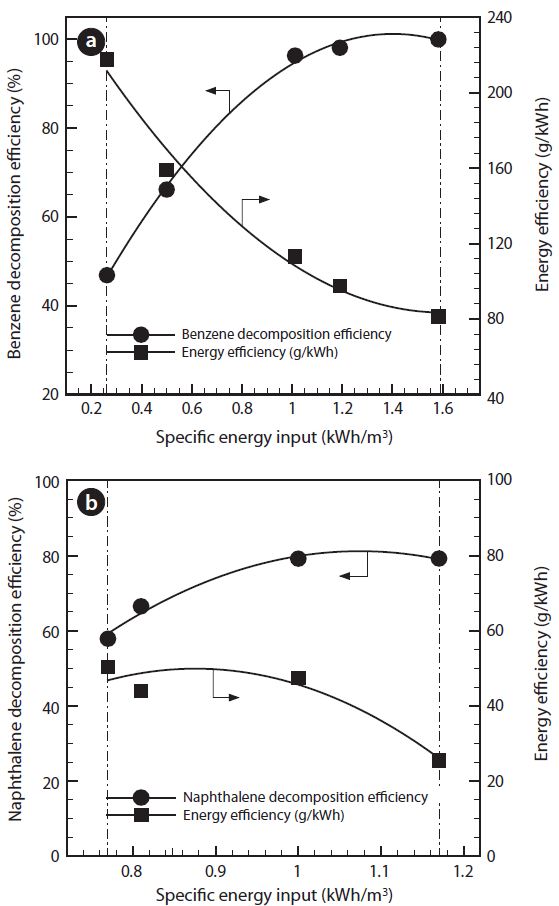
3.2. Effect of Input Discharge Power
Fig. 4 presents the effect of SEI, which is denoted as the ratio of electric input power and feed gas flow rate, and is shown in Eq. (3). Change in SEI was made for 0.26-1.58 kWh/m3 by adjusting the input discharge power on 0.22-1.33 kW. As SEI increases, benzene decomposition efficiency is significantly increased, and shows higher than 90% after 0.9 kWh/m3 of SEI. Gradual increase in naphthalene decomposition efficiency is exhibited by increasing the SEI, and average 79% of decomposition efficiency
is achieved at higher than 1 kWh/m3. High power, i.e., high SEI, gives more available electrons to initiate the decomposition of benzene or naphthalene by collision. This is reasonably supported by the fact that the quantity of electric transfer between the electrodes increases with increasing applied voltage with fixed geometry of the electrode [9].
In addition, benzene energy efficiency is decreased from 217 to 81 g/kWh along with an increase in the SEI. The energy efficiency of naphthalene is significantly decreased from 50 to 26 g/ kWh. For the plasma reformer developed in this study, relatively high value of both tar decomposition efficiencies and energy efficiencies were achieved, compared to the existing results [11, 16].
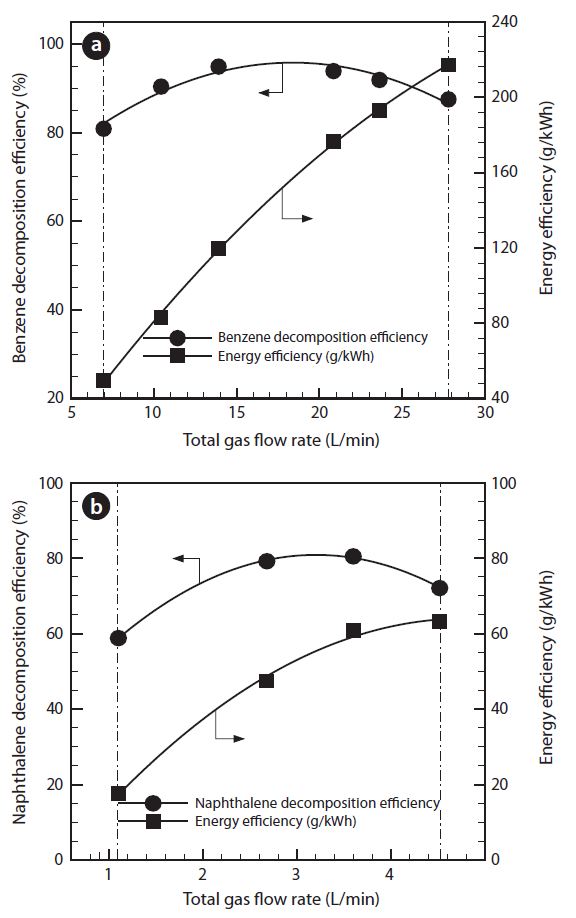
3.3. Effect of Total Feed Gas Amount
Fig. 5 shows the effect of change in total feed gas amount. The total gas amount was controlled within 7-28 L/min for benzene or within 10.5-27.6 L/min for naphthalene. The plasma discharge was generated unstably from higher than 7 L/min in benzene or 10.5 L/min in naphthalene of total feed gas amount. The tar decomposition efficiencies are increased gradually, of up to the maximum values (95% at 14 L/min of benzene or 79%
at 18.4 L/min of naphthalene). This is because the plasma discharge became stable, and the plasma zone was extended by an increasing gas amount.
However, the tar decomposition efficiency was gradually decreased with increment of total gas feed amount, after the peak points. This is related to the reduction of residence time at the discharging area from the increased gas flow rate. Generally, increase in total gas amount causes a decrease in the tar decomposition efficiencies, regardless of the chemical structure. It is corresponded to the reduced collision of radical electron and reaction ion, due to the short period of interaction time and contact between the plasma discharging area and tars [17]. Energy efficiencies are significantly increased with the total gas feed amount. The energy efficiencies increase, even though the tars decomposition in the reformer decrease after the peak points. It is because the total gas flow rate in Eq. (2) increase, showing higher effectiveness than the decrease of the tar decomposition.
3.4. Effect of Input Tar Concentration
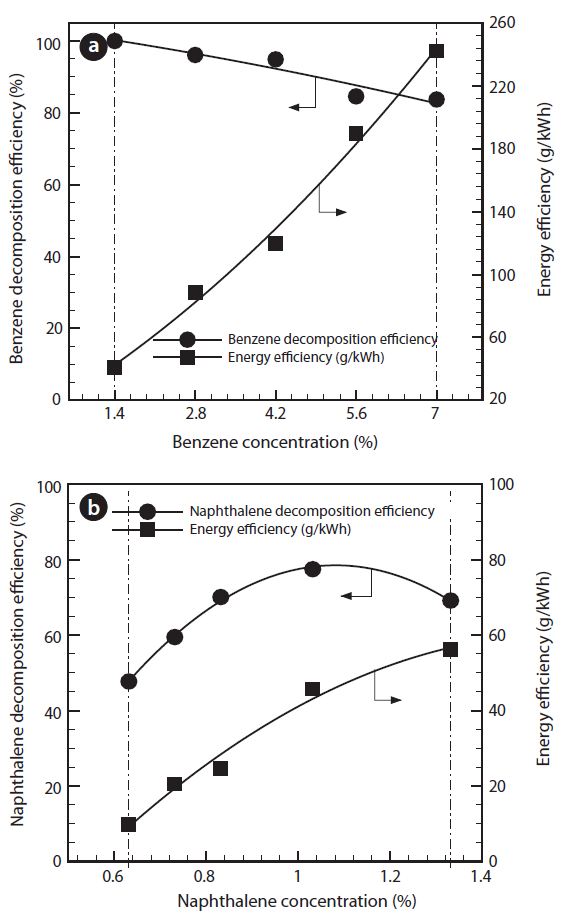
Fig. 6 shows the effect of change in its initial tar concentrations for benzene or naphthalene. The input tar concentrations varied from 1.4% to 7.0% for benzene, or from 0.6% to 1.3% for naphthalene. Benzene decomposition efficiency is gradually decreased with increasing input benzene concentration. The reason is that amount of benzene to be decomposed by the plasma discharge at the same SEI should be increased. In general, low input concentration shows higher decomposition efficiency compared to the higher one [11].
But when the input naphthalene concentration was low (up to 1%), plasma discharge was made intermittently. Gradual increase in the input concentration ensures the higher naphthalene decomposition efficiency, due to being a better plasma discharge state. Regarding the energy efficiency, an increase in the tar concentrations show the significant increase in the actual processed gas amount because S/C ratio is fixed to 2, constantly. Therefore, energy efficiency is increased from 41 to 242 g/kWh for benzene or from 12 to 58 g/kWh for naphthalene.
A gliding arc plasma reformer for the tar decomposition, among pyrolysis product gas from sewage sludge, was developed. For this purpose, tar compounds were tested, according to the operating conditions. Optimum case was chosen from the condition (Table 1), which has the maximum value of tar decomposition efficiency and energy efficiency. The benzene decomposition and energy efficiencies were 95% and 120 g/kWh, respectively. The naphthalene decomposition and energy efficiencies were 79% and 68 g/kWh.
As parametric experiments, steam feed amount, input discharge power, total feed gas amount, input tar concentrations were set as variables, and the following results were achieved: 1) Steam feed amounts in both the benzene and naphthalene tars had maximum values in the decomposition efficiency and energy efficiency at the specific S/C ratio; 2) Increment of the input discharge power exhibited a gradual increase in the decomposition efficiency and a decrease in the energy efficiency; 3) Total feed gas amount, at a specific point, showed the maximum decomposition efficiency; and the energy efficiency was significantly increased along with the total gas amount; and 4) Benzene decomposition efficiency was increased slightly with an increasing input benzene concentration. But naphthalene decomposition efficiency was increased, gradually. Energy efficiencies in both tars were significantly increased.