The issues surrounding water are expected to grow worse in the coming decades with water scarcity occurring globally. Due to rapid industrialization there is a tremendous increase in the use of heavy metals over the past few decades. Despite of the usefulness of metals, they can be very harmful to humans and the environment if they are present in excess due to their toxic nature. ‘Heavy metal’ is a general collective term applying to the group of metals and metalloids with an atomic density greater than 6 g/cm3 [1]. Heavy metals such as Cd, Cr, Cu, Hg, Ni, Pb, and Zn are commonly associated with pollution and toxicity problems. Heavy metals are toxic, carcinogenic, mutagenic and often teratogenic [2].
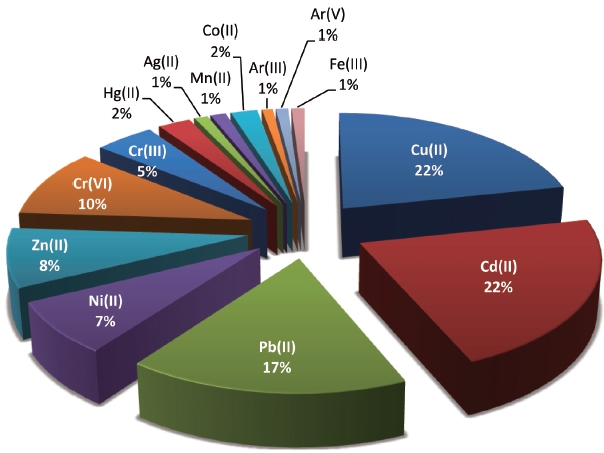
In view of the aforesaid problems, much attention has been focused on the development of adsorbents from various types of biomaterials for the removal of metals from water and wastewater [3-5]. Considerable success has been achieved in the development of biosorbents for the removal of a wide variety of metal ions from aqueous solutions. Recently, Volesky [6] has shared his views concerning the biosorption of metal ions from aqueous solution in his review. In his view, ‘biosorption of metals’ is only the ‘tip of the ice-berg’ and in the future, it will be useful for purification and recovery of other valuable materials like proteins, steroids and drugs that cost thousands of dollars per gram. Biosorption is a physico-chemical process and includes mechanisms such as absorption, adsorption, ion exchange, surface complexation and precipitation [7]. Survey of the literature by ISI Web of Science [Topic = (biosorption) AND Topic = (Iron(III)), Refined by: Document type = (ARTICLE OR REVIEW), Timespan = 2001?2010. Databases = SCI-EXPANDED] further revealed that the most widely studied metal ions through biosorption are divalent cadmium, copper, lead, zinc, and nickel followed by hexavalent and trivalent chromium (Fig. 1). In view of this we have carried a study related to biosorption cadmium and copper ions from aqueous solution using a low-cost agricultural waste
glucose group (making a sulfated ketoxime) via a sulfur atom and to a sulfate group via a nitrogen atom. These functional groups containing sulfur and nitrogen are good metal sequesters from the aqueous solution. Due to the composition of
In the present study, a simple and economic preparation of the biosorbent was performed and biosorption experiments have been conducted in order to determine the metal biosorption mechanism. The influence of pH, time, biosorbent dosage, and initial concentration were discussed in detail. The data from the experiments were fitted with different kinetic models to identify the adsorption mechanism. The results would contribute to a better understanding of biosorption and aid in the development of potential biosorption, which possess almost complete removal efficiency for Cd(II) and Cu(II) from an aqueous environment using
The functional groups present in MOB were analyzed by Thermo Nicolet IR-200 (Waltham, NC, USA) Fourier transform infrared spectroscopy (FTIR), using potassium bromide discs. Vario EL (Elementar, Hanau, Germany) was used for elemental analysis of the MOB. An atomic absorption spectrophotometer (AAS) (Model AA 6300; Shimadzu, Tokyo, Japan) was used for determination of Cd(II) and Cu(II) before and after biosorption.
The biosorption tests were performed by the batch technique in a single system using stoppered conical flasks on a temperature- controlled water bath shaker set at 200 rpm and maintained at the desired temperature. After the prescribed contact time, the solutions were filtered through Whatman filter paper No. 41 and the concentration of metal in the filtrate was measured using AAS. The extent of biosorption was calculated as follows.
The percentage of removal and the amount of metal ion sorbed onto the MOB were calculated according to the following equations:
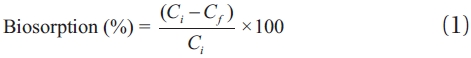
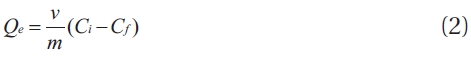
Where C
3.1. Characterization of the Biosorbent
From elemental analysis results it was identified that MOB is composed of 44.8 ± 1.50% carbon, 5.9 ± 0.18% hydrogen, 0.8 ± 0.01% nitrogen, 0.9 ± 0.01% sulphur and 47.6 ± 1.82% oxygen. Sulphur groups, which are soft bases, have chemical affinity towards metal ions and the presence of sulphur in MOB qualifies it as a potential biosorbent.
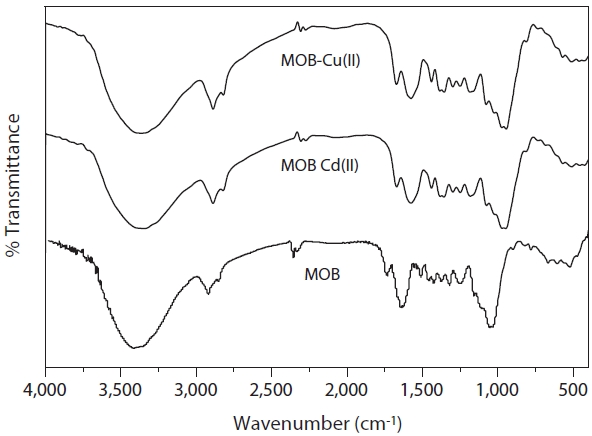
The FTIR spectrum of MOB revealed the presence of many functional groups, indicating the complex nature of MOB bio-
sorbent (Fig. 3). A strong band at 3,418 cm-1 indicated the presence of hydroxyl groups. A peak at 2,920 cm-1 observed is due to the C-H stretching frequency and the peak at 1,644 cm-1 is due to the C = O stretching mode of the primary and secondary amides (NH2CO). The peaks at 1,510 cm-1 and 1,375 cm-1 are indicative of the N-H stretching regarding the primary and secondary amides, and the presence of amide (III) or sulfamide band, respectively. Bands at 1,320 and 1246 cm-1 indicate the presence of carboxylic acids [9].Weak bands at 1,462 and 1,510 cm-1 are attributed to aromatic C = C and two sharp peaks at 1,733 and 1,644 cm-1 are characteristic of carbonyl group stretching. The strong C-O band at 1,054 cm-1 confirms the lignin structure of the MOB [10].
In addition to the FTIR characterization of the functional groups in the pure biomass MOB, the technique was used to determine the functional groups that are involved in the binding of the metals onto the biomass in biosorption process of metals. The infrared spectra of the biomass loaded with Cd(II) and Cu(II) shown in Fig. 3. The asymmetrical stretching vibration at 3,418 cm-1 for the pure biomass was shifted to the lower region 3,361?3,380 cm-1 in the FTIR spectra of MOB loaded with Cd(II) and Cu(II). The absorption peak at 1,732 cm-1 of MOB is slightly shifted to a higher wave number of 1,733?1,732 cm-1 on Cd(II), and Cu(II) adsorption as reported in earlier studies. The FTIR spectrum of metal loaded MOB shows a shift in the C-O absorption peak of MOB from 1,054 cm-1 to 1,025?1,035 cm-1 indicating the involvement of the C-O functional group in the binding of Cd(II) and Cu(II). The variation in intensity and shift in asymmetrical stretching frequencies at 3,418, 1,732, 1,644, and 1,054 cm?1 of MOB on biosorption was presumably due to the coordination of the Cd(II) and Cu(II) ions with hydroxyl, carboxyl, and carbonyl groups present on the surface of MOB.
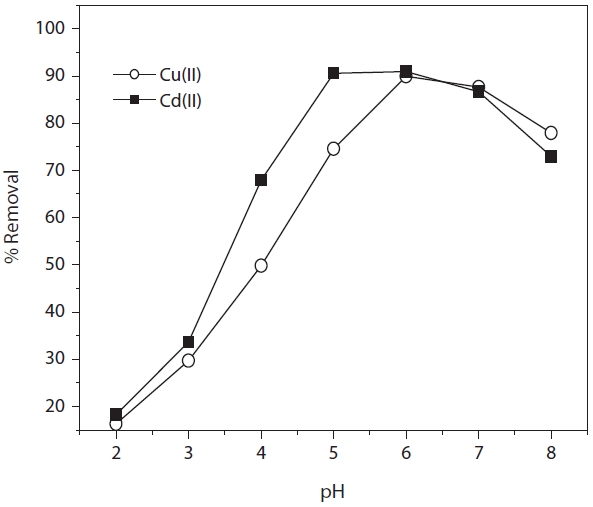
The effect of pH on metal biosorption has been studied by many researchers, and the results indicated that the pH values of the solution could significantly influence biosorption [11, 12]. The pH level affects the network of negative charge on the surface of the biosorbent cell walls, as well as the physic-chemistry and hydrolysis of the metal. Therefore, preliminary experiments have been performed in order to find out the optimum pH for
maximizing the metal removal by varying pH 2?8 (Fig. 4). It has been observed that under highly acidic conditions (pH ? 2.0) the amount of metal removal was very small. The lower removal efficiency at low pH is apparently due to the presence of a higher concentration of H+ in the solution, which competes with metal ions for the adsorption sites of the MOB. A trend of increasing metal ion binding with increasing pH from 3.0 to 6.0 could be observed for all metal ions. The results revealed that the optimum biosorption pH values for Cd(II) and Cu(II) onto MOB were 5.0 and 6.0. After pH 6.0, a decrease biosorption of Cd(II) ions was observed. It suggests that the binding strength of Cd(II) on biomass seems to be weaker than that of Cu(II) at higher pH since the biosorption of Cd(II) was less than Cu(II). Besides, with the rise in pH, fewer H+ ions exist, and consequently, Cd(II) ions have a better chance to bind to free binding sites. Later, when the pH enters basic conditions (Eqs. 3-5), the formation of Cd(OH)3― takes place due to the dissolution of Cd(OH)2 and as a result, the adsorption rate decreases.


Another explanation for metal ion removal has been provided when considering the point of zero charge (PZC) regarding MOB. The PZC of biosorbent was determined according to the procedure described in another study [13]. At a pH below 4.2 ± 0.67 (PZC), the surface of MOB was positively charged due to protonation. This protonation effect was more pronounced at lower pH values due to the presence of a higher concentration of H+ ions in the solution, which is unfavorable for biosorption. At the optimum pH values (pH 5.0 and 6.0) the surface of the MOB is negatively charged and favorable to the biosorption of Cd(II) and Cu(II) ions. Decreased biosorption at higher pH (pH > 6) was due to the formation of soluble hydroxylated complexes of the metal ions and their competition with the active sites, and as a consequence, the retention decreased further.
3.3. Effect of Biosorbent Dose
Biosorption of Cd(II) and Cu(II) onto MOB was studied by changing the quantity of sorbent from 0.1 to 0.8 g in the test solution while maintaining the initial concentration 50 mg/L, pH 6 and contact time of 2 hr constant. Obviously, the biosorption efficiency increased as the sorbent dose increased, but it remained almost constant when the sorbent dose reached 0.4 g, the maximum removal observed is >90% respectively for Cd(II) and Cu(II) ions. This may be explained by the following analysis. When sorbent dose is minimal, the active sites for binding metal ions on the adsorbent surface is decreased, so the adsorption efficiency is low; when the biosorbent dose increased, more metal ions were adsorbed. Thus, it resulted in the increment of adsorption efficiency until saturation.
For practical applications, the process design, operation control, and sorption kinetics are very important. The effect of contact time on the biosorption of Cd(II) and Cu(II) onto MOB at various initial concentrations was carried out at different time intervals (5?70 min) by keeping pH and dose constant. For all metals, it is shown that sorption occurred very fast because equilibrium was reached within 30 min. The majority of cations were removed within the first 20 min of contact time with the biosorbent. After a very rapid biosorption, the biosorption rates for all metals slowly declined. Initially, the biosorption sites are open and the metal ions interact easily with the sites and hence a higher rate of biosorption is observed. Further, the driving force for biosorption the concentration difference between the bulk solution and the solid-liquid interface is initially higher and this resulted in a faster biosorption rate. However, after the initial period, a decrease in biosorption may be due to the slower diffusion of solute into the interior of the biosorbent [14]. Despite the same experimental conditions used, it is interesting to note that the fixation capacities were different according to the metal sorbed. Also, the equilibrium times were slightly different among the metals. Quantitatively, more Cd(II) ions were adsorbed than Cu(II).
In order to further investigate the biosorption mechanism of
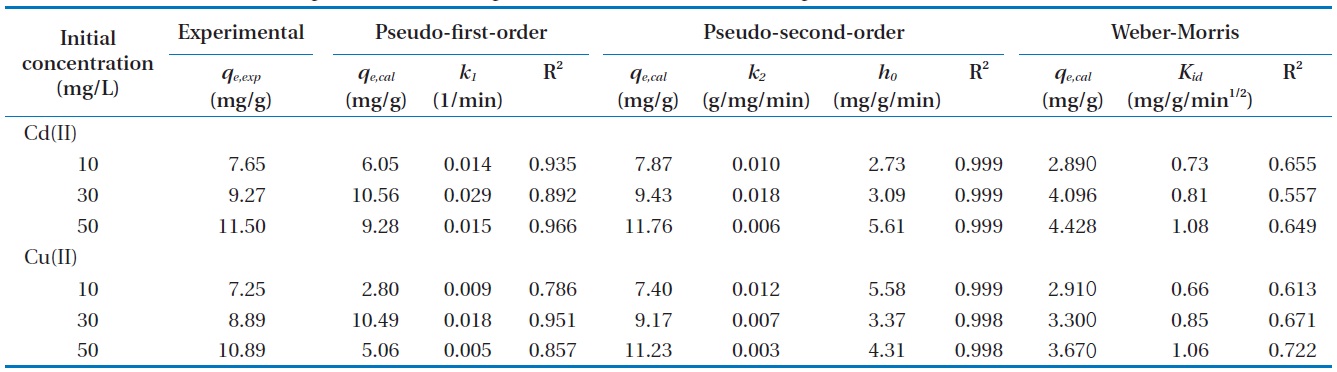
Parameters constants of pseudo-first-order, pseudo-second-order, and intra-particle diffusion models
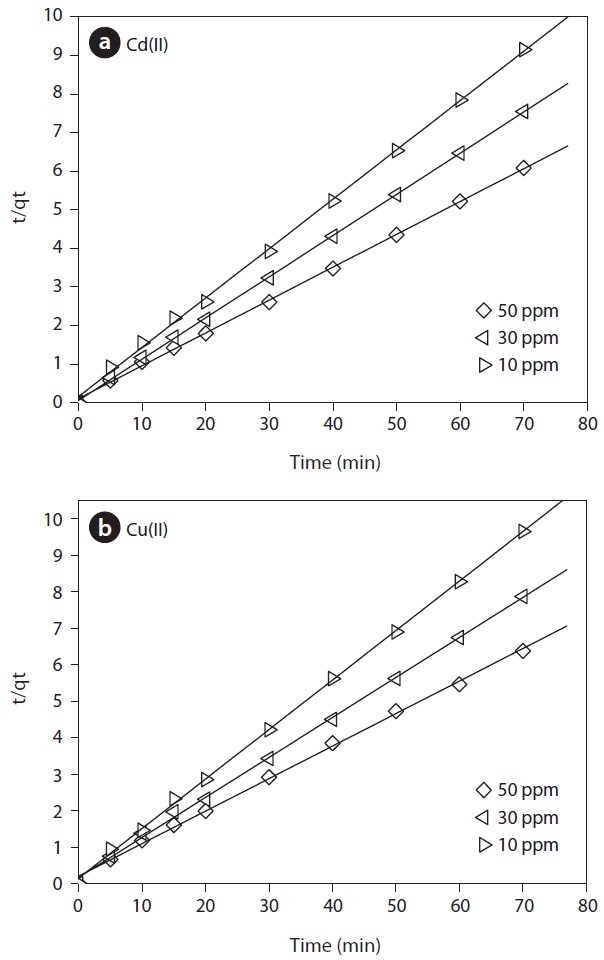
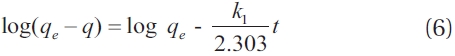
Cd(II) and Cu(II) ions onto MOB and the rate-controlling steps, a kinetic investigation was conducted, pseudo-first, pseudo-second- order and intra-particle diffusion kinetic models have been used for testing the experimental data. The pseudo-first-order kinetic model was proposed by Lagergren [15]. The integral form of the model was generally expressed as follows:
where,
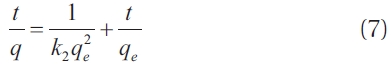
The pseudo-second-order kinetic model, proposed by Ho and McKay [16] is based on the assumption that the adsorption follows second-order chemisorption. The linear form can be written as:
where,
An empirically found functional relationship, common to most adsorption processes, is that the uptake varies almost proportionally with
where
For the Lagergren’s first-order kinetic model [15], a plot of log (
theoretical values (
The pseudo-second-order model was developed based on the assumption that the rate limiting step may be chemisorption promoted by either valence forces, through sharing of electrons between the biosorbent and sorbate, or covalent forces, through the exchange of electrons between the parties involved [16]. A plot of “
The comparison of experimental adsorption capacities and the theoretical values estimated from the first- and second-order equation are presented in Table 1. The Lagergren’s model did not provide sufficient information to explain the experimental kinetic data. Whereas, the theoretical
An empirically found functional relationship, common to most adsorption processes, is that the uptake varies almost proportionally with
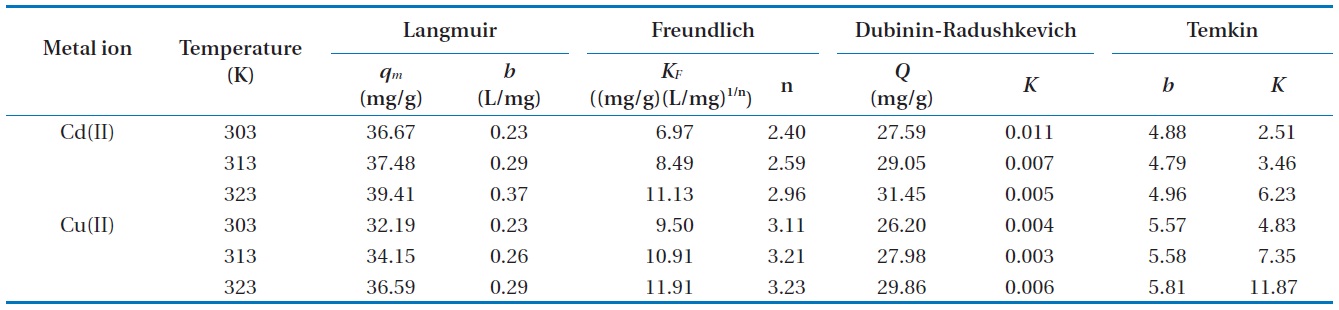
The successful representation of the dynamic adsorptive separation of the solute from solution onto an adsorbent depends upon an appropriate description of the equilibrium separation between two phases [19]. In order to determine the mechanism of Cd(II) and Cu(II) ions biosorption onto MOB and to evaluate the relationship between biosorption temperatures, the experimental data was applied to the two-parameter non-linear isotherm models, i.e., Langmuir, Freundlich, Dubinin-Radushkevich (D-R), and Temkin models by the nonlinear estimation method in the Origin 7.0® software (MicroCal, Northampton, MA, USA).
The Langmuir isotherm [20] equation can be written in the following form:
where parameters
The essential features of the Langmuir biosorption isotherm can be expressed in terms of a dimensionless constant separation factor (
where
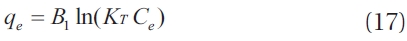
Freundlich isotherm is an empirical equation. This equation is among one of the most widely used isotherms for the description of adsorption equilibrium. Freundlich isotherm is capable of describing the adsorption of organic and inorganic compounds on a wide variety of adsorbents including biosorbent [22]. This equation has the following form

As a robust equation, Freundlich isotherm has the ability to fit nearly all experimental biosorption-desorption data, and is especially excellent for fitting data from highly heterogeneous sorbent systems. Accordingly, this isotherm can adequately represent the biosorption isotherm for most of the systems studied. The 1/n values were between 0 and 1 indicating favorable biosorption of Cd(II) and Cu(II) onto
Dubinin and his co-workers conceived this equation for subcritical vapors in micropore solids where the adsorption process follows a pore-filling mechanism onto an energetically nonuniform surface [23]. The Dubinin-Radushkevich (D-R) model, which does not assume a homogeneous surface or a constant biosorption potential as the Langmuir model, was also used to test the experimental data.
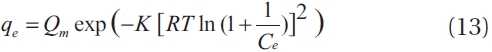
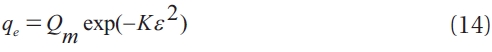
Where

Isotherm parameter constants for Cd(II) and Cu(II) biosorption onto Moringa oleifera bark at different temperatures
At first, the Temkin equation was proposed to describe the adsorption of hydrogen on platinum electrodes within acidic solutions. The Temkin isotherm [24] assumes that the heat of adsorption for all the molecules in the layer decreases linearly with coverage due to adsorbent-adsorbate interactions, and that the adsorption is characterized by a uniform distribution of the binding energies, up to some maximum binding energy [25].
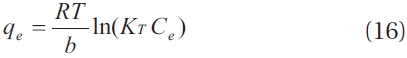
Where constant
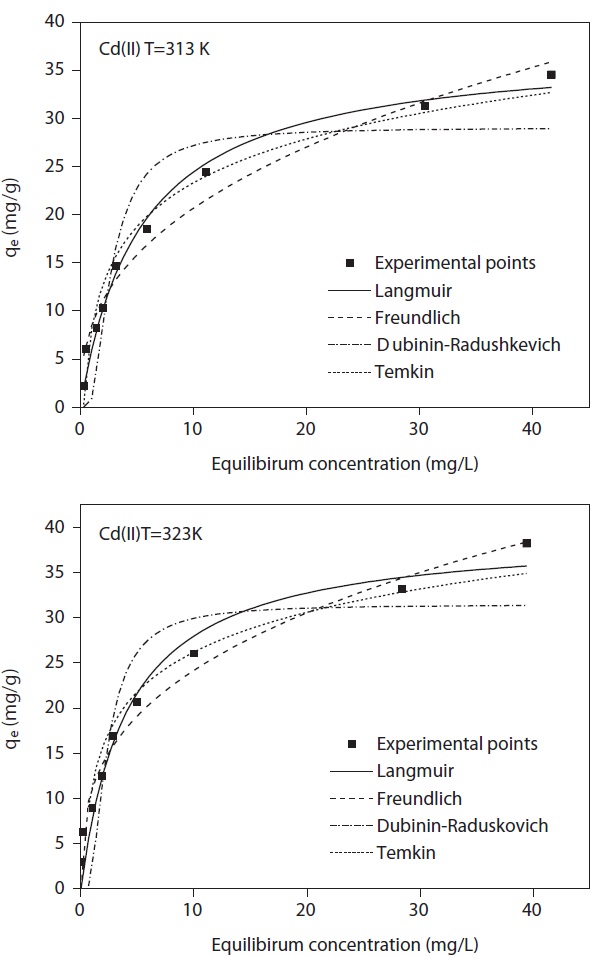
A model isotherm graph for the biosorption of Cd(II) at 313 and 323 K is shown in Fig. 6. The Langmuir adsorption constants calculated from the corresponding isotherms with the correlation coefficients are presented in Table 2. The maximum theoretical adsorption capacities of Cd(II) and Cu(II) calculated from Langmuir equation are 39.41 and 36.59 mg/g biosorbent, respectively at 323 K. Comparisons between the correlation coefficients and the chi-square square values of four isotherm models it was observed that equilibrium data was well represented by the Langmuir isotherm model. The conformity of the biosorption data to the Langmuir isotherm could be interpreted as an indication of a homogeny adsorption process, leading to monolayer binding. Based on the effect of the separation factor,
The constants for the Freundlich models,
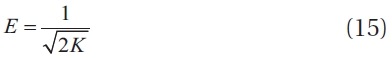
The equilibrium biosorption data was also fitted with the D-R isotherm expression, however the correlation coefficients were found to be lower than that of the Langmuir model. The mean free energy of biosorption (
biosorption process takes place physically. In the present study, the value of
Temkin isotherm constants are given in Table 2.
The chi-square (
[Table 3.] Chi-square and correlation coefficient for isotherms at different temperatures
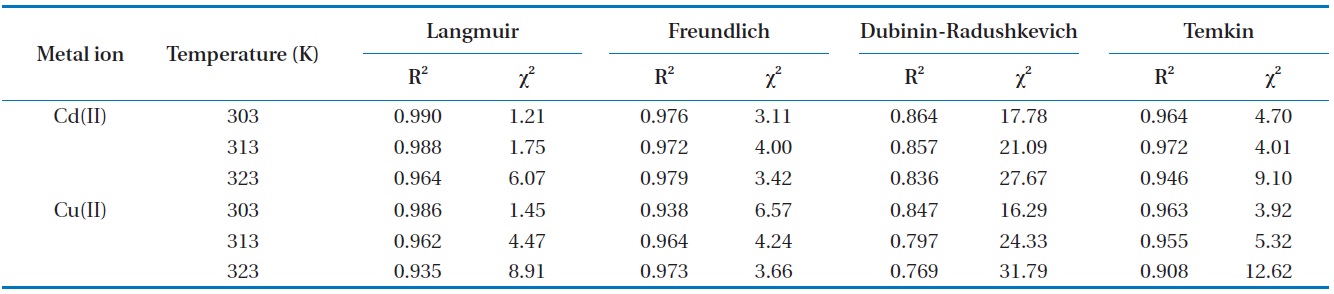
Chi-square and correlation coefficient for isotherms at different temperatures
evaluating the best fit model is to be evolved as:
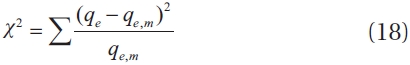
where
The high values of correlation coefficient and low chi-square values demonstrate equilibrium data was well fitted to Langmuir isotherm model comparing with other isotherm models (Table 3). This suggests the applicability of the monolayer coverage for Cd(II) and Cu(II) ions on the MOB surface. Furthermore, from Table 2 it was observed that the maximum adsorption capacity increases as the process temperature rises, which means that an increase in energy favors the biosorption onto the MOB surface. This behavior indicates an enthalpy variation during positive biosorption or the endothermic process. However, this behavior is inverted in Henry’s infinite dilution region, that is, at very low concentrations (up to 10 ppm).
3.7. Biosorption Thermodynamics
Based on the fundamental thermodynamic concept, it is assumed that in an isolated system, energy cannot be gained or lost and the entropy change is the only driving force. In environmental engineering practice, both energy and entropy factors must be considered in order to determine which process will occur spontaneously.
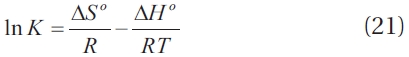
In this research, the thermodynamic parameters, such as standard Gibbs free energy G° (kJ/mol), the standard enthalpy (ΔH°), and the standard entropy (ΔS°) for the biosorption of Cd(II) and Cu(II) onto MOB were calculated using the following equation,

where

Eq. (20) can be written as:
The Gibbs free energy, which changes for the biosorption process are presented in Table 4 and the results demonstrate that
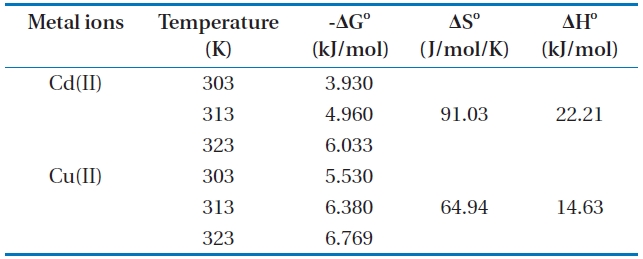
Thermodynamic data for the biosorption of Cd(II) and Cu(II) ions onto Moringa oleifera bark at different temperatures
the change in Gibbs free energy values is negative. The negative ΔG° values of Cd(II) and Cu(II) at various temperatures indicated that the biosorption process is spontaneous, and the values of ΔG° (Table 4) decreased with an increase in temperature, indicating the spontaneous nature of biosorption for Cd(II) and Cu(II). The value of ΔH° is positive, indicating the endothermic nature of the biosorption for Cd(II) and Cu(II) onto MOB. In addition, the positive values of ΔS° shows an affinity of biosorbent and the increasing randomness at the solid-solution interface during the biosorption of Cd(II) and Cu(II) on the bark.
The present study demonstrated that MOB is an effective biosorbent for the removal of Cd(II) and Cu(II) ions from aqueous solutions by adsorption. The uptake of metal ions by MOB seemed to be quite rapid and the experimental data obeyed the pseudo-second-order model well. Also, the equilibrium data fit well to the Langmuir isotherm model. Based on the obtained results, it is believed that the application of the biosorption process using MOB for the purification of industrial waste water containing Cd(II) and Cu(II) ions can be achieved in a bioreactor design or large-scale batch biosorption systems.