In many wastewater treatment plants, large variations in the flow and concentration of wastewater are commonly observed. In the event of a sudden accident, and during the maintenance and inspection of the plant, the operations have to be stopped for varying periods. The flow of wastewater from tourist regions, racetracks, schools, abattoirs, and fish-processing industries to treatment plants is completely halted during low-activity periods [1-3]. The complete interruption of wastewater flow to treatment plants can last for days or even weeks. In such cases, the microorganisms performing the biological treatment of the wastewater are exposed to starvation conditions. Under these conditions, the biological activity and sludge settling properties could be severely affected.
Many researchers have investigated the effects of starvation on bacterial population and activity [2-6]. However, the effects of starvation on the physical characteristics of floc, which plays an important role in determining the solid-liquid separation efficiency of the biological wastewater treatment process, remains poorly understood. In particular, the effect of starvation on the performance of sequencing batch reactor (SBR) when treating saline wastewater has not been widely reported. Maintaining different sludge conditions during starvation periods lead to changes in bacteria. Their adaptation to starvation conditions affects recovery time, which is related to the biological activity and settleability of the sludge diversity [7, 8]. Monitoring the physical characteristics of sludge, such as floc size, fractal dimension, and sludge volume index (SVI), and the biological activity of sludge along with its pollutant removal efficiency under different starvation conditions could provide insights into the relationship between the strategy of sludge maintenance and the process performance.
Therefore, it is important to investigate the effect of aerobic and non-aerobic sludge starvation conditions on floc characteristics like SVI, floc size, fractal dimension, and removal efficiency for chemical oxygen demand (COD)Mn and total phosphorous (TP) during recovery periods when testing saline wastewater in SBR. The objective of this study was to evaluate the recovery behavior regarding the physical characteristics of sludge floc and the pollutants removal efficiencies for the aerobic and non-aerobic starvation condition.
2.1. Experimental Set-Up and Operation Mode
Two laboratory-scale SBRs (10 L) were operated in parallel using artificial saline wastewater. Synthetic saline wastewater was prepared using fish meal, and its detailed composition can be found elsewhere [9]. The synthetic saline wastewater contained 1,000?1,200 mg/L of CODCr, 500?600 mg/L of CODMn, 250?300 mg/L of total nitrogen (TN), 15?20 mg/L of TP, and 10,000 mg/L of salinity in the form of NaCl. SBRs were operated at 2 cycles per day. Each cycle consisted of 5-min filling, 5.5-hr anaerobic mixing, and 5.5-hr. aerobic mixing, 50-min settling, and 5-min decanting. In each cycle, 5 L of supernatant was drawn by decantation, and constant mixed liquor was wasted at the end of the aerobic period in order to have a sludge age of 10 days. The average mixed liquor suspended solids (MLSS) concentration was 3,500-4,000 mg/L over the entire period. The food to microorganism (F/M) ratio was 0.34 kg CODCr/kg MLSS/day or 0.17 kg CODMn/kg MLSS/day.
Starvation tests were performed after the SBRs reached steady-state operation, as indicated by the stable MLSS concentration and pollutant removal efficiency. After the SBRs reached steady-state conditions (70 days of run), the supply of artificial saline wastewater was stopped for 5 days. During the 5-day starvation period, the sludge was maintained under an aeration condition (SBR#1) or non-aeration condition (SBR#2), which was analogous to the anoxic environment with only idle. Following starvation, normal operation was resumed by feeding 100% of the artificial wastewater.
The chemical analysis of the samples was carried out according to the Korean Standard Method (2002) [10], except for CODMn. Since the Korean government regulates CODMn instead of CODCr, CODMn was analyzed in this study. To analyze CODMn, sufficient AgSO4 was added to the samples in order to eliminate chloride interference. A diffraction particle sizer (Mastersize/E model; Malvern Instruments, Malvern, UK) was used to measure size and fractal dimension. The fractal dimension (Df) was calculated from the raw light-scattering data using the method proposed by Guan et al. [11]. This method was reported to rapidly determine the fractal dimension of biological wastewater floc without disruption. The fractal dimension ranges from 1 to 3; this high value is related to the compact and dense flocs.
3.1. Effect of Starvation on Floc Size, Fractal Dimension
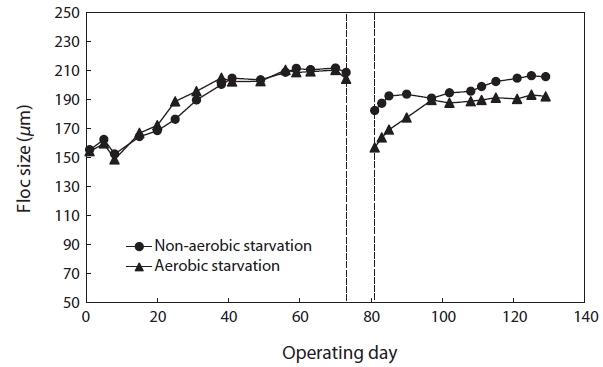
Fig. 1 shows the changes in floc size with time after 5 days of aerobic and non-aerobic starvation. After the starvation, the floc size decreased from 208.12 to 156.88 μm under aerobic starvation, and from 210.54 to 182.38 μm under non-aerobic starvation. After wastewater feeding resumed, the floc size gradually increased. Following non-aerobic starvation, the floc size reached its initial value within 40 days. However, after aerobic starvation the floc size increased to only approximately 190.00 μm after 40 days and did not increase further.
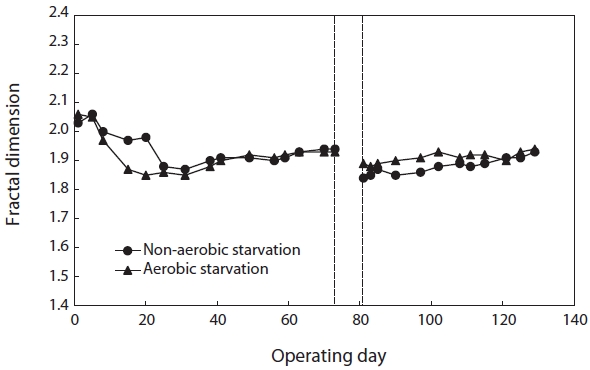
The morphological changes in the floc were observed by
monitoring the fractal dimension of the floc during the SBR operation. Fig. 2 illustrates the effect of starvation on the fractal dimension. It decreased from 1.93 to 1.89 under aerobic starvation, showing little change, but a lot of change from 1.93 to 1.84 under non-aerobic starvation. Examination of the results shows that the fractal dimension of the floc under non-aerobic starvation increased faster than under aerobic starvation after wastewater feeding was resumed.
3.2. Effect of Starvation on SVI
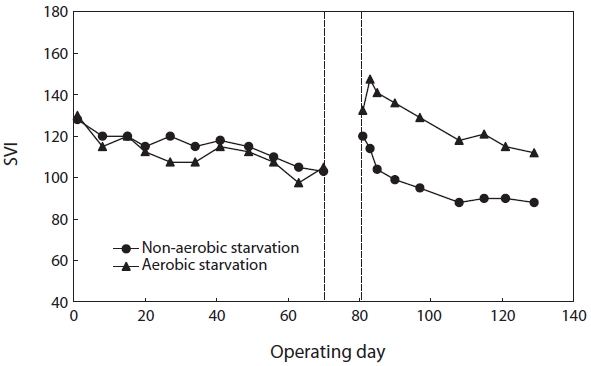
The values of SVI right before the onset of starvation were roughly 105 (SBR#1) and 103 (SBR#2). Fig. 3 shows the effect of aerobic/non-aerobic starvation on sludge settleability. After both aerobic and non-aerobic starvation, when wastewater feeding resumed, the SVI increased resulting in the deterioration of sludge settleability. The SVI value of SBR#1 after aerobic starvation was higher (133) than that of SBR#2 after non-aerobic starvation (120). After the resumption of wastewater feeding, the SVI gradually decreased. It improved faster after non-aerobic starvation than after aerobic starvation. After non-aerobic starvation the SVI reached its initial value within 5?10 days but under aerobic starvation it did not return to its initial value even after 40 days.
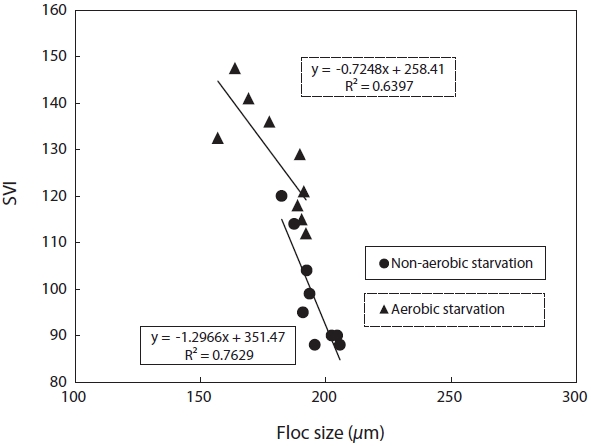
3.3. Relation between Parameters
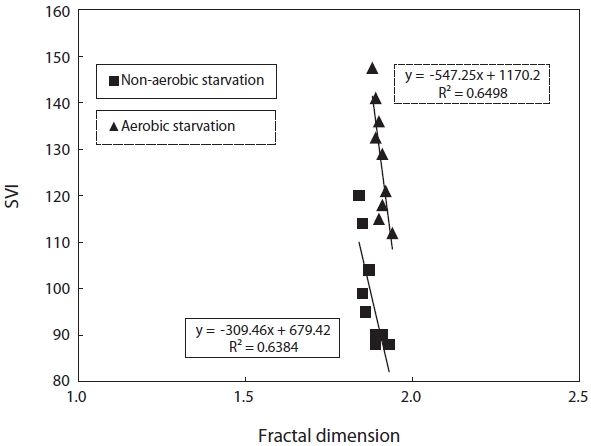
SVI as a function against floc size and fractal dimension was investigated. SVI was linearly proportional to these independent variables as shown in Figs. 4 and 5. The SVI increased as floc size and fractal dimension decreased. In addition, the settleablility factor was negatively related to floc size and fractal dimension. The coefficient (R2) of correlation between SVI and floc was 0.64 under aerobic and 0.76 under non-aerobic starvations, that of SVI against fractal dimension was 0.65 and 0.64.
3.4. Effect of Starvation on Recovery of Removal Efficiency
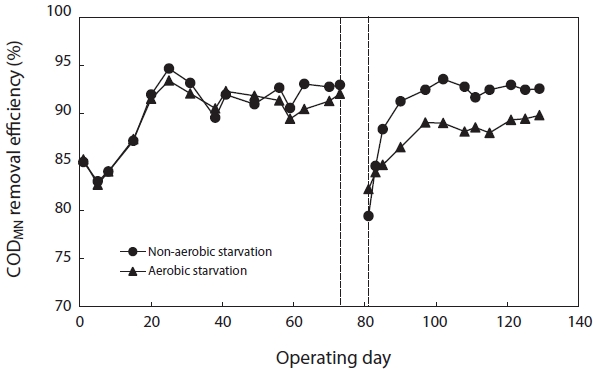
Fig. 6 shows the variation in CODMn removal efficiency before and after starvation. To reach a steady state, more than 30 days of operation, corresponding to 3 times of the solids retention time (SRT), were required. The SBRs were operated at steady-state conditions for over two months before the commencement of the starvation studies. They achieved greater than 90% CODMn removal after reaching the steady state. After 5 days of aerobic and non-aerobic starvation, the removal efficiency of CODMn decreased from 92.1% to 82.2% and from 93.0% to 79.4%, respectively. After resuming the normal operation with 100% of the substrate load, the CODMn removal gradually improved. For nonaerobic starvation, it took about 30 days to return to its initial level. For aerobic starvation, it did not return to its initial level in 30 days.
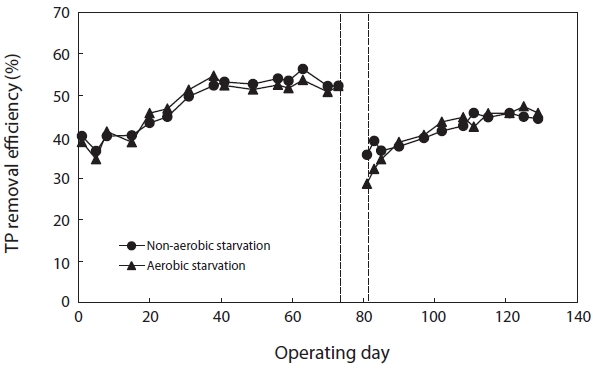
Fig. 7 shows the variation in TP removal efficiency before and after starvation. The TP removal efficiency after aerobic and non-aerobic starvation dropped from 52.2% to 28.6% and from 52.2% to 35.6%, respectively. Thus, the starvation affected the TP removal more than the COD removal. In regard to aerobic and non-aerobic starvation, it did not return to its initial level even when the operation period was longer than normal.
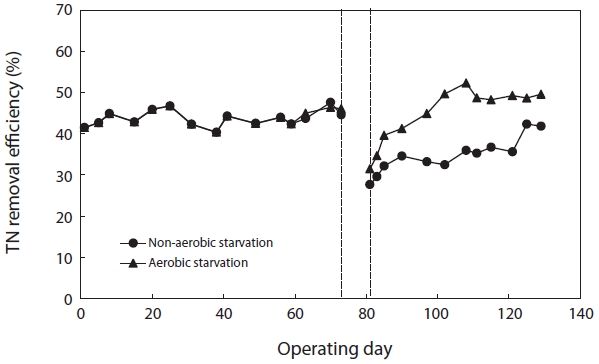
Fig. 8 shows the variation in TN removal efficiency before and after starvation. The TN removal efficiency after aerobic and non-aerobic starvation dropped from 46.1% to 31.5% and from 44.6% to 27.7%, respectively. In order to observe the response of biological sludge floc to starvation, the sludge was starved for 5 days. Both aerobic and non-aerobic starvation affected the floc size and morphology; the floc size became smaller and the morphology more irregular (Figs. 1 and 2).
The reduction in the floc size appeared to be an adaptation response and could be caused by a decrease in the attachment [12] and then floc was dispersed by reducing flocculation abilities of the bacteria, that is, called pin-floc Martins et al. [13] reported that compact bioflocs, which were subject to low substrate conditions, could alter in structure to become more open and disintegrate. As a result, the surface area of overall flocs increased although its size reduced and then biosorption of substrate on
[Fig. 6.] Removal efficiency of chemical oxygen demand (COD)Mn after aerobic/non-aerobic starvation.
flocs had easier than before starvation. The maintenance energy and the endogenous loss etc. are higher under aerobic conditions than non-aerobic conditions [14]. Therefore, the smaller floc size observed after aerobic starvation appears to be caused by the higher cell death rate, bacterial decay rate, maintenance energy, and the faster substrate depletion. Several researchers
have reported lower bacterial decay rates under non-aerobic starvation compared to under aerobic starvation. They recommended non-aerobic conditions for maintaining bacterial activity during periods without feed [3, 5, 15, 16].
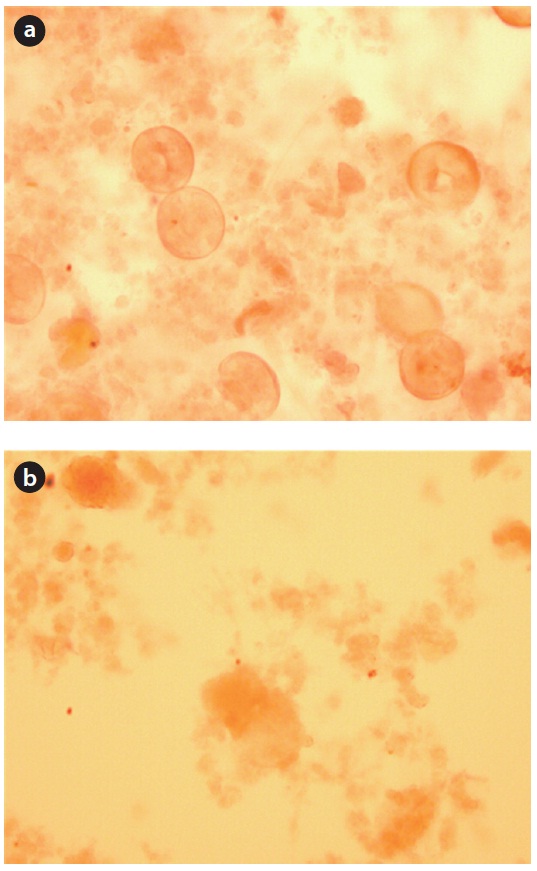
On the other hand, a different starvation condition might yield significantly different physiological responses in terms of the floc morphology. The fractal dimension of the flocs decreased as a result of biomass starvation and was lower under non-aerobic starvation than aerobic starvation. Changes in the fractal dimension indicated changes in the sludge morphology pattern. Sludge with many filamentous microorganisms might correspond to lower fractal dimension values (Fig. 9).
The relatively round pin-point flocs produced under aerobic starvation, as measured by a higher fractal dimension value, were partially caused by the shear stress force of the air provided. Aerobic starvation caused the flocculated floc to change to small, round pin-point flocs. The relatively larger and irregularly shaped flocs, as measured by a lower fractal dimension value, under non-aerobic starvation suggest that filamentous bacteria have an advantage in this situation. Under limited substrate conditions sludge having filamentous bacteria, characterized by a low fractal dimension value, have easier access to the substrate because of the high surface area. Moreover, the filaments can penetrate outside the flocs and thus are exposed to higher substrate concentrations than are non-filamentous bacteria that mainly grow within the flocs [13]. After the resumption of wastewater feeding, the bacteria from non-aerobic starvation quickly adapt
to normal conditions. It has been reported that the viability index decreases more under aerobic conditions than non-aerobic conditions [5], i.e., there is a greater reduction in active bacteria during aerobic starvation. The different microbial community composition after different starvation conditions influences the floc size, morphology, and restoration of the system. The higher organism detected under aerobic starvation might not be an advantage in initiating floc-forming and recovering sludge settleability. The aerobic starvation promoted the growth of pin-floc bacteria, whereas non-aerobic starvation triggered filamentous bacteria. Large and open flocs with low fractal dimensions containing a large number of filaments have been found to be more shear sensitive than small, round, and dense flocs [17].
For the correlation of floc size, fractal dimension, SVI, and biomass activity with the efficiency of pollutant removal, the following observations were made. Firstly, a decrease in the pollutant removal efficiency was related to a decrease in floc size and fractal dimension. Therefore, the physical characteristics of biomass monitored in this study, i.e., floc size, fractal dimension, and SVI, reflected the deterioration in the pollutant removal efficiency after starvation. It has been found that the settleability of sludge is strongly affected by the floc structure [9]. In general, large and dense flocs provide better settleability. An examination of the floc size and SVI data shows that a negative correlation exists between these two parameters (Fig. 4). There also exists a negative correlation between the fractal dimension and the SVI. This is, however, inconsistent with the results reported by Wilen and Balmer [18]. They reported that an increase in the floc size corresponded to an increase in the SVI because of the presence of filamentous microorganisms.
Floc with filamentous bacteria can lead to an irregular structure and poor settleability. In the absence of filaments, pin-floc will be formed. Govoreanu et al. [19] carried out a comparison of SVI and floc size in the SBR evolution. They suggested that the correlation between floc size and SVI was highly dependent on the type of microorganisms present in the floc structure. In general, large and dense flocs provide better settleability. The density depends on the type of microorganisms in the floc structure and may vary because of the variable accumulation of high-density microbial storage products by the biomass [5, 20]. These storage products are associated with enhanced biological phosphorus removal processes such as the anaerobic/oxic (A/O) process, and they are reported to be of greater density than the typical bacterial- cell biomass. Several researchers have reported that the decay rate of polyphosphate-accumulating organisms (PAOs) under anaerobic starvation was lower than that under aerobic starvation. These results imply that the floc produced under non-aerobic starvation had high density and therefore better settleability. Non-aerobic starvation resulted in an SVI considerably lower than that prior to starvation. Higher nutrient removal after starvation was reported by Yilmaz et al. [3]. The reasons for this are unclear so further research should be conducted.
After starvation, the efficiency of pollutant removal severely decreased. This deterioration was caused by the unsettled floc particles, the reduction in the biomass, and the damaged activity. More severe effects of starvation on TP removal were observed. A longer recovery period was needed for TP than for COD. Previous research has indicated that an imbalance between the phosphorous release and uptake caused by the decay of the active biomass and of the storage products led to a more severe deterioration in TP removal efficiency during aerobic starvation than during non-aerobic starvation [5, 21]. In addition, PAO has been reported to be more sensitive than carbon bacteria to salinity [22]. This might imply that PAO is more susceptible to starvation than carbon bacteria when treating saline wastewater.
After 5 days of starvation, more than 40 days (4 times the SRT) of recovery are needed to return to the initial TP removal efficiency; 30 days of recovery are needed for the COD removal efficiency. Complete recovery of the TP removal efficiency could not be obtained after aerobic starvation. The recovery periods were considerably longer than those reported in the literature [2, 3]. Yilmaz et al. [3] reported that four days of recovery was sufficient for biological nutrient removal (BNR) of sludge starved under alternating anoxic/anaerobic and aerobic conditions for 43 days. However, they also reported that it took around 30 days (two sludge ages) for the MLSS to return to its original level.
Yilmaz et al. [3] reported that a resuscitation period is believed to be even more important for PAOs, because their metabolism requires the cycling of phosphorus and carbon compounds under alternating anaerobic, aerobic, or anoxic conditions. After starvation, the microbial storage products that are essential for the metabolisms of PAO are likely to be low and must be re-developed slowly.
SVI increased as floc size and fractal dimension decreased under both aerobic and non-aerobic starvation. However, the floc produced under non-aerobic starvation was larger than that produced under aerobic starvation and required less recovery time. SVI was fairly related to floc size and fractal dimension. The effects of starvation on TP removal efficiency were severe, and the recovery period was longer than that for COD. The sludge maintenance conditions during starvation clearly affect the biological wastewater treatment performance, and sludge should be maintained under non-aerobic conditions for reducing the starvation effect and enabling a quick recovery.