Polychlorinated biphenyls (PCBs) are a broad family of manmade organic chemicals known as chlorinated hydrocarbons. Overall, they are materials where a hydrogen atom bonded to the biphenyl radical (C12H10) is substituted with a chlorine atom. There are 209 congeners, which depend on the quantity and location of the substituted chlorine atom. The PCBs are characterized by strong toxicity, residual persistence, long range mobility and the accumulation in living bodies, and have been used as insulating oil in transformers, capacitors, lubricants, plasticizers and paints as they possess excellent electric insulation and chemical stability properties. However, they are also classified as carcinogens and have been reported to damage nerves, procreation and the immune system [1]. The strong toxicity and residual persistence of PCBs have been known since PCB residues in fish and eagles were reported by Jensen et al. [2] in 1969. Every country in the world, initiated by the USA in 1979, has prohibited the manufacture and use of PCBs [1]. The manufacture import and use of PCBs in Korea have been banned since 1996, with products regulated for treatment as specified wastes when they contain more than 2 ppm (over 2 mg/L in liquid state). The reason for using transformers containing PCBs in South Korea is that insulating oils produced prior to the ban still remain or are used in the new transformer or PCBs remain inside the transformer due to their absorption.
PCBs were first synthesized by Schmidt in 1881, and have been produced in Germany, UK, and Japan since their first commercial production by Monsanto Company (St. Louis, MO, USA) in 1929. The names of commercially produced PCBs differ according to their country of origin. They are called as Aroclor in USA, Phenoclor in France, Kaneclor in Japan, and Delor in Czech. The quantity of PCBs produced globally between 1930s and 1970s is uncertain, but has been estimated to be approximately 60,000?2,000,000 tons [3], with around 130 congeners usually found in commercially utilized PCB mixtures [4].
Chemical methods, such as high temperature incineration, dechlorination and hydrotreatment, are used for the degradation of PCBs, and PCBs are known to be degraded up to 99.9999% via incineration at high temperature [5]. However, toxic substances, such as polychlorinated dibenzofurans (PCDFs) and polychlorinated dibenzodioxins (PCDDs), are produced from PCBs during
the combustion process if incineration is not appropriately controlled. It has been reported that PCDFs are produced from the incineration of specified wastes containing about 1% PCBs [6].
Various harmful compounds are emitted into the air when waste oil and agrochemical wastes containing high concentrations of inter-halogen compounds, such as PCBs and aromatic compounds are not satisfactorily treated by the traditional incineration method (at atmospheric pressure, 850?1,100℃). Therefore, since the 1990s, Japan, USA, and European countries have shown interest in the development of a gasification system as a substitute for the traditional incineration system. A number of large scale plants for the gasification of coal or heavy oil residues have been established in the USA and Europe over the last 30 years [7], while in Japan a number of waste gasification processes are currently proposed (8 facilities are operated and about 100 facilities are ordered). Gasification systems have many advantages, such as the reuse of the synthetic gas generated by gasification, the prevention of dioxin formations, and the reduction of various air pollutants. Research on pressurized gasification and combustion has energetically advanced with the aim of utilizing coal more cleanly and efficiently. It has been reported that coals evolution, i.e., its devolatilization with heterogeneous reactions and the gas phase reaction, at rapid heating under high pressure differ greatly from the case of normal pressure [8]. Consequently, it is necessary to develop an innovative incineration system by introducing gasification technology for the harmless processing of non-degradable liquid wastes. The purpose of this study was to develop a commercial high temperature and pressure gasification (HTPG) system for treating PCBs in insulating oil. The insulating oil waste containing PCBs could be converted into synthetic gas, which is mainly composed of H2 and CO via gasification under the condition of a temperature higher than 1,400℃ and a maximum pressure of 4 kgf/cm2 (g). The destruction and removal efficiency (DRE) of PCBs, characteristics of gasification, and the emissions of air pollutants were studied to confirm the efficiency of the HTPG system. The effect of the equivalence ratio on the synthetic gas contents was also studied to quantify the gasification of the insulating oil containing PCBs.
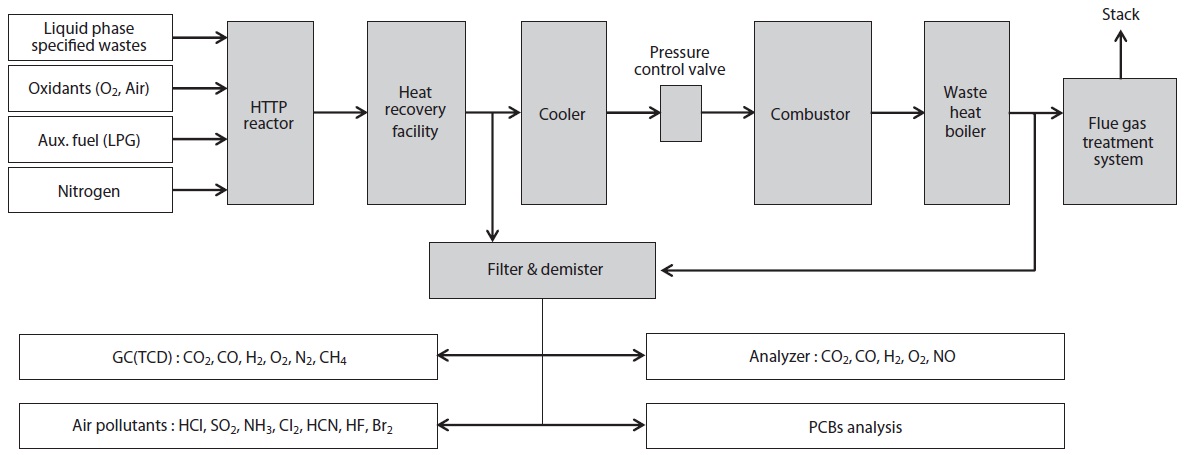
Experiments were carried out in a 3 ton/day scale HTPG pilot plant system, as shown in Fig. 1. This experimental apparatus was comprised of a feeding system for the liquid waste and associated utilities (LPG, O2, N2, air, water and electric power, etc.), an HTPG reactor, heat recovery facilities, cooling system, pressure control valve, combustor, waste heat boiler, flue gas treatment system, and an analysis system.
The temperature of the HTPG reactor was set at 1,400℃. In order to maintain this temperature prior to the main experiment, the HTPG reactor was preheated with LPG for 24 hr. Insulating oil waste containing PCBs was then injected into the reactor via an injection burner, with the oxidants (O2, air) fed using mass flow controllers. The total feeding rate of the insulating oil waste through the reactor was maintained at 20 kg/hr (residence time, 2?3 sec), with the reaction temperature and pressure varied within the ranges 1,400?1,600℃ and 0?4 kgf/cm2 (g), respectively. The operating conditions, especially the temperature and
[Table 1.] The physical properties of the LPSW and the experimental variables
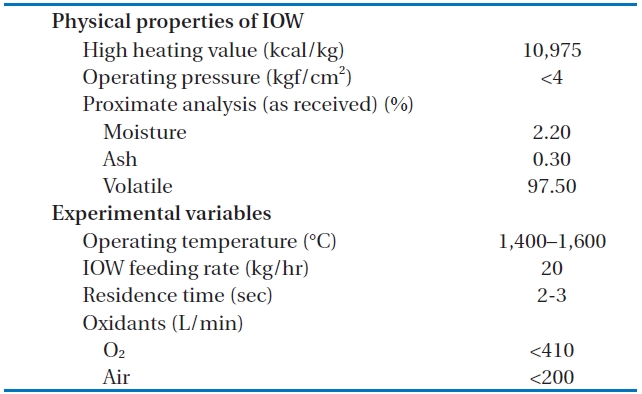
The physical properties of the LPSW and the experimental variables
pressure, in the reactor were controlled by varying the feeding rate of the insulating oil waste, oxidant flow rate, oxidant/fuel ratio, and pressure.
After the decomposition of the insulating oil waste in the HTPG reactor, the flue gas (synthetic gas) was rapidly cooled from 1,400℃ to 200℃ at the heat recovery facility. This rapid temperature reduction avoided the reformation of dioxins, furans and other organic compounds from elementary molecules in the synthetic gas due to the de novo synthetic back reactions [6]. At the cooling tower, the synthetic gas was cooled to 20℃ by spraying water through the gas to protect the equipment being used. The synthetic gas generated from the HTPG reactor was burned in the combustor, and recycled as steam by the waste heat boiler. The pollutants in flue gas were then removed via the flue gas treatment equipment. The physical properties of the insulating oil waste and the experimental variables are listed in Table 1. The insulating oil waste containing PCBs used for gasification contain 2.2% moisture, 97.50% volatile matter, and 0.30% ash, with a higher heating value (HHV) of 10,975 kcal/kg.
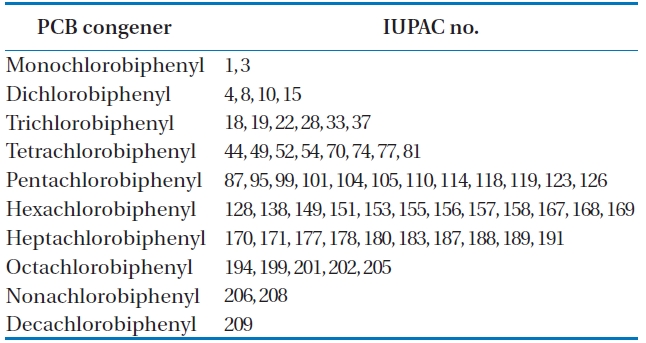
BP-MS (Wellington Laboratories Inc., Guelph, ON, Canada) was used as an internal standard, comprising of a mixture of 62 13C12-PCB congeners. The detailed lists are shown in Table 2.
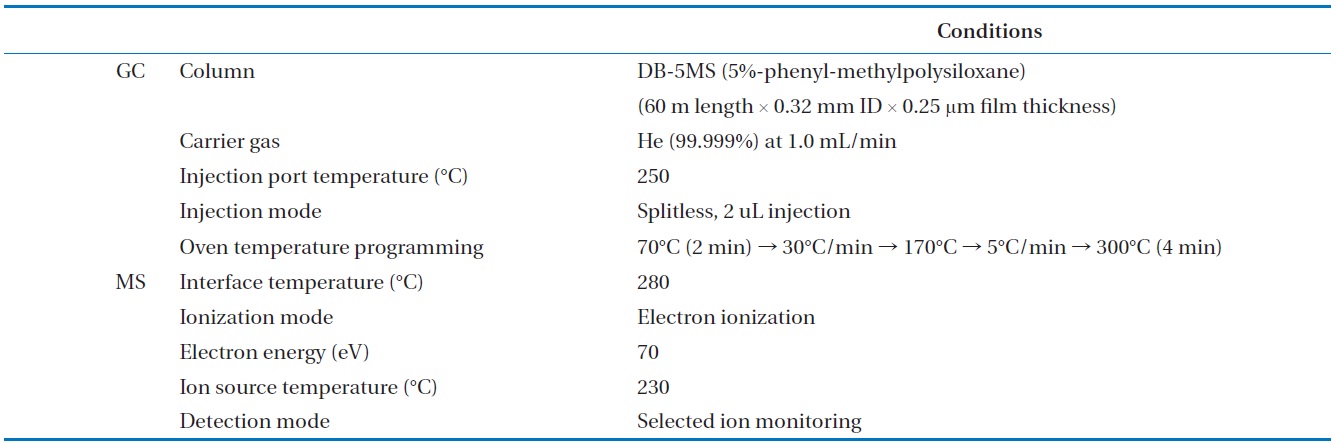
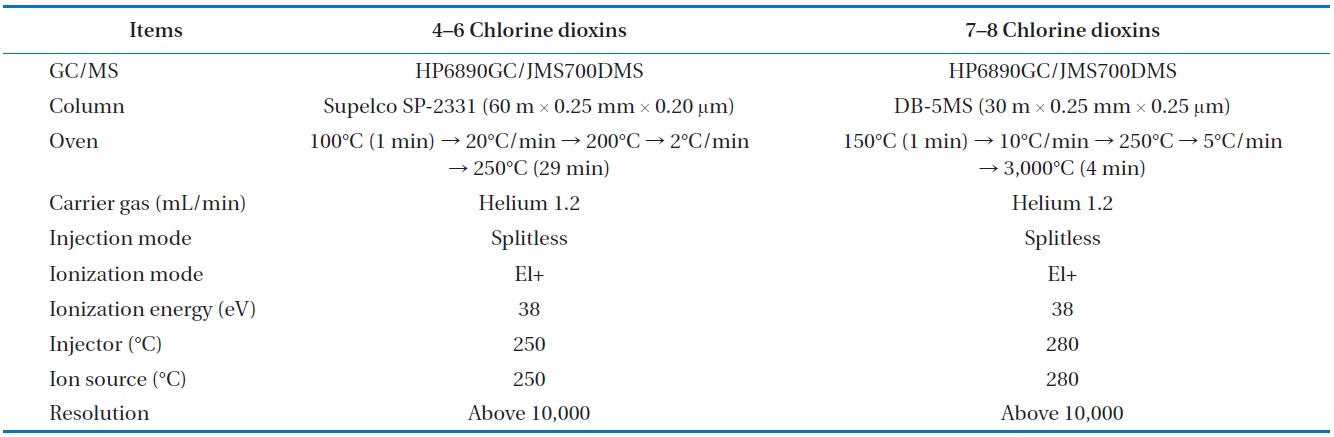
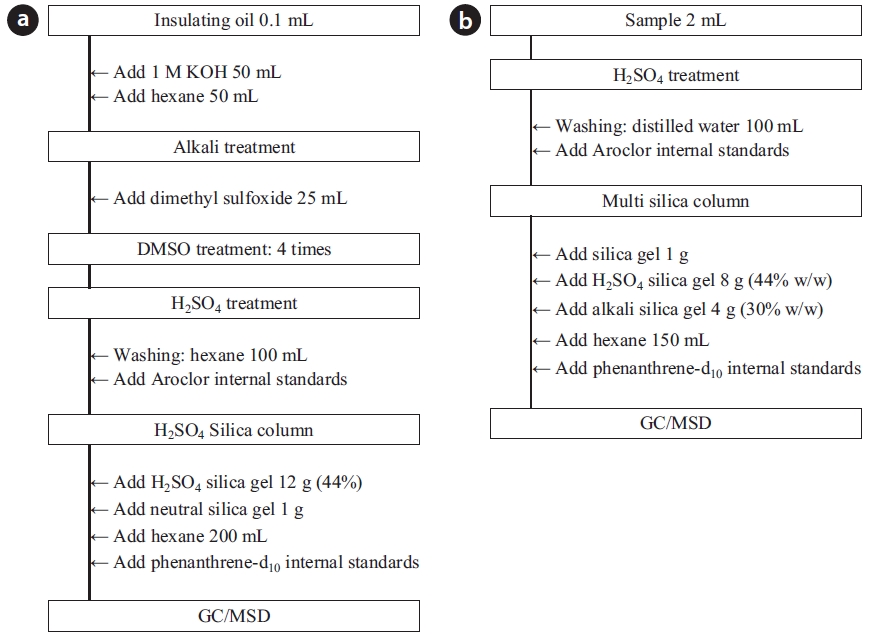
To analyze the 209 PCBs, the peaks for the retention times of each congener were checked against the standard materials of the 62 PCBs from the Wellington laboratories and that for Aroclor, a commercial PCB used in transformers. Five different concentrations of the Aroclor standard solution for the calibration curve were prepared (10, 50, 100, 200, and 500 ng/mL), and showed excellent linearity with an R2 value greater than 0.99. The PCBs were then identified and quantified using gas chromatography- mass seletive detector (GC/MSD), with a DB-5MS (5%-phenyl-methylpolysiloxane) column. The oven temperature was held at 70℃ for 2 min, then raised to 170℃ at a rate of 30℃/min, followed by a rate of 5℃/min to 300℃, and held at this temperature for 4 min. The analytical conditions of the GC/MSD (Agilent 6890 GC/5973 MSD; Santa Clara, CA, USA) for the analysis of the PCBs in insulating oil waste are listed in Table 3, with the detailed analytical procedures shown in Fig. 2. PCB congeners were identified using the International Union of Pure and Applied Chemistry (IUPAC) numbering systems [9, 10]. The toxicity equivalency quantity (TEQ) values for dl-PCB (dioxin like-PCB) were calculated by multiplying the toxic equivalency factors [11]. Table 4 shows the analytical conditions for the GC/ MSD analysis of the dioxins in the synthetic gas.
The concentrations of 15 air pollutants emitted from the combustor were continuously monitored and analyzed in duplicate, including NH3, HCl, Cl2, CS2, SOx, HCHO, C6H6, C6H5OH, H2S, HCN, vinyl chloride, fluorine, bromine, mercury, and arsenic.
[Table 2.] Sixty-two polychlorinated biphenyl (PCB) congeners in the BP-MS (Wellington Laboratories)

Sixty-two polychlorinated biphenyl (PCB) congeners in the BP-MS (Wellington Laboratories)
[Table 3.] Analytical conditions for the GC/MSD analysis of the PCBs in insulating oil waste
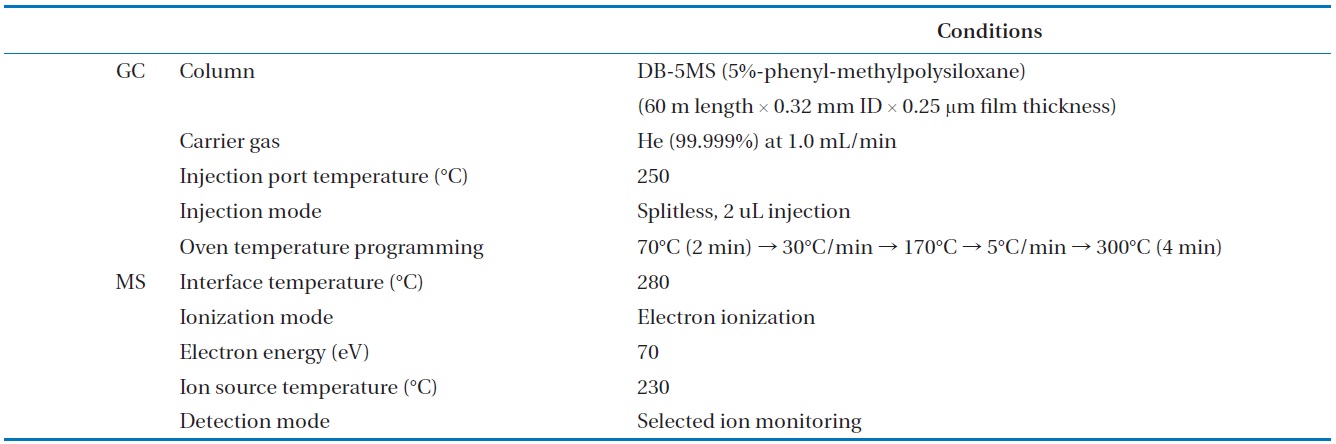
Analytical conditions for the GC/MSD analysis of the PCBs in insulating oil waste
[Table 4.] Analytical condition for the GC/MSD analysis of the dioxins in the syngas

Analytical condition for the GC/MSD analysis of the dioxins in the syngas
3.1. Characteristics of Gasification
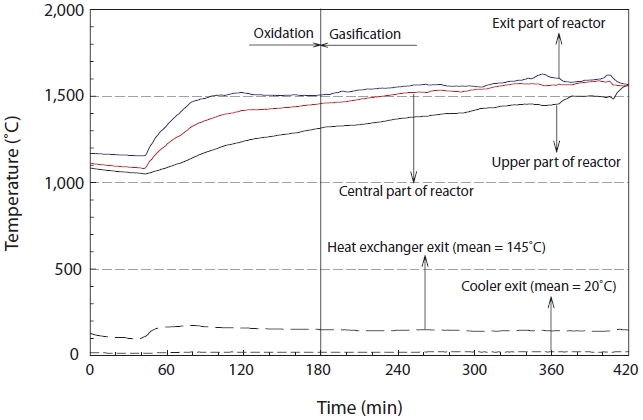
The temperature change in the reactor was monitored in order to check the operational stability of the reactor as the experiments were performed at very high temperature and high pressure. The temperature of the reactor was controlled by the flow rates of air and pure oxygen. The temperature changes were analyzed at 3 points inside the reactor, as shown in Fig. 3. As seen from Fig. 3, the temperature sharply increased after the injection of the insulating oil, but then showed a decreasing trend during the transition stage from oxidation to gasification. The temperatures at the outlet, center and top of the gasifier were maintained at 1,570℃, 1,540℃, and 1,420℃, respectively, during the gasification stage from 200 to 400 min after the gasification reaction. The temperatures of the heat exchanger and cooler were 145℃ and 20℃, respectively.
The major components from the gasification reaction were CO and H2, which have high heating values (chemical energy). This chemical energy can be recycled using a gas or steam turbine [12]. The composition and quantity of the synthetic gas obtained through gasification was dependent on the characteristics of the wastes, air (or oxygen) and steam flow rates, and reaction temperature. Synthetic gas has been found to have a heating value of 1,800?2,500 kcal/Sm3 when oxygen was used, but only 1,000 kcal/Sm3 when air was used [13].
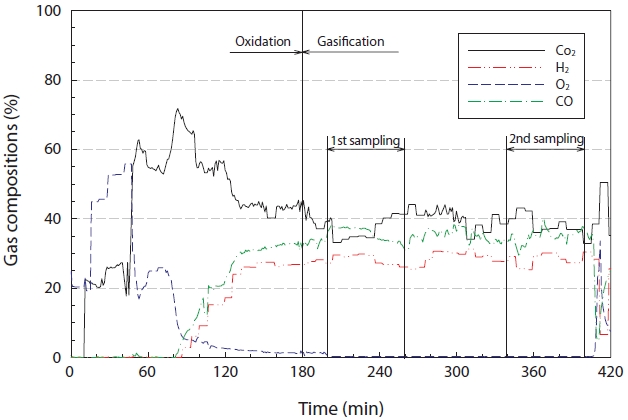
Fig. 4 reveals the characteristics of the synthetic gas (H2, CO, and CO2) generated from the gasification reaction. As seen in Fig. 4, during the early stages, the experiment was performed under oxidation conditions, but then converted to the gasification reaction when the experimental conditions had stabilized, i.e., the temperature and pressure inside the reactor. The concentration of oxygen in the synthetic gas decreased below 5% after 90 min of the gasification reaction. The oxygen concentrations during the steady state gasification reaction, from 200 to 400 min, ranged from 0.24% to 0.36%, with an average concentration (standard deviation) of 0.27 ± 0.0119%. The highest concentration of CO2 at the moment of conversion from oxidation to gasification was greater than 60%, which steadily decreased to within the range of 44.10% to 32.80%, with an average concentration (standard deviation) of 38.63 ± 3.11% during the steady state gasification step. The concentration of H2 rapidly increased during the initial stage of the gasification reaction, and ranged between 31.30%
and 25.30% during the steady state gasification stage, with an average concentration (standard deviation) of 28.42 ± 1.68%. For CO, the concentration ranged between 40.13% and 28.98%, with an average concentration (standard deviation) of 35.18 ± 1.93%, during the steady state gasification stage.
One of the indices for evaluating the thermal efficiency of a
gasification reaction is cold gas efficiency (CGE), which shows the degree of energy collected in terms of chemical energy from the raw feedstock. The CGE of coal and wastes are well known to be roughly 65?80% and a maximum of 60%, respectively [14]. The CGE can be calculated using Eq. (1). The average heating value and CGE of the synthetic gas generated through the gasification reaction of the insulating oil were 1,929 kcal/Sm3 and 49.21%, respectively. The lower heating values of CO and H2 used for the calculation were 3,019 and 2,580 kcal/Sm3, respectively
Cold gas efficiency (CGE)
= (Heating value of product gas/Heating value in feedstock) × 100
= [(Heating value of CO + Heating value of H2)/(Heating value of feedstock)] × 100 (1)
From Eq. (1)
Cold gas efficiency of insulating oil
= [(16.50 kcal/sec + 11.39 kcal/sec)/(56.66 kcal/sec)] × 100
= [(27.88 kcal/sec)/(56.66 kcal/sec)] × 100 = 49.21% (2)
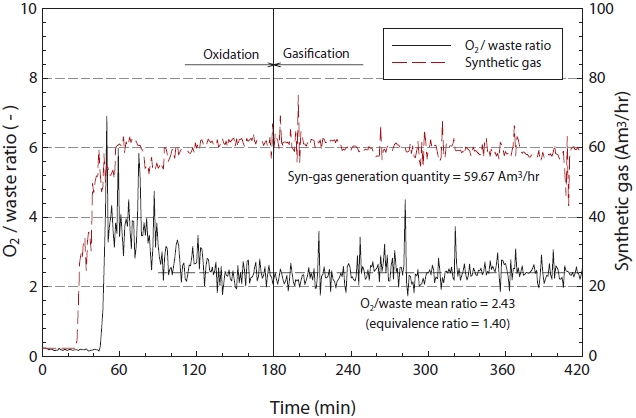
Fig. 5 illustrates the ratio of insulating oil to oxidant (O2) and the generation of synthetic gas according to the reaction time. As shown in Fig. 5, the equivalence ratio (φ), as defined in Eq. (1) was 1.40, with an average synthetic gas generation rate of 59.67 am3/hr.
φ =(F/O)/(F/O)stoich (3)
Where, the (F/O) is the fuel-oxygen ratio, and (F/O)stoich is the theoretical fuel-oxygen ratio.
In this study, the equivalence ratio and synthetic gas generation rate remained constant, with only slight fluctuation. From these results, the equivalence ratio and synthetic gas generation rate can potentially be calculated.
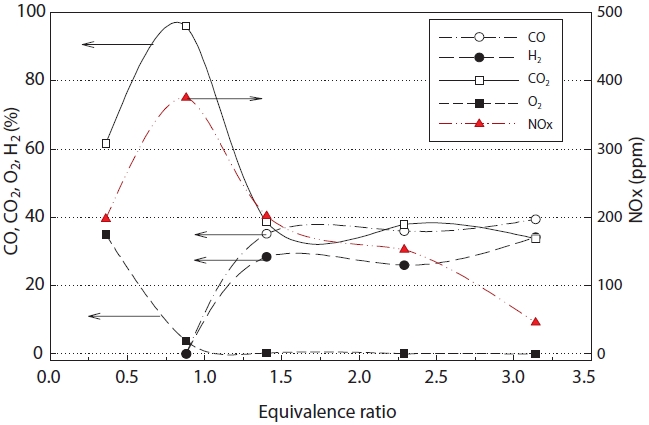
Fig. 6 shows the concentration of synthetic gas with change in the equivalence ratio. As seen in Fig. 6, mostly CO2 was generated at an equivalence ratio of less than 1 (fuel lean or oxidizer rich). However when the equivalence ratio was over 1.4, a steady state gasification reaction was obtained, at which point, the maximum concentrations of CO and H2 were achieved. In addition, stable gasification was obtained at an equivalence ratio of approximately 1.4, as the rates of CO and H2 generation did not increase much, even when the equivalence ratio was increased.
The concentrations of CO and H2 rapidly increased under the theoretical equivalence ratio (φ = 1.0) and fuel rich conditions, which was considered to be due to the low oxygen concentration in the synthetic gas [15].
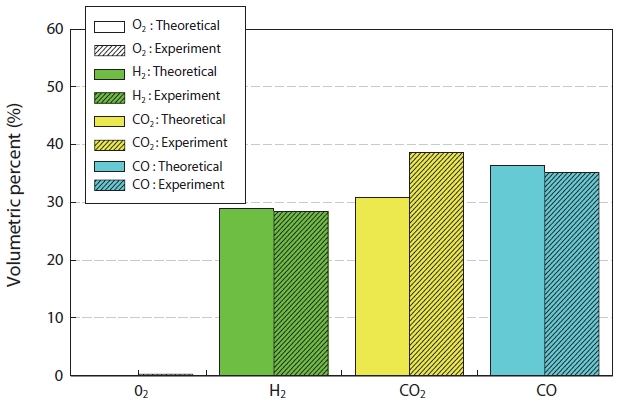
Fig. 7 shows the comparison of the synthetic gas compositions generated experimentally and via the simulation result from the gasification of insulation oil. The material and thermal balance in the reactor were calculated using Hysys (Aspen Technology Inc., Burlington, MA, USA), which is a process simulation program, with the chemical equilibrium model used by minimizing the Gibbs free energy [14]. As shown in Fig. 7, the theoretical and experimental values did not reveal large differences
[Table 5.] Destruction and removal efficiency of the PCBs in the insulating oil waste
Destruction and removal efficiency of the PCBs in the insulating oil waste
for CO and H2, but about an 8% error was observed in the case of CO2. This was thought to be due to the real time changes in the material compositions (insulating oil waste and etc.) during the experiment. The concentration of NOx showed a maximum at an equivalence ratio of around 1.0, but the concentration decreased with increasing equivalence ratio.
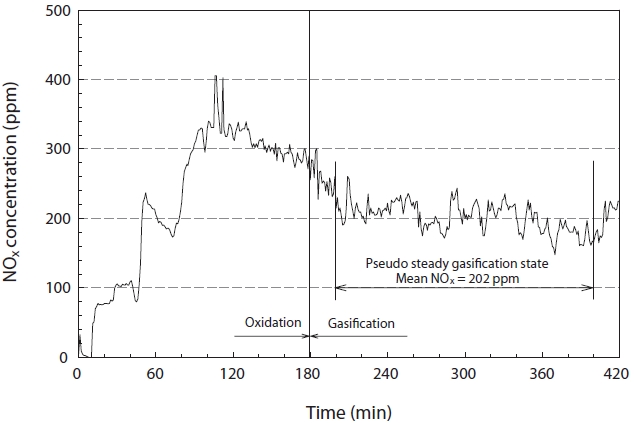
The concentration of NOx was continuously analyzed during the reaction under the equivalence ratio and temperature conditions of 1.4℃ and 1,500℃, respectively, to check for changes in the NOx concentration during the gasification process. As shown in Fig. 8, the NOx concentration reached a maximum just before the gasification reaction, and demonstrated a stable trend after a steady reduction. This was thought to be due to the increased temperature inside the reactor because the latent heat of synthetic gas was at a minimum, and accounts for the largest part of heat balance; the excess oxygen would be at its lowest just before the shift in the reaction from oxidation to reduction. In addition, this coincided with the general trend in regards to the inhibition of NOx formation, as it was under oxidizer lean conditions after the start of the gasification reaction. The steady state concentration of NOx was about 202 ppm under the experimental conditions used in this study.
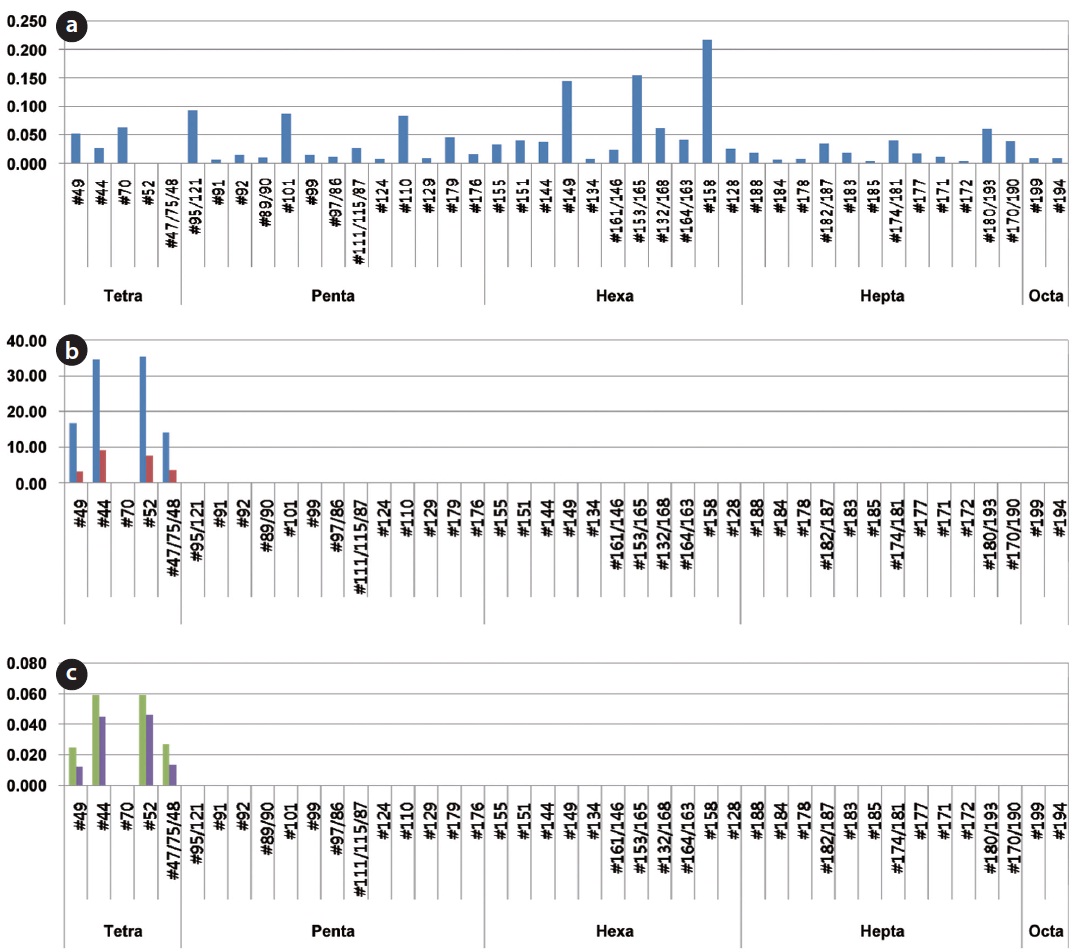
The decomposition ratio of the PCBs contained in the insulating oil was measured from the contents of PCBs existing in the transformer insulating oil and in the synthetic gas emitted after gasification of the insulating oil. The concentrations of the dioxin-like materials potentially formed due to the incomplete decomposition of PCBs were also measured. Fig. 9 shows the distribution of PCB congeners at 3 points, which include in the insulating oil waste, in the synthetic gas from the gasifier and in the flue gas from the combustor. Various PCB congeners were detected in the insulating oil. Tetrachlorobiphenyl and octachlorobiphenyl congeners were those mainly detected, but 12 dl-PCBs (#77, #81, #126, #169, #105, #114, #118, #123, #156, #157, #167, and #189), which have similar toxicities to that of dioxin, were not detected.
In the contents analyses of PCBs regarding the synthetic gas emitted from the HTPG reactor after the decomposition of the insulating oil, the concentrations of congeners #49, #44, #52, and #47/75/48 from 2 analyses of each were 16.622 and 3.185 ng/Sm3, 34.595 and 9.138 ng/Sm3, 345.338 and 7.721 ng/Sm3, and 14.122 and 3.588 ng/Sm3, respectively. The 12 dl-PCBs, which have similar toxicities to that of dioxin, were not detected, as was the case with the insulating oil. In the PCBs contents analysis in regard to the flue gas emitted from the combustor, the concentrations for congeners #49, #44, #52, and #47/75/48 from 2 analyses of each were 0.025 and 0.012 ng/Sm3, 0.059 and 0.045 ng/Sm3, 0.059 and 0.046 ng/Sm3, and 0.027 and 0.013 ng/Sm3, respectively. The 12
dl- PCBs, which have similar toxicities to that of dioxin, were not detected, as was the case with the synthetic gas.
The DRE was calculated on the basis of the mass of the PCBs fed to the HTPG reactor minus those remaining in the exit of the HTPG reactor and in the combustor emissions, according to the following equation:
DRE (%) = (1-Wo/Wi) × 100 (%) (4)
Where Wi is the mass of the sum for the PCBs entering the HTPG reactor and Wo are those exiting the HTPG reactor and the combustor.
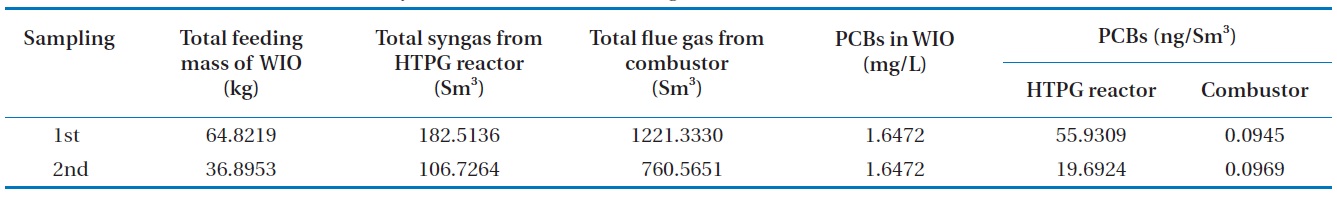
Table 5 shows the analyses of the PCB contents in the transformer insulating oil, the synthetic gas emitted from the HTPG reactor and the emission gas from the combustor; all analyses were conducted in duplicate. The DREs of the PCBs at each point were calculated using Eq. (3). The DREs of the PCBs after being in the HTPG reactor following gasification were 99.9911% and 99.9968%, respectively, with an average of 99.9940%. This HTPG reactor was found to be very effective for the gasification of insulating oil and in the treatment of the PCBs contained because the PCBs removed after passing through the combustor were 99.9999%.
DREHTPG reactor, 1st (%) = (1-Wo/Wi) × 100 = (1-9.5114 × 10⁻⁶/0.1068) = 99.9911% (5)
DREHTPG reactor, 2nd (%) = (1-Wo/Wi) × 100 = (1-1.9582 × 10⁻⁶/0.0608) = 99.9968% (6)
DREtotal, 1st (%) = (1-Wo/Wi) × 100 = (1-1.0755 × 10⁻⁷/0.1068) = 99.9999% (7)
DREtotal, 2nd (%) = (1-Wo/Wi) × 100 = (1-6.8685 × 10⁻⁸/0.0608) = 99.9999% (8)
Table 6 shows the concentrations of PCDDS and PCDFs measured during the gasification experiments carried out at 1,400℃. The PCDDs are found to be at high concentrations compared to the PCDFs, which is the trend unusually observed [16]. In these analyses furans such as 1, 2, 3, 4, 6, 7, 8-HpCDF, 1, 2, 3, 4, 7, 8, 9-HpCDF, and octachlorodibenzofuran (OCDF) were detected: as well as dioxins such as 1, 2, 3, 4, 6, 7, 8-HpCDD, and octachlorodibenzopdioxin (OCDD). Therefore, more chlorinated isomers for both PCDDs and PCDFs were formed in larger amounts than those less chlorinated, which was also observed in the results of Aracil et al. [14]. The dioxin-like material concentrations in the synthetic gas generated from the HTPG reactor from duplicate analyses were 12.107 and 15.135 pg-TEQ/Sm3. This means that the HTPG reactor treated the PCBs in the insulating oil ad-
[Table 6.] Dioxin concentrations in the synthetic gas generated from the HTPG plant
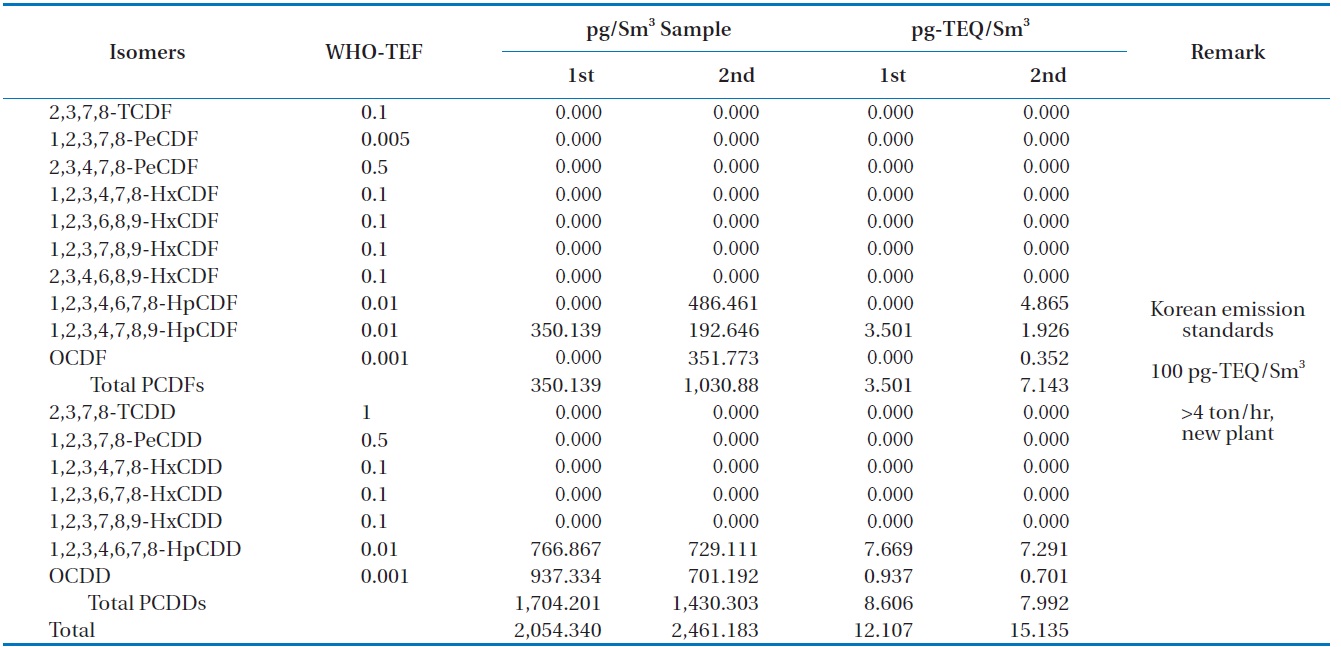
Dioxin concentrations in the synthetic gas generated from the HTPG plant
equately because the concentrations were under the new Korean emission standard of 100 pg-TEQ/Sm3 for an incinerator scale of more than 4 ton/hr.
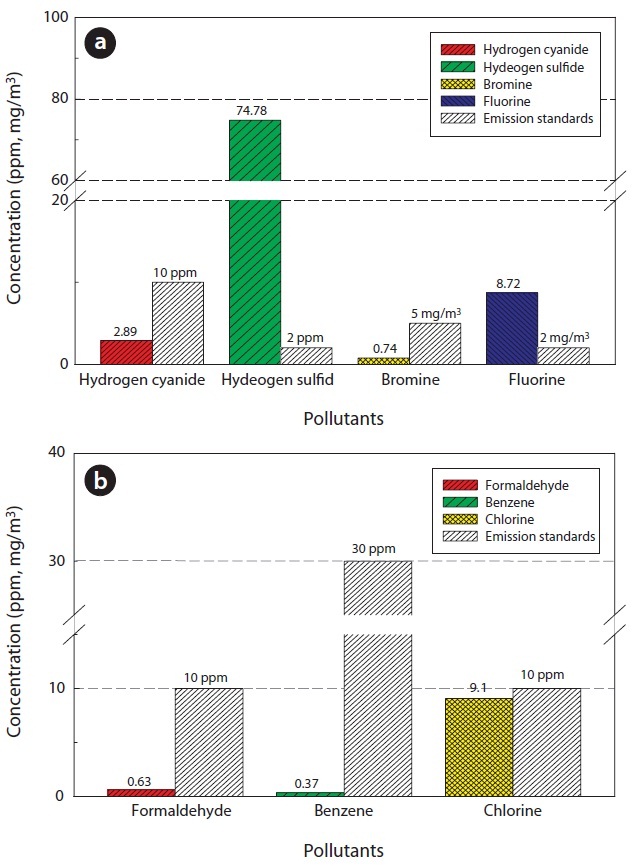
Table 7 and Fig. 10 show the concentrations of pollutants emitted from the HTPG reactor. The Korean emission standards shown in Table 7 are applicable to an incinerator operation with a capacity of over 2 ton/hr. The majority of pollutants were found to be at much lower concentrations in comparison to those al-
[Table 7.] Air pollutants in the synthetic gas generated from the HTPG reactor
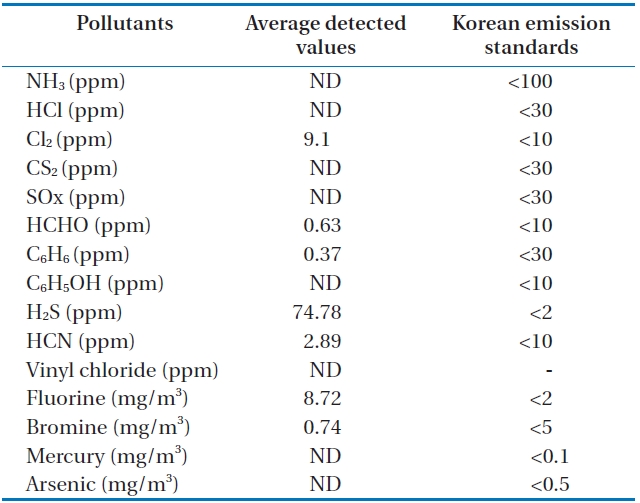
Air pollutants in the synthetic gas generated from the HTPG reactor
lowed in the regulations. Only 5 out of 11 gaseous pollutants and 2 out of 4 heavy metals were detected in the analyses. Of the gaseous contaminants, 74.78 ppm of H2S was detected, which exceeded the Korean emission standard of 2 ppm by 34 times. Furthermore, the concentration of Cl2 was 9.1 ppm, which was close to the Korean emission standard of 10 ppm. The fluoride compound was 8.72 mg/m3, which is more than 4 times the permissible Korean emission standard of 2 mg/m3. However, concentrations of other heavy metals were much lower than those permissible in the Korean emission standards or were not detected at all. However, it is believed that the concentrations of the air pollutants emitted could be controlled compared to under those in the Korean emissions standards if air pollution control facilities are established, because the results expressed in this study are the concentrations of proper air pollutants emitted from the HTPG reactor without any air pollution control equipment. Therefore, the experimental conditions suggested in this study are considered as very useful, not only for effectively treating insulating oil containing PCBs, but for obtaining synthetic gas comprised of CO and H2.
Insulating oil containing PCBs was converted into harmless synthetic gas via pyrolysis in the HTPG reactor with thermal energy obtained from the combustion of the synthetic gas produced. The results obtained from this study are listed below. 1) During the gasification reaction of the insulating oil waste (20 kg/hr), 59.67 Am3/hr of synthetic gas was generated, with a heating value of 1,929 kcal/Sm3, when processed under a steady state. The synthetic gas also showed the possibility for use as a fuel gas thanks to the average concentrations (standard deviation) of each gas, which were O2 0.27 ± 0.0119%, CO2 38.63 ± 3.11%, H2 28.42 ± 1.68%, and CO 35.18 ± 1.93%. 2) The HTPG system proposed in this study demonstrated high energy efficiency in treatment performance and in the production of synthetic gas generated from the gasification of the insulating oil waste. The stable gasification reaction progressed at around an equivalence ratio of 1.4. 3) Many tetrachlorobiphenyl and octachlorobiphenyl PCBs were detected in the transformer insulating oil, but 12 dl-PCBs were not detected. Only the #49, #44, #52, #47/75/48 PCB congeners were detected in the synthetic gas generated from the gasification of the insulating oil in the HTPG reactor but 12 dl-PCBs were not detected. 4) The average DRE of the PCBs after gasification of the insulating oil in the HTPG reactor was 99.9939%, and that of the PCBs from the combustor was 99.9999%. This proves that our HTPG reactor system was very effective for the gasification of insulating oil and the treatment of PCBs contained within the oil. 5) Only 5 gaseous contaminants and 2 heavy metals were detected in the analyses regarding the 11 gaseous contaminants and 4 heavy metals were potentially emitted from the HTPG reactor. It is believed that the concentrations of the contaminants emitted into the air can be controlled to almost zero on the establishment of air pollution control facilities, because the results of this experiment represent the concentrations of air contaminants emitted from the HTPG reactor without the use of air pollution control facilities. Consequently, the experimental conditions suggested in this study are considered very useful for not only the effective treatment of PCBs but also for obtaining synthetic gas comprised of CO and H2.