One of the main factors affecting the low production of red seabream in Korea is low temperatures during the win-ter season. The optimum water temperature for the growth of red seabream is over 20℃ (Ren et al., 2006; Oh et al., 2007; Huang et al., 2007; Uyan et al., 2007; Biswas et al., 2008; Matsunari et al., 2008). Lower temperatures result in lower food consumption by the red seabream in winter time, with food consumption stopping when temperatures fall be-low 12℃ (Kim, 2000). Furthermore, Kim (2000) mentioned that temperatures over 15℃ are needed for 80% survival of red seabream fingerlings during the over-wintering period. However, the winter temperatures of coastal waters in Korea during February of 2006 were 5-14℃ (Ministry of Maritime Affairs and Fisheries, 2007). Based on these data, not many places in the coastal waters of the Korean peninsula are op-timum for the over-wintering of red seabream. Therefore, the calcuculture of this species in natural coastal waters in this country is not economically viable.
The possibility of controlling rearing-water temperature is one of the most important advantages of using recirculating aquaculture systems compared with two other common ma-rine fish-culture methods, flow-through and cage systems. As red seabream is a very popular species in Korea, recirculating aquaculture system could be applicable for rearing this species during the over-wintering period.
Recently, many commercial biofilter media and operating systems have been developed and utilized on commercial scales (Sandu et al., 2002). Sand, polystyrene microbeads, and Kaldnes beads are commonly used as biofilter media. These media have their own advantages and disadvantages. Sand has high specific surface area (SSA) because the sand particles are small. However, because of the specific gravity of sand (
The purpose of this study was to test the feasibility of juve-nile red seabream culture in a recirculating aquaculture system with three biofilters,
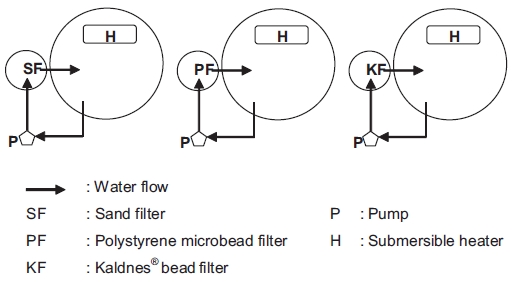
The experiments were conducted in three sets of closed re-circulation systems using SF, PF, and KF. Each system consist-ed of one circular fiberglass-reinforced (FRP) tank (ø 80 cm, depth 60 cm), one pump (PB43-1; Hanil Pump Co. Korea ), and one biofilter cylinder (ø 19 cm, depth 100 cm) filled with 7 L of each medium to assess filter performance under the same volume conditions (Fig. 1). The total water volume used in each system was 200 L. Water from the circular FRP tank was pumped into the biofilter cylinder, and then the water flowed back to the circular tank. The water exchange rate was 5%/day. The flow rate through each of the biofilters was adjusted to 24 L/min. Throughout the study, submersible heaters were
also used in each system to maintain the water temperature at 23 ± 1℃.
The SF was filtered by up-flow movement to fluidize the sand (Wheaton et al., 1994b; Summerfelt, 2006), whereas the PF and KF were filtered by down-flow movement (Eikebrokk 1990; Eikebrokk and Ulgenes 1998; Rusten et al., 2006; Tim-mons et al., 2006). The SSA of the sand, polystyrene micro-bead, and Kaldnes bead media were 7,836, 3,287, and 500 m2/m3, respectively. The specific gravities of SF, PF, and KF were 2.65, 0.16, and 0.95, respectively.
Red seabream,
The initial mean body weight of the fish was 29 g. Fish were redistributed into the three biofilter systems, each of which was duplicated. Each system was stocked with 25 fish. The pH was controlled using soda addition to keep values above 7.1 (Fivelstad et al., 1995, 1998; Sammouth et al., 2009).
The nitrogen and total suspended solid (TSS) concentra-tions were calculated by analyzing water taken from the inlet and outlet of all biofilters once a day. Total ammonia nitro-gen (TAN) was measured using a TAN meter (Model 720A; Orion, USA ) and confirmed by the method of the American Public Health Association (Eaton et al., 1995). Nitrite-nitro-gen (NO2-N) and nitrate-nitrogen (NO3-N) were measured by spectrophotometer (DR/200; Hach, USA ), and TSS was mea-sured to investigate the solid removal rate by filtering 1 L of water sample and drying the residue on the filter at 103-105℃ in a drying oven. The efficiencies of the biofilters were calcu-lated using the following equations:
Volumetric TAN removal rates (VTR, g m-3day-1) = 1.44 × (TANin - TANout) × Q × V-1(Peng, 2003),
where TANin is the concentration (mg/L) of total ammonia ni-trogen in the biofilter inlet, TANout is the concentration (mg/L) of total ammonia nitrogen in the biofilter outlet, Q is total water flow (m3/day) through the filter, V is the volume (m3) of the filter bed, and 1.44 is a conversion factor.
Water temperature and dissolved oxygen (DO) were mea-sured by oxygen meter (Handy MK III; Oxyguard, USA), pH was measured using a pH meter (P25; Ecomet, USA ), and sa-linity was measured using a refractometer (ATAGO; Japan ). All measurements were taken in triplicate following the meth-ods described by Eaton et al. (1995).
At the end of the study, all fish were fasted for one day, and body weights (W, g) and standard lengths (L, cm) were mea-sured individually. Growth performance was calculated using the following equations:
Specific growth rate (SGR %/day) = (LnWf - LnWi) × 100 n-1Feed conversion ratio (FCR) = F (Bf - Bi)-1(Sammouth et al., 2009),
where Wi and Wf are initial and final body weight (g/fish), respectively, n is the number of days of the growing period, F is the feed consumption per period (g), Bf is the final biomass (g), and Bi is the initial biomass (g) over a period.
Body composition of fish at the beginning and end of the experiment was measured by proximate analysis (Huang et al., 2007; Oh et al., 2007; Biswas et al., 2008). Proximate analysis of experimental fish was performed by the standard methods of the Association of Official Analytical Chemists (AOAC, 1995). Crude protein was measured following the Kjeldahl method (N × 6.25) after acid digestion. Crude ash was determined by incineration at 550℃, and crude lipid was determined by Soxhlet extraction using a Soxtec system 1046 (Foss, Hoganas, Sweden). Samples of fish were dried at 105℃ to determine moisture content.
All statistical analyses were performed using the Minitab statistical software package release 14. Mean values of all data from each biofilter system were compared using one-way
ANOVA. The differences were analyzed by Tukey’s HSD test to test for significant differences (
During the study, temperature, pH, DO, and salinity in all systems were maintained within the ranges of 22.8-23.6℃, 7.7-8.9 mg/L, 7.2-7.6, and 32.0-34.0 psu, respectively.
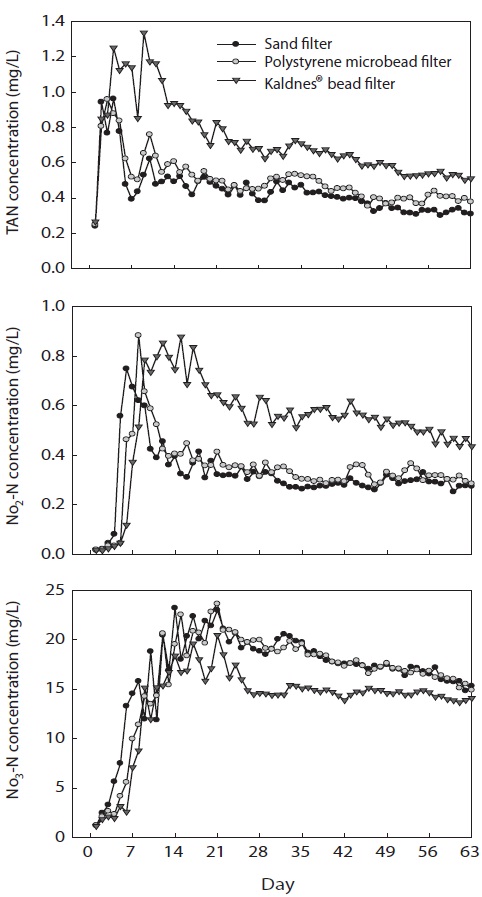
Concentrations of TAN increased sharply for the first few days, reached their peak levels, and then decreased thereafter in all filter systems (Fig. 2). The peak concentration of TAN (0.96 mg/L) at the outlet of SF was reached 4 days after the experiment started, whereas those of PF (0.96 mg/L) and KF (1.34 mg/L) were reached after 3 and 9 days, respectively.
Concentrations of NO2-N increased sharply for the first few days after the experiment started and stabilized thereafter. The peak concentrations of NO2-N in SF, PF, and KF were 0.75, 0.88, and 0.88 mg/L, respectively, and those concentrations were reached at days 6, 8, and 15, respectively, after the start of the experiment.
Concentrations of NO3-N rapidly increased in the first 2 days and fluctuated for 1 week. The concentrations of NO3-N in SF, PF, and KF reached their peak values of 23.2, 23.6, and 20.5 mg/L, respectively at days 14, 21, and 21, respectively, after the experiment started. At the end of the study, NO3-N concentrations from the outlets of SF, PF, and KF were 16.9, 16.5, and 13.8 mg/L, respectively.
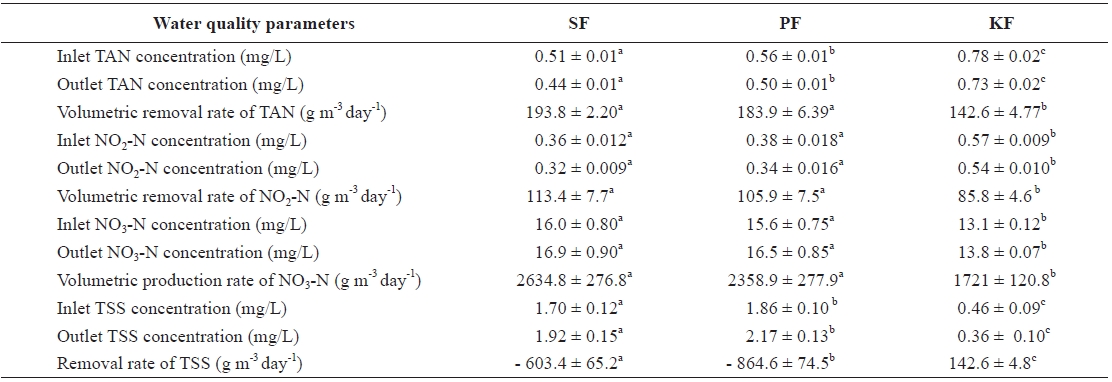
The mean concentration of TAN from the outlet of KF showed the highest value (0.73 mg/L), and that of SF (0.44 mg/L) was the lowest (Table 1). The concentration of TAN in PF (0.50 mg/L) was significantly higher than that in SF and significantly lower than that in KF. The volumetric removal rate of TAN in SF was 193.8 g m-3 day-1, which was signifi-cantly higher than that in KF (142.6 g m-3 day-1) but not signifi-cantly higher than that in PF (183.9 g m-3 day-1).
The concentration of NO2-N in the outlet of KF was the highest (0.54 mg/L), followed by PF (0.34 mg/L) and SF (0.32 mg/L). The volumetric removal rate of NO2-N in SF was 113.4 g m-3 day-1, and the rate always remained higher than those in PF (105.9 g m-3 day-1) and KF (85.8 g m-3 day-1). There was no significant difference in the volumetric removal rate of NO2-N between SF and PF, but that of KF was lower than the other two.
At the end of the study, the concentration of NO3-N in SF (16.9 mg/L) was significantly higher than that in KF (13.8 mg/L) but was not significantly different from that in PF (16.5 mg/L). The production rates of NO3-N in SF, PF, and KF were 2,634.8, 2,358.9, and 1,721.0 g m-3 day-1, respectively. The
Removal efficiencies of total ammonia nitrogen (TAN) nitrite nitrogen (NO2-N) nitrate nitrogen (NO3-N) and total suspended solid (TSS) in the red seabream Pagrus major culture tanks with three different biofilter media sand (SF) polystyrene microbead (PF) and Kaldnes bead (KF)
concentration of TSS in SF was 1.92 mg/L , and those in PF and KF were 2.17 and 0.36 mg/L, respectively. The daily re-moval rates of TSS from SF, PF, and KF were - 603.4, - 864.6, and 142.6 g m-3 day-1, respectively.
Table 2 shows the growth performance of fish for the whole growing period in all systems. Fish biomasses in SF, PF, and KF grew from 741.9, 727.9, and 741.7 g to 1,172.5, 1,120.1, and 1,024.5 g, respectively over the 9-week period. The bio-masses of the fish in SF, PF, and KF were increased by 158.0%, 153.9%, and 138.1%, respectively. The biomass of the fish in SF increased significantly more than that of fish in KF but was not significantly higher than that of fish in PF. There were no biomass differences between PF and KF. The SGR of the fish in SF, PF, and KF were 0.73%, 0.68%, and 0.51%/day, respectively. The SGR in SF and PF was significantly higher than that in KF, but there was no difference between SF and PF. The FCR of fish in SF, PF, and KF was 1.87, 1.94, and 2.35, respectively. There was no significant different in FCR between SF and PF, but the FCR in KF was significantly lower than those in SF and PF.
The crude protein content of fish at the beginning of the experiment was 13.6%, but it had increased significantly at the end of the experiment for fish in all biofilter systems (Table 3). The crude protein contents of fish in SF, PF, and KF at the end of experiment were 16.3%, 15.7%, and 14.5%, respec-tively. Significant differences were found among the fish in all biofilters, with the highest crude protein levels of fish in SF, followed by PF and KF.
The final crude ash content of the fish in all systems also in-
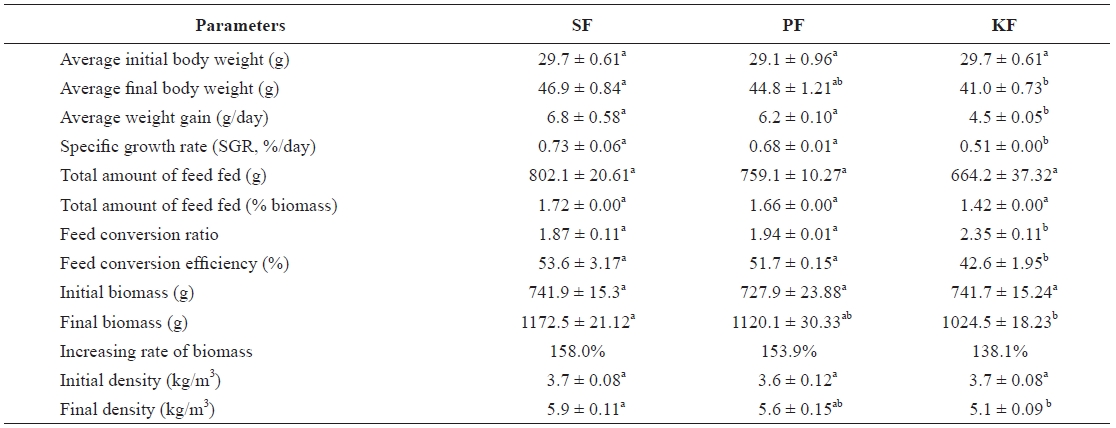
Growth performance of red sea bream Pagrus major reared in recirculating systems with three different biofilter media sand (SF) polystyrene microbead (PF) and Kaldnes bead (KF)
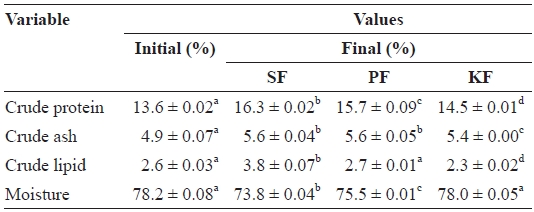
Results of proximate analysis values of red sea bream Pagrus major reared in recirculating systems with three different biofilter media sand (SF) polystyrene microbead (PF) and Kaldnes bead (KF)
creased significantly from the initial value (4.9%). Final crude ash contents of the fish in SF (5.6%) and PF (5.6%) were not significantly different, but both were significantly higher than that of KF (5.4%).
Significant differences in crude lipid contents of the fish among the three filter systems were found. The initial crude lipid content of the fish was 2.6%, but this significantly in-creased to 3.8% in the fish from SF by the end of the experi-ment. The crude lipid content of the fish in PF was not changed significantly from the initial value (2.7%), and that in KF fish had significantly decreased to 2.3%.
The initial moisture content of the fish was 78.2%. There were no significant changes in moisture content of the fish in KF (78.0%) by the end of the experiment. However, the mois-ture contents of the fish in SF (73.8%) and PF (75.5%) had significantly decreased from the initial value. The moisture content of the fish in KF was significantly higher than that in PF and SF, and the moisture content of the fish in PF was significantly higher than that in SF.
During the study, temperatures were maintained in the range of 22.8-23.6℃. This temperature range is optimum for this species (Kim, 2000; Biswas et al., 2006, 2007, 2008; Ren et al., 2006; Oh et al., 2007; Huang et al., 2007; Uyan et al., 2007; Matsunari et al., 2008). DO remained between 7.7 and 8.9 mg/L, which was almost saturation level. The pH was maintained between 7.2 and 7.6. This was slightly lower than normal seawater but is common in recirculating systems and is not a problem for fish growth (Fivelstad et al., 1995, 1998; Sammouth et al., 2009). Salinity remained between 32 and 34 psu in all systems. These values are in the appropriate ranges for the nitrification and growth of fish (Wheaton et al., 1994a).
Total ammonia nitrogen is the most critical water quality parameter in intensive recirculating systems. According to Wheaton et al. (1994a) and Losordo et al. (1998), TAN should be kept below 1 mg/L in intensive recirculating systems. Dur-ing the study, concentrations of TAN in all systems reached 1 mg/L at their peaks. However, after nitrification bacteria were fully developed in the steady-state phase, concentrations of TAN in all systems were maintained at less than 1 mg/L.
In the present study, mean concentrations of NO2-N were also maintained at less than 1 mg/L in all treatments when bac-teria were fully developed. This concentration is not harmful for fish growth (Wheaton et al., 1994a; Losordo et al., 1998).
At the end of the study, concentrations of NO3-N ranged from 11.8 to 15.83 mg/L in all systems. These values are within acceptable limits for aquaculture (Losordo et al., 1998; Mass-er et al., 1999). Generally, NO3-N does not become a main interest of aquaculturists, as studies have shown that aquatic species can tolerate extremely high levels (over 200 mg/L) of nitrate-nitrogen in production systems (Losordo et al., 1998). Furthermore, Masser et al. (1999) stated that nitrate, the end product of nitrification, is relatively nontoxic except at very high concentrations, such as those over 300 mg/L.
The volumetric removal rate of TAN in SF showed the best performance compared with other filter media. This is related to the characteristics of the filter media. Sand has a very high SSA of 7,836 m2/m3, compared with SSA of 3,287 m2/m3 for polystyrene microbeads and 500 m2/m3 for Kaldnes beads. The volumetric TAN removal rate of PF showed better per-formance than that of KF. This result is also related to SSA. The SSA of PF was much higher than that of KF. According to Malone and Pfeiffer (2006), sand and polystyrene microbeads are classified as high SSA media. With the higher SSA of these media, more bacteria can grow per unit volume of medium, and total ammonia removal per unit volume of filter is also higher (Wheaton et al., 1994a; Lekang and Kleppe, 2000).
The concentration of TSS was 1.92 mg/L in the SF system and 2.17 mg/L in the PF system. The TSS concentrations in these two systems were significantly higher than that in KF, 0.36 mg/L. KF could remove the TSS at a value of 142.6 g m-3 day-1, whereas SF and PF could not remove TSS but instead produced TSS at 603.4 and 864.4 g m-3 day-1, respectively. The SF and PF systems could not trap solids properly. The SF was operated by a fluidized method, whereas and the PF medium was round in shape, and it moved and rolled freely (Timmons et al., 2006). Meanwhile, KF clearly showed the lowest con-centration of TSS among the three systems, as the medium could trap solids. The KF medium has a characteristic shape that enables it to hold sludge (Rusten et al., 2006). Higher concentrations of TSS interfere with the ability of the fish to capture prey and identify food, and they reduce light trans-mittance, feeding rate, and growth rate (Stickney 1979, 1994; Kerr 1995). According to Kerr (1995) and Bilotta and Brazier (2008), tolerance values to TSS vary with the species and life stage of various aquatic biota as well as with the temperature and duration of exposure. However, there is no evidence that concentrations of SS below 20 mg/L have any harmful effects

Comparisons of specific growth rate (SGR) and feed conversion ratio (FCR) of red sea bream Pagrus major with others studies
on fisheries (Bilotta and Brazier 2008). Therefore, the con-centrations of TSS in all systems in the present study were far below the acceptable upper limits for fish culture.
After 9 weeks of study, the growth performances of the fish in SF and PF were not significantly different, but that of the fish in KF was significantly lower. These differences might be related with the water quality conditions in KF. The average TAN concentration in KF was 0.73 mg/L, and this concentra-tion was always higher than those for SF (0.44 mg/L) and PF (0.50 mg/L). It seems the different TAN concentrations likely had some effects on growth performance among the three filter systems. The TAN removal efficiency of KF was significantly lower (6.5%) than that of SF (13.6%) or PF (11.5%). NO2-N, another toxic nitrogen form in water, was also significantly higher in KF (0.54 mg/L) than in SF (0.32 mg/L) and PF (0.34 mg/L). The NO2-N and TAN removal efficiencies of all biofil-ters showed similar patterns. The removal efficiencies of NO2-N in SF, PF, and KF were 11.3, 10.2, and 5.4%, respectively.
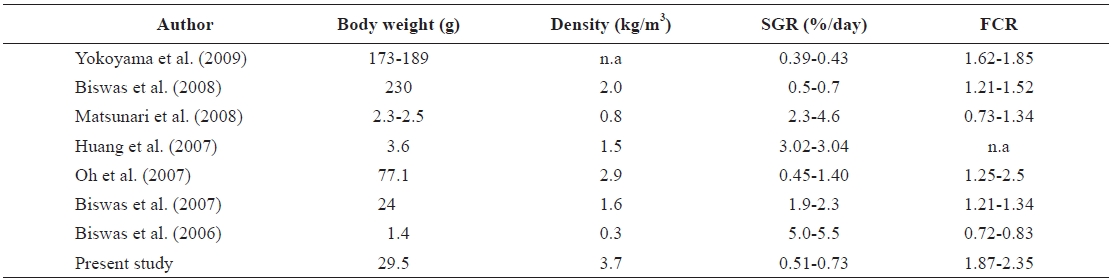
The values of SGR (range, 0.51 to 0.73%/day) and FCR (range, 1.87 to 2.35) found in the present study were compared with other related studies with red seabream (Table 4). Some previous results showed higher SGR than the present results. The SGR values of Biswas et al. (2006, 2007), Huang et al. (2007), and Matsunari et al. (2008) were much higher than those recorded in the present study, whereas the FCR values in those studies were much lower than that in the present study. These differences might be due to the size and density of the fish stocked. In the present study, the size of fish was much bigger (29.0 g) than the 1.4 g in Biswas et al. (2006), 3.6 g in Huang et al. (2007), and 2.5 g in Matsunari et al. (2008). The rearing density in the present study was much higher (3.7 kg/m3) than the 0.3 kg/m3 in Biswas et al. (2006), 1.5 kg/m3 in Huang et al. (2007), 1.6 kg/m3 in Biswas et al. (2007), and 0.8 kg/m3 in Matsunari et al. (2008).
Conversely, the SGR values in the present study were high-er than those reported by Yokoyama et al. (2009). The reason for these differences also seems to be differences in fish size. The range of fish weights used in Yokohama et al. (2009) was 173-189 g, which was much heavier than the 29 g fish used in the present study. The SGR of Oh et al. (2007) and Biswas et al. (2008) were higher, and the FCR values were lower than those recorded in the present study. The weight of fish used in Oh et al. (2007) were 77.1 g, and that in Biswas et al. (2008) was 230 g, but the stocking densities were lower than that of the present study. The fish density of Oh et al. (2007) was 2.9 kg/m3, and that of Biswas et al. (2007) was 2.0 kg/m3, com-pared with the 3.7 kg/m3 density in the present study.
According to Oh et al. (2007), the SGR of red seabream tended to increase with increasing body weight, whereas FCR tended to decrease. Lefrancois et al. (2001) mentioned that higher density is considered a potential source of stress, and it can negatively affect fish growth. Rowland et al. (2006) men-tioned that survival and feeding rates were also affected by high fish density. Negative effects of higher density on fish growth performance are generally associated with water qual-ity deterioration and increased aggressive behavior (Ellis et al., 2002). The TAN concentrations of sea bass (
The crude protein, crude lipid, and moisture contents var-ied among the fish from the biofilter systems in this study. These differences were due to the differences in FCR in fish from each treatment. According to Oh et al. (2007), the crude protein and crude lipid contents of fasted red seabream were increased after re-feeding, but the moisture content was de-creased. The highest protein-intake or lowest FCR groups of red seabream showed the highest crude protein and crude lipid contents but the lowest moisture contents (Huang et al., 2007; Biswas et al., 2008). In the present study, fish in the SF system showed the lowest FCR among the treatments. The fish in the SF system showed the highest crude protein and crude lipid contents, and their moisture content was the lowest. There-fore, the results of the present study are in accordance with those of Oh et al. (2007), Huang et al. (2007), and Biswas et al. (2008).