Marine seaweeds are a major source of primary produc-tion, providing habitat and food for associated invertebrates and fishes in marine coastal ecosystems (Terawaki et al., 2001; Bernecker and Wehrtmann, 2009). The pollution and distur-bance of macroalgal habitats by human activities reduce spe-cies diversity and simplify its community structure (Diez et al., 1999; Kim et al., 2010). Biodiversity, which is high in sta-ble habitats and unpolluted areas, can be used as a biological indicator responding environmental conditions (Piazzi et al., 2002; Arevalo et al., 2007). In addition, seaweed community structures in the intertidal and subtidal zones are influenced by a variety of biotic (grazing and competition) and environmen-tal factors such as substrate characteristics, exposure, and tidal variation (Juul-Pedersen et al., 2008).
Seaweed community structures are generally analyzed by species composition, biomass, coverage, vertical distribution, and functional-form group, which are Parameters that respond to environment conditions (Murray and Littler, 1984; Prathep, 2005; Wells et al., 2007; Choi et al., 2008). The stability of a seaweed community does not always indicate a large seaweed biomass, because opportunistic algae account for substantial biomass in eutrophicated areas (Weston, 1990). In general, water pollution degrades macroalgae, resulting in the reduc-tion of species richness (number), while the biomass of a few ephemeral species increases with high reproductive capabil-ity, tolerance to pollution, and simplified community structure (Gorostiaga and Diez, 1996). Thus, seaweed species compo-sition is an ideal parameter for monitoring ecological status (Wells et al., 2007).
Seaweeds can be classified into six functional-form groups based on their morphology, physiology, internal structure, photosynthesis rate, and predation-tolerance strategy (Littler and Littler, 1984; Padilla and Allen, 2000). Thick-leathery and calcareous functional form seaweeds are dominant in stable environments, whereas green ephemeral algae of both sheet and filamentous forms are generally stress-tolerant species with high reproductive capability in polluted areas (Vasquez and Guerra, 1996; Schramm, 1999; Choi et al., 2008). Thus, the biomass and functional composition of seaweed communi-ties are very important biological parameters that reflect over-all environmental conditions (Hay, 1994; Phillips et al., 1997; Ballesteros et al., 2007).
To date, studies of seaweed community structure have been mainly conducted in coastal areas to examine the vertical distribution of dominant seaweeds, variation in seasonal bio-mass, and the species composition of intertidal rocky shores (Kim et al., 1995; Yoo et al., 2007; Choi and Huh, 2008). However, few studies of the subtidal seaweed assemblages surrounding islands in the Yellow Sea have been performed due to sampling difficulties and the high coasts of SCUBA and boating equipments (Baek et al., 2007; Choi et al., 2008; Wan et al., 2009; Kim et al., 2010). Therefore, the aim of the present study was to examine seaweed community structures using species compositions and functional groups as descrip-tors to contribute to the knowledge of intertidal and subtidal seaweed vegetation surrounding Ongdo, Jusamdo, and Woe-jodo Islands.
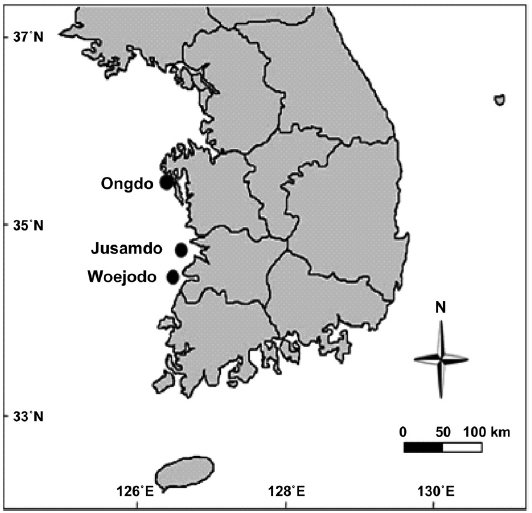
Seaweed community structures and their abundances were examined at intertidal and subtidal zones of Ongdo (36°38'N, 126°00'E), Jusamdo (35°48'N, 126°24'E), and Woejodo (35°35'N, 126°13'E) Islands, the Yellow Sea, Korea, in Au-gust 2006 (Fig. 1). Subtidal levels were established from the
At the laboratory, seaweeds were rinsed with tap water and identified following the classification and nomenclature of Lee and Kang (2002). The seaweeds collected from each quadrat were measured for dry weight, and their biomass was calculated. Using the coverage and frequency data, the rela-tive coverage (RC), relative frequency (RF), and importance value (IV) of each species was calculated. In addition, all
seaweeds were divided into six functional-form groups based on thallus morphology and internal structure: sheet, filamen-tous, coarsely branched, thick-leathery, jointed-calcareous, and crustose forms (Littler and Littler, 1984; Steneck and Dethier, 1994; Padilla and Allen, 2000). The biomass of each group was calculated. The dominance index was calculated based on seaweed biomass using the method of McNaughton (1967). Diversity (H'), richness (R), and evenness (J') indi-ces were assessed with biomass data of each species using the PRIMER statistical package (version 6.0). Similarities among the three study sites based on seaweed biomass (g dry wt/m2) transformed data were calculated using a cluster analysis. The similarity profile test (SIMPROF) was used to examine the difference within each of the groups identified by the cluster analysis. K-dominance curves using seaweed biomass (g dry wt/m2) data were also obtained using PRIMER to compare dominance patterns for the three study sites (Lambshead et al., 1983).
A total of 68 species including 5 green, 11 brown, and 52 red algae were identified at the three islands (Table 1). Howev-er, the total number of species present was significantly lower at Ongdo Island than at Jusamdo and Woejodo. In total, 32 species (2 green, 4 brown, and 26 red) were found along the Ongdo rocky shore, whereas 45 seaweeds (4 green, 9 brown, and 32 red) and 44 species (2 green, 6 brown, and 36 red) were identified at Jusamdo and Woejodo, respectively. Red algae were the dominant taxon in term of species richness, ac-
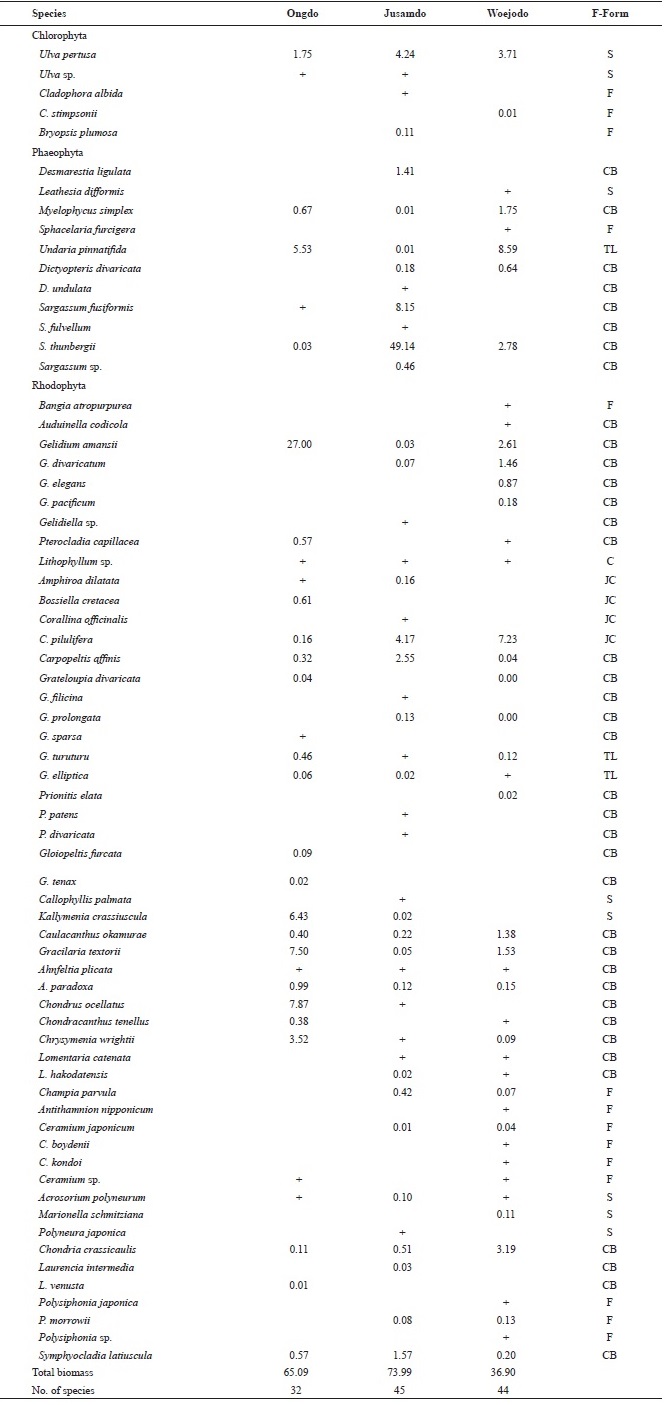
Macroalgal lists biomass (g dry wt/m2) and functional (F) forms occurred at Ongdo Jusamdo and Woejodo the Yellow Sea Korea in August 2006
counting for an average of 76.47% (52 species) of the species at all three study sites, ranging from 71.11% (32 species) at Jusamdo to 81.82% (36 species) at Ongdo. A total of 1 green (
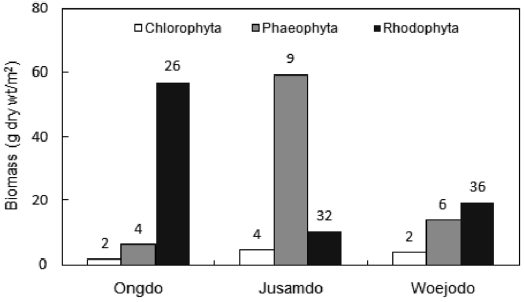
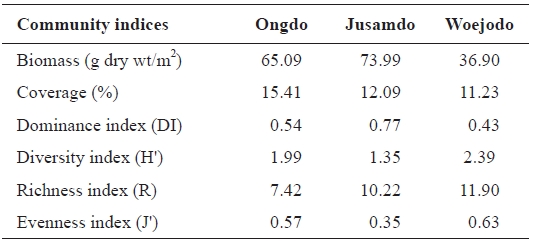
The seaweed biomass was greatest at Jusamdo (73.99 g dry wt/m2), followed by Ongdo (65.09 g dry wt/m2) and Woejodo (36.90 g dry wt/m2) (Table 2). The biomasses of the macroal-gal taxon groups ranged from 1.75-57.11 g dry wt/m2 (2.69-87.74%) at Ongdo to 3.72-19.42 g dry wt/m2 (10.08-52.63%) at Woejodo. Red and green algae accounted for the highest and lowest biomasses at Ongdo and Woejodo Islands, respec-tively (Fig. 2). At Jusamdo, the seaweed biomasses were as follows: 4.35 g dry wt/m2 (5.88%, green), 10.28 g dry wt/m2 (13.89%, red), and 59.36 g dry wt/m2 (80.23%, brown) (Fig. 2). Jusamdo Island was unique in that the brown seaweeds showed the highest biomass.
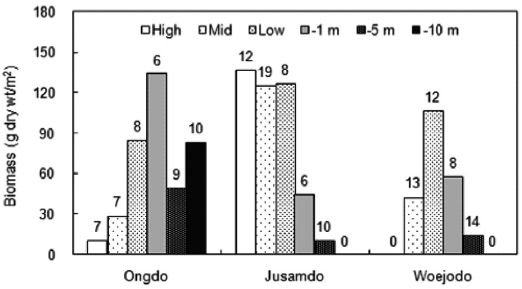
The vertical distribution of seaweed biomasses showed clearly different patterns at the three study sites (Fig. 3). At Ongdo Island, the macroalgal biomass was distributed from the high intertidal zone to the -10 m subtidal zone and ranged from 10.39 g dry wt/m2 to 134.00 g dry wt/m2 at -10 m at these locations, respectively (range: 6 to 10 species). At Jusamdo, seaweeds were present within the high intertidal zone to -5 m depth, with biomasses ranging from 10.50 g dry wt/m2 at -5 m depth to 136.48 g dry wt/m2 in the high intertidal zone (species richness, 6-19 species). The distribution of seaweeds was nar-row from the mid intertidal zone to the -5 m depth zone with

Average biomass (g dry wt/m2) percent coverage (%) and various community indices for seaweed biomass at Ongdo Jusamdo and Woejodo Islands the Yellow Sea Korea
seaweed biomass ranging from 14.41 g dry wt/m2 to 106.69 g dry wt/m2 at the low intertidal shore (from 8 to 14 species). The largest seaweed biomass was found at the -1 m depth zone (Ongdo), in the high intertidal zone of Jusamdo, and at the low intertidal zone of Woejodo (Fig. 3). In terms of vertical distribution, there was no clear relationship between species richness and biomass, and the species richness was highest in the -10 m subtidal zone off of the Ongdo shore as well as in the mid-intertidal zone (Jusamdo and Woejodo). Macroalgal
biomass was greater in the intertidal zone than in the subtidal zone at both Jusamdo and Woejodo, whereas the opposite pat-tern was observed at Ongdo. The average biomass of intertidal seaweeds ranged from 41.40 g dry wt/m2 (Ongdo) to 129.56 g dry wt/m2 (Jusamdo), while that of the subtidal zone was between 27.67 g dry wt/m2 (Jusamdo) and 91.70 g dry wt/m2 (Ongdo) calculated from depths of -1 m to -5 m.
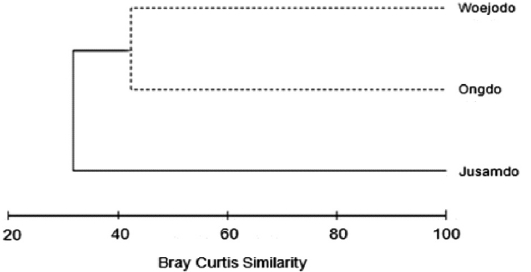
The similarity analysis using seaweed biomass data at the three study sites clustered the data into the Jusamdo group and the Ongdo-Woejodo group (Fig. 4). The similarity between these groups was 32.04%, which was significantly different in terms of seaweed biomass (SIMPROF test,
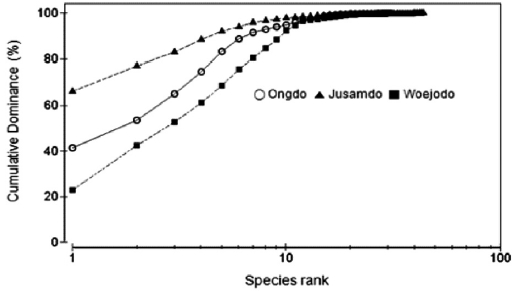
The K-Dominance curves based on seaweed biomass were slightly different between the three study sites in terms of spe-cies evenness (Fig. 5). On the rocky shore of Jusamdo Island, the dominant seaweeds
The seaweed coverage was greatest at Ongdo (16.61%), followed by Jusamdo (14.51%) and Woejodo (13.48%). The average seaweed coverage along the Ongdo rocky shore was 16.61% from the high intertidal zone to the -5 m zone (we ex-cluded the -10 m coverage to enable comparisons with the oth-er islands), and varied vertically from 3.60% to 30.86%. The total seaweed coverage was 14.51% (from 2.70 at -5 m depth to 23.55% at the mid intertidal zone) at Jusamdo and 13.48% on the Woejodo rocky shore (from 0.00% in the high intertidal zone to 25.99% in the low intertidal zone). The seaweed cov-erage at Ongdo was greater in the subtidal zone (22.01%) than in the intertidal zone (13.00%). Conversely, the algal coverage at both Jusamdo (21.73% in the intertidal zone, 3.68% in the subtidal zone) and Woejodo (14.06%, 12.60%) were highest in the intertidal zones.
Abundant species (IV > 10) were
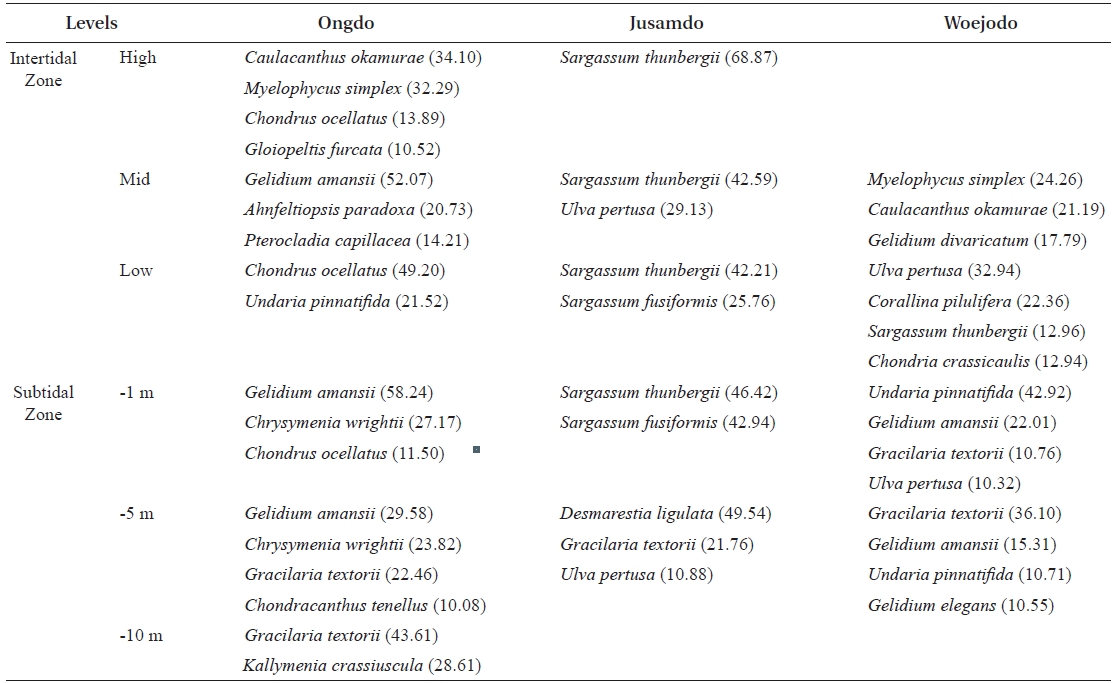
The vertical distributions of the dominant seaweed species based on IV are provided in Table 4. The dominant seaweeds (IV>20) of each shore level at Ongdo Island were
The same six functional-form groups (
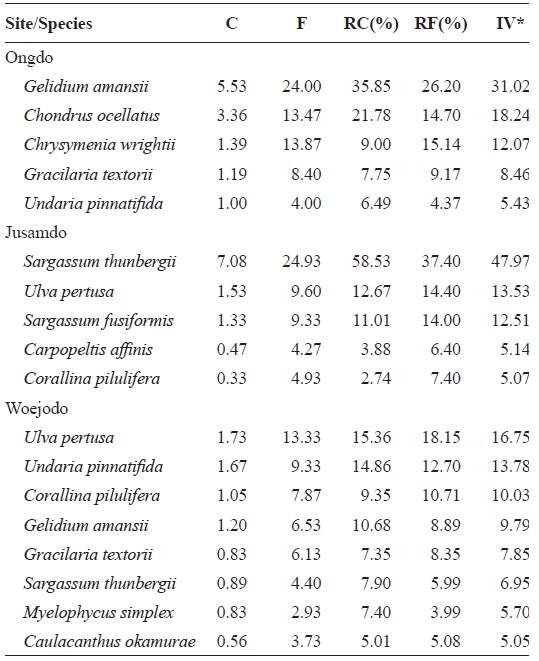
Average coverage (C) frequency (F) relative coverage (RC) relative frequency (RF) and importance value (IV) of seaweeds occurred on the rocky shores of Ongdo Jusamdo and Woejodo Islands the Yellow Sea Korea
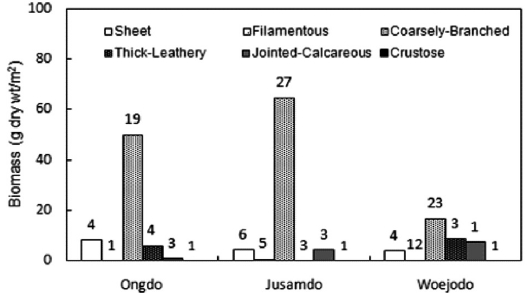
group, accounting for 12.57% and 5.90% of the total biomass, respectively. However, at Woejodo, the thick-leathery form (second group, 23.61%) and jointed-calcareous form (third group, 19.57%) had very similar biomasses (Fig. 6). As shown in Table 3,

Vertical distribution of dominant seaweeds based on importance value (IV > 10) at the three study sites of Yellow Sea Korea
were dominant on the Jusamdo rocky shore. However, at Woejodo, the abundant seaweeds (IV ? 10) were
Seaweed species richness is a basic tool showing the condi-tions of coastal marine ecosystems because it responses sen-sitively to environmental changes of seaweed habitats (Wells et al., 2007). During summer, seaweed species richness has been reported to vary from 14 species at Oshikto (Park and Kim, 1990) to 16 species at 10 Islands (from Deokjegdo to Seungbongdo Islands) of the Gyonggiman islets (Lee et al., 1997) and 70 species at Sapsido (Yoon and Boo, 1991) in the Yellow Sea, Korea. In the present study, 32, 45, and 44 spe-cies were identified at Ongdo, Jusamdo, and Woejodo Islands, respectively, during the summer. These data suggest that the environmental conditions at the three study sites are better than many other island areas in terms of algal species richness.
Seaweed biomass determines the amount of primary pro-duction in marine ecosystems because macroalgae are used as food sources of many marine animals (Terawaki et al., 2001; Eklof et al., 2005). Thus, seaweed biomass is a common indi-cator of the health of marine ecosystems. In the island areas of the Yellow Sea, the average seaweed biomass of the intertidal zone is 89.25 g dry wt/m2 and varies from 23.78 g dry wt/m2 at Oshikto Island (Park and Kim, 1990) to 176.68 g dry wt/m2 at Nachido Island in the summer. At our study sites, the macroalgal biomasses of intertidal rocky shores ranged from 41.40 g dry wt/m2 (Ongdo) and 49.83 g dry wt/m2 (Woejodo) to 129.56 g dry wt/m2 (Jusamdo) in August 2006. Thus, the conditions along the Woejodo and Ongdo shores appeared relatively poor, whereas Jusamdo was in better condition.
The dominant seaweed taxon and seaweed biomass are al-ways tightly correlated (Littler and Littler 1980). Brown algae dominate the island areas of the Yellow Sea, with
Functional form composition in seaweed community is an-other important indicator of environmental conditions (Choi et al., 2008). During the summer, coarsely-branched seaweeds are the major group in terms of species number, making up 33.33% to 78.95% of the seaweed forms (from Shimwon to Nachido) in the island areas of the Yellow Sea (Hwang et al., 1996; Lee et al., 2007; Yoo et al., 2007). Sheet and filamen-tous groups exhibit relatively high proportions, ranging from 5.26% (at Nachido) to 45.45% (at Hyanghado, Maseom) due to the high water turbidity during the summer (Hwang et al., 1996; Lee et al., 2007; Yoo et al., 2007). Generally, sheet-like and filamentous seaweeds, such as
In conclusion, a total of 68 species, including 5 green, 11 brown, and 52 red algae, were identified at three study sites in August 2006. Seaweed biomass was highest at Jusamdo (74.01 g dry wt/m2) and lowest at Woejodo (36.92 g dry wt/m2). The dominant seaweed species included