GC-MS is an essential tool in chemical analysis of complex compounds and routinely used for environmental analysis, quality control, and drug testing.1 A quadrupole mass analyzer is the most popular detector in GC-MS, but its unit mass resolution hampers confident identification of unknown compounds. TOF MS as a GC detector has become popular in the last decade because of its fast speed and high mass accuracy.2 However, the mass accuracy is typically limited to 10 ppm and not sufficient to uniquely define many chemical compositions. Higher resolution mass spectrometers, such as Fourier transform ion cyclotron resonance (FT ICR)3 and Orbitrap,4,5 have recently been used for the analysis of GC separated compounds and enabled unique chemical composition assignment.
Electron ionization (EI) is the most adopted ionization technique for GC-MS because of its non-specificity for most organic compounds and availability to search against an EI-MS spectral library.6 Extensive fragmentation in EI, however, often leads to the absence of molecular ions and difficulty in identifying co-eluting low abundance molecules. Soft ionization using chemical ionization and clear GC separation is necessary to overcome the limitations. In addition, an EI/CI source is not compatible with an ESI/API source designed for LC-MS and is not available in most high-end mass spectrometers.
Atmospheric pressure ionization (API) has been developed for GC-MS many decades ago,7 but has shown its usefulness only in negative ion mode for selective ionization of certain classes of compounds.8 Recent commercialization of highly sensitive API sources developed for LC-MS has re-vitalized its application for GC-MS and has been applied not only to quadrupole MS4 and TOF MS9?12 but also Q-TOF,13 FT ICR,3 and Orbitrap.4 However, mass spectrometric data acquisition methods have been limited to MS only scans. GC-MS/MS is often used for the analysis of complex volatile compounds, but mostly with chemical ionization and using low resolution tandem mass spectrometers such as ion trap or triple quadrupole MS.14
Here, we report the development of a gas chromatography high resolution tandem mass spectrometry (GC-HRMS/MS) approach using a GC-APPI-linear ion trap (LIT) Orbitrap mass spectrometer for the analysis of complex volatile compounds. We are taking an approach similar to that of LC-MS/MS, particularly those commonly adopted for high throughput proteome analysis.15 This includes automatic MS/MS with LIT for precursors selected from the preview scan of Orbitrap and dynamic exclusion of previously acquired precursor ions for MS/MS of low abundance ions. Our data analysis protocol includes direct elemental composition analysis of precursor ions followed by an MS/MS database search, which has potential to become high throughput but is currently limited by the database. The developed approach is applied for the analysis of a perfume sample and compared to the tradi-tional approach by GC-EI-Q and GC-EI-TOF. The utility of toluene as a dopant was also studied by co-spraying into the interface during GC-APPI-MS analysis.
A perfume sample (CK One; Calvin Klein) was purchased from a local store and solvents were purchased from Sigma (St. Louis, MO) for the best purity (Chromasolv grade). Ultra high purity (99.999%) helium and nitrogen gases were used for GC, GC-MS interface, and mass spectrometer.
>
Gas chromatography and GC-MS interface
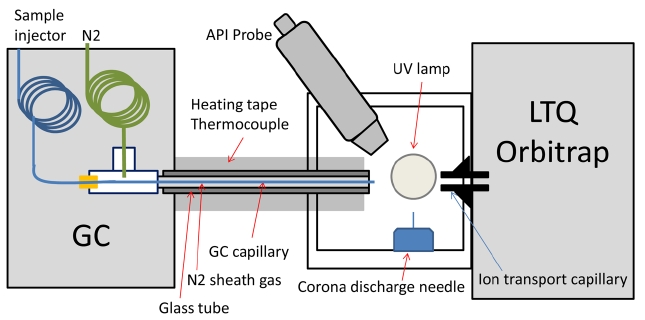
The gas chromatograph used was a Varian (Walnut Creek, CA) Star 3400 CX GC with an HP-5MS column (30 m × 250 μm, 0.25 μm film thickness; J&W Scientific, Folsom, CA). Original FID detector was removed and the port was then packed with insulation. A new port was made on the side of the GC oven to deliver the fused silica capillary to the mass spectrometer inlet via a heated transfer line. This was achieved by feeding the capillary through a t-fitting to introduce heated sheath gas (nitrogen) that kept the capillary at a uniform temperature from the GC oven to the exit tip (Figure 1). The nitrogen gas was heated in the GC oven in stainless steel tubing before entering the t-fitting with a flow rate of about 20 mL/min. This design is based off of McEwen’s GC-APCI-MS interface,9 except that a home-made GC-MS interface with a glass rod and heating tape was used. The temperature of the glass rod was monitored with a thermocouple and controlled to maintain 280 ℃ using a temperature controller (HTS/Amptek, Stafford, TX). The front glass window of the Ion MAX source was removed to allow the heated glass rod/capillary to be interfaced to the mass spectrometer inlet (See the photos in Supplementary Figure 1). The distance between the end of the column and the mass spectrometer inlet is about 1 cm, through which GC eluents are exposed to UV
photons produced by a Krypton lamp (photon energy of 10.0 eV and 10.6 eV; Syagen, Tustin, CA) before being injected to the mass spectrometer.
The column was conditioned by flowing helium carrier gas overnight at a temperature of 250 ℃. Carrier gas flow rate was pressure controlled and the initial rate was estimated to be 4.7 mL/min. A splitless injection was used to introduce 1 μL of the perfume sample to the injection port, which was set at 240 ℃. The GC oven temperature gradient started at 40 ℃, was held for 2 minutes, then heated to 140 ℃ at 10 ℃/min, then to 260 ℃ at 20 ℃/min, and finally held at 260 ℃ for 7 minutes. The interface temperature was maintained at 280 ℃ for the duration of the run.
A dopant spray experiment was also performed by spraying dopant through the API probe to the GC-MS interface while the GC-MS experiment is being performed. A solvent mixture of 15% toluene and 85% methanol was used at a flow rate of 10 μL/min and a vaporization temperature of 350 ℃.
An LTQ Orbitrap Discovery (Thermo Scientific, San Jose, CA) was used for the experiment with an Ion MAX APCI/APPI dual probe source. The ion transfer capillary temperature was set to 150 ℃. The low tube lens voltage of 7 volts was used to minimize in-source CID. Instrument parameters for the API probe such as sheath, auxiliary, and sweep gas were placed to their lowest allowed values except for dopant spray experiment. The instrument was calibrated nine days before the experiments and used without any further mass calibration.
GC-MS/MS data sets were acquired with Xcalibur software in the similar fashion for a typical LC-MS/MS acquisition. Namely, a high mass resolution Orbitrap data acquisition (nominal resolution at 30,000) is followed by one or two data dependent MS/MS scans in the linear ion trap. Preview FFT mode allows maximization of the duty cycle; an intermediate Orbitrap spectrum is interpreted on-the-fly for data dependent decision. Automatic gain control (AGC) was set at the target value of 2 × 10⁵ ions for Orbitrap MS and 1 × 10⁴ ions for LIT MS/MS. Dynamic exclusion was used for the duration of 30 seconds if MS/MS spectra were acquired twice in 15 seconds. Background peaks are added to the reject mass list with the mass tolerance of ±0.03 Da. Collision induced dissociation (CID) was used for MS/MS with a precursor isolation width of 2.0 Da and collision energy of 50%. The activation time was set to 30 ms with an activation Q-value of 0.250.
The same perfume sample was also analyzed on GC-EI-Q (quadrupole MS) and GC-EI-TOF instruments for comparison. For GC-EI-Q, Agilent GC (6890N) and MS (5973N) were used with an HB-5MS column. For GC-EI-
TOF, Agilent GC (6890C) and Micromass TOF (GTC) were used with a DB-5 column (30 m × 250 μm, 0.25 μm film thickness). Gas flow was controlled at a constant flow rate of 1 mL/min for both instruments. A 1 μL injection of the sample was used with the split ratio of 1:50 and 1:100 for GC-EI-Q and GC-EI-TOF, respectively. The same injector and oven temperature program was used with that in the GC-APPI-LIT Orbitrap experiment. EI of 70 eV and a scan range of
AMDIS software (NIST, v2.69) was used for automatic deconvolution and data analysis for GC-EI-Q data and MassLynx software (Micromass, v4.0) was used for GC-EI-TOF with manual background removal. Tentative identification was made by searching EI spectra against the NIST08 EI-MS spectral library with the minimum match score of 800. In GC-EI-TOF, tentative assignment was accepted for each chromatographic peak if the score is higher than 800 in any of the four data sets. The least mass error was accepted between the two lock-mass calibrated GC-EI-TOF data sets because mass error becomes significant in TOF MS when ion signal is too high (≥ 104 ions) or too low (≤ 100 ions).
>
Overview of GC-API-LIT orbitrap
Figure 1 shows the schematic diagram of GC-API-LIT Orbitrap interface and Supplementary Figure 1 shows the photos at the interface. The API interface designed by McEwen was adopted for the current study.9 The only major difference is that Thermo Finnigan’s Ion MAX source allows simultaneous operation of APPI and APCI. We used only APPI in the current study but the use of APCI or both will be investigated in the future. The detailed description of the interface refers to the original paper by McEwen or a short summary in the experimental section.
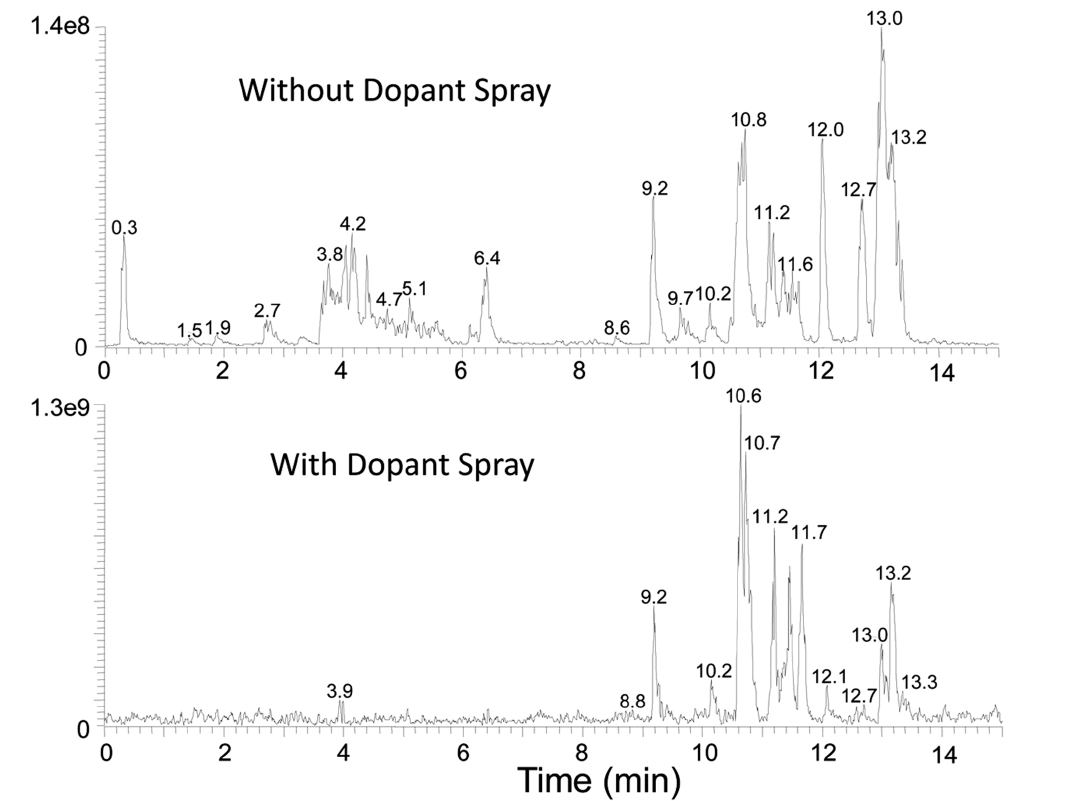
Figure 2 shows the base ion chromatograms of a perfume sample analyzed by GC-APPI-LIT Orbitrap with and without dopant spray. A solution of 15% toluene in methanol was sprayed through the API probe in the dopant experiment to study its efficacy in enhancing ionization efficiency. Ion signals for early eluting peaks, Rt < 8 min, are greatly reduced while late eluting peaks have an order of magnitude signal improvement overall. GC-HRMS/MS data were acquired using a similar strategy commonly adopted for LC-MS/MS: 1) MS acquisition in Orbitrap with the nominal mass resolution of 30,000 (defined at
Fast MS scan speed is one of the most important requirements in GC-MS because a sufficient number of data points is needed across a very narrow chromatographic peak profile. The scan speed in GC-APPI-LIT Orbitrap was 0.66 sec for a set of an Orbitrap scan and an MS/MS scan and 0.94 sec for an Orbitrap scan and two MS/MS scans. In MS only mode, the scan speed was as fast as 0.188 sec per scan at the nominal mass resolution of 7,500. Typical mass accuracy was below 3 ppm, even at the nominal mass resolution of 7,500, because Orbitrap provides higher mass resolution for the low masses commonly analyzed by GC-MS; 17,000?10,000 for
The home-made glass tube interface adopted in the current study has a few limitations. Among others, it produces significant contaminations. Major interference peaks are
with relative abundances of 43, 68, 12, and 13%, respectively, in an MS spectrum averaged for retention time of 1.4?13.5 min (data not shown). These contaminations are present with a relative abundance of at least 0.5% at any retention time. The three most abundant contaminations are attributed to protonated plasticizers, presumably coming from the heating tape; diisobutylphthalate ([C16H22O4 + H+]; (
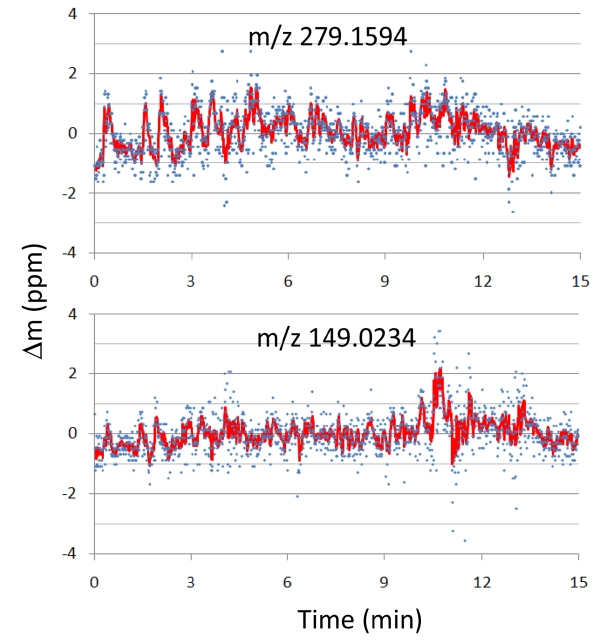
Figure 3 shows the mass position fluctuations of two contamination peaks,
The precision of mass peak position is affected by the change in incoming ion flux at any given time in chromatography-mass spectrometry. When ion flux is low, mass precision is low because of insufficient ion statistics (low S/N). On the other hand, when it is too high, peak position is affected by the space-charge effect (Coulomb repulsion between ions). While Orbitrap and FTICR provides reliable mass precisions over the wide range of ion flux (RMS mass accuracy below 2 ppm for ion flux change of ~104),16 TOF MS, commonly used with GC, has a rather narrow range of acceptable ion flux in order to maintain good mass accuracy (RMS mass accuracy below 3 ppm for ion flux change of ~100, or 5 ppm for ion flux change of ~103).17 Hence, internal calibration with a co-sprayed standard compound is often necessary in TOF MS in order to maintain high mass accuracy throughout the chromato-graphic separation. High mass resolution and stable ion flux controlled by AGC (automatic gain control) allow us to maintain high mass accuracy in our GC-APPI-LIT-Orbitrap throughout the chromatographic time scale, even without any internal calibration.
>
Data analysis for GC-HRMS/MS
We propose a potentially high throughput data analysis protocol for the data set obtained with GC-HRMS/MS. The main idea is similar to that of common proteomics data analysis; extraction of all the MS/MS spectra with accurate precursor mass information and MS/MS database search for identification. The major difference is we also perform direct chemical composition analysis, which was enabled because unique chemical composition assignment is possible for low mass ions with accurate mass information. This approach, along with MS/MS data acquisition in dynamic exclusion mode, can potentially identify hundreds of compounds in a single data set as shown routinely in typical LC-MS/MS based proteomics. For example, MASCOT distiller (v. 2.3.2.0; Matrix Science, UK) could extract over six hundred high quality MS/MS spectra along with their accurate precursor ion information for the data set shown in Figure 2.
High throughput application of the proposed protocol is currently overshadowed by a few practical limitations. First, the precursor spectrum is composed of not only molecular or pseudo-molecular ions but also oxidative primary ions and some in-source CID fragments, as will be discussed in the next section. Further optimization of experimental parameters is necessary to minimize this problem. Second, there is no comprehensive MS/MS database or

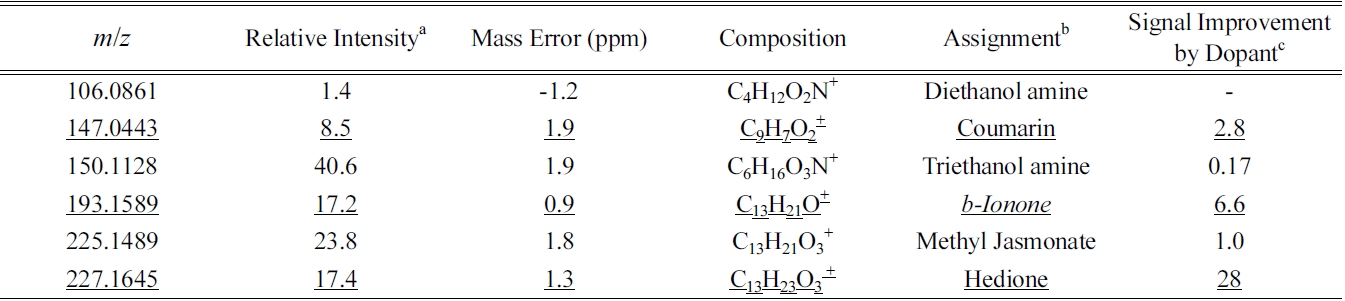
Tentatively identified perfume compounds in GC-APPI-LIT-Orbitrap through chemical composition analysis and MS/MS database search
comprehensive and their wide-spread use is limited. In the proteomics data analysis pipeline, in contrast, fragmentation of peptides is rather predictable, as they mostly occur through amide backbone cleavage. Once these bottlenecks are overcome, a high throughput data analysis program could be written that automatically calculates each chemical composition of precursor ions and searches the MS/MS spectra against either comprehensive database or theoretically predicted MS/MS spectra of all the possible structural isomers.
In the current study, we demonstrate the plausibility of the proposed approach by manually analyzing a few high quality MS and MS/MS spectra. The process was divided into two steps: chemical composition analysis of a few major peaks and their MS/MS search against public MS/MS databases. Twenty six major peaks were chosen in the two data sets that are not in-source fragmentation, common contamination, or oxidative ionization product, and have at least one high quality MS/MS spectrum (Supplementary Table 1). Chemical composition analysis was performed with the maximum number of carbon, hydrogen, nitrogen, and oxygen of 50, 100, 5, and 15, respectively. Halides, sulfur, and phosphorous were not considered because they are not expected to be present in perfume, nor found in GC-EI-MS analysis. All the assigned chemical compositions were below 3 ppm mass errors and they are the only chemical compositions possible within 5 ppm.
Except for two peaks,

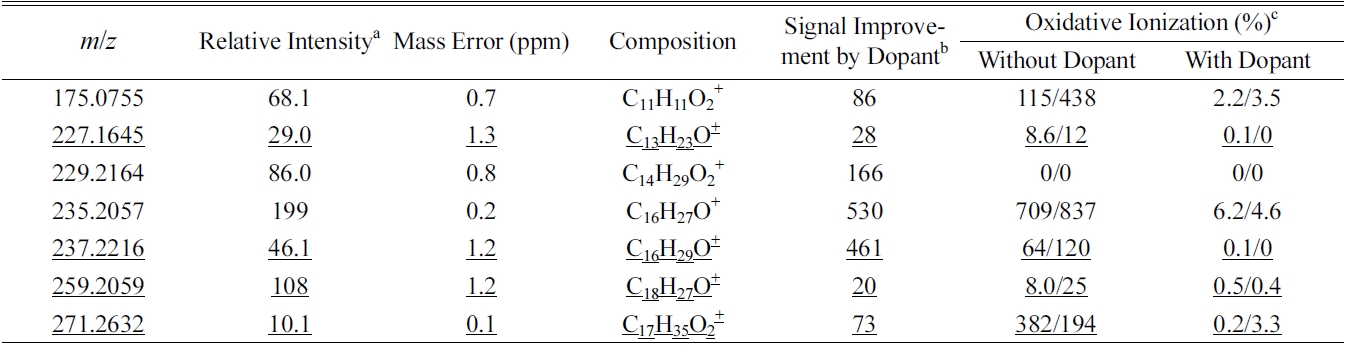
Chemical compositions of some perfume compounds with signal increase of more than twenty times with dopant spray
reported predominance of protonated pseudo-molecular ions in GC-APPI-MS of butyldimethylsilylated amino acids.20 Microchip APPI was reported to preferentially produce protonated pseudo-molecular ions for androgenic steroids.5 In our experimental conditions, protonation seems to be dominant over radical cation formation.
For the comparison, GC-EI-Q and GC-EI-TOF analyses were performed for the same perfume sample. Combined, a total of 36 chemical compositions were tentatively identified for the two GC-EI-MS analyses as shown in Supplementary Table 2. In any of the data analyses, we did not use a retention time index for exact identifications of perfume compounds, because it is beyond the purpose of current study. Half the tentatively identified chemical compositions are mutually exclusive between GC-APPI-LIT Orbitrap and GC-EI-MS, suggesting the two techniques are complementary to each other. The primary difference is attributed to the difference in ionization efficiencies for different classes of compounds.
The presence of molecular ions, preferentially with chemical composition analysis, is often critical in EI-MS spectral interpretation.21 However, almost half the tentative identifications do not have molecular ions or have only weak ions (< 10% of base peak) in GC-EI-Q. For those molecular ions detected in GC-EI-TOF, chemical compositions were all matching with the corresponding library search results in 10 ppm mass errors with the help of lockmass internal calibration and careful background removal. However, 7 out of 17 have two possible chemical compositions in 10 ppm mass tolerance. The overall mass error for those tentatively identified compounds is 3.34 ± 2.11 ppm in GC-EI-TOF with internal calibration (Supplementary Table 2), while it is 1.32 ± 0.65 ppm in GC-APPI-Orbitrap without internal calibration (Supplementary Table 1).
>
Structural assignments of MS/MS spectra
A total of forty MS/MS spectra out of twenty six major chemical compositions in GC-APPI-LIT Orbitrap were manually searched against publicly available MS/MS databases: NIST 08 MS/MS database, Metlin (http:// metlin.scripps.edu/), and MassBank (http://www.massbank.jp/). For the chemical compositions also identified in GC-EI-Q or GC-EI-TOF, a literature survey was also performed to find the reported MS/MS spectra. Tentative chemical identification was made for six of them as summarized in Table 1. Most MS/MS spectra in the databases are acquired with a triple quadrupole mass spectrometer (QQQ) or Q-TOF. There are some major differences in MS/MS spectra between an ion trap mass spectrometer and QQQ or Q-TOF. Ion trap MS/MS produces mostly high mass fragments because of low mass cutoff and predominance of single fragmentations, while QQQ or Q-TOF produces a wide range of fragment ions particularly with low mass fragments from multiple activations and fragmentations. Careful comparison was made between our ion trap MS/MS spectra and those in the database; high to mid fragment ions are mostly used to determine the matching and the intensity differences are largely ignored. The database coverage is so poor that almost half the chemical compositions (12 out of 26) do not have any MS/MS spectra in any of the databases for the same chemical compositions.
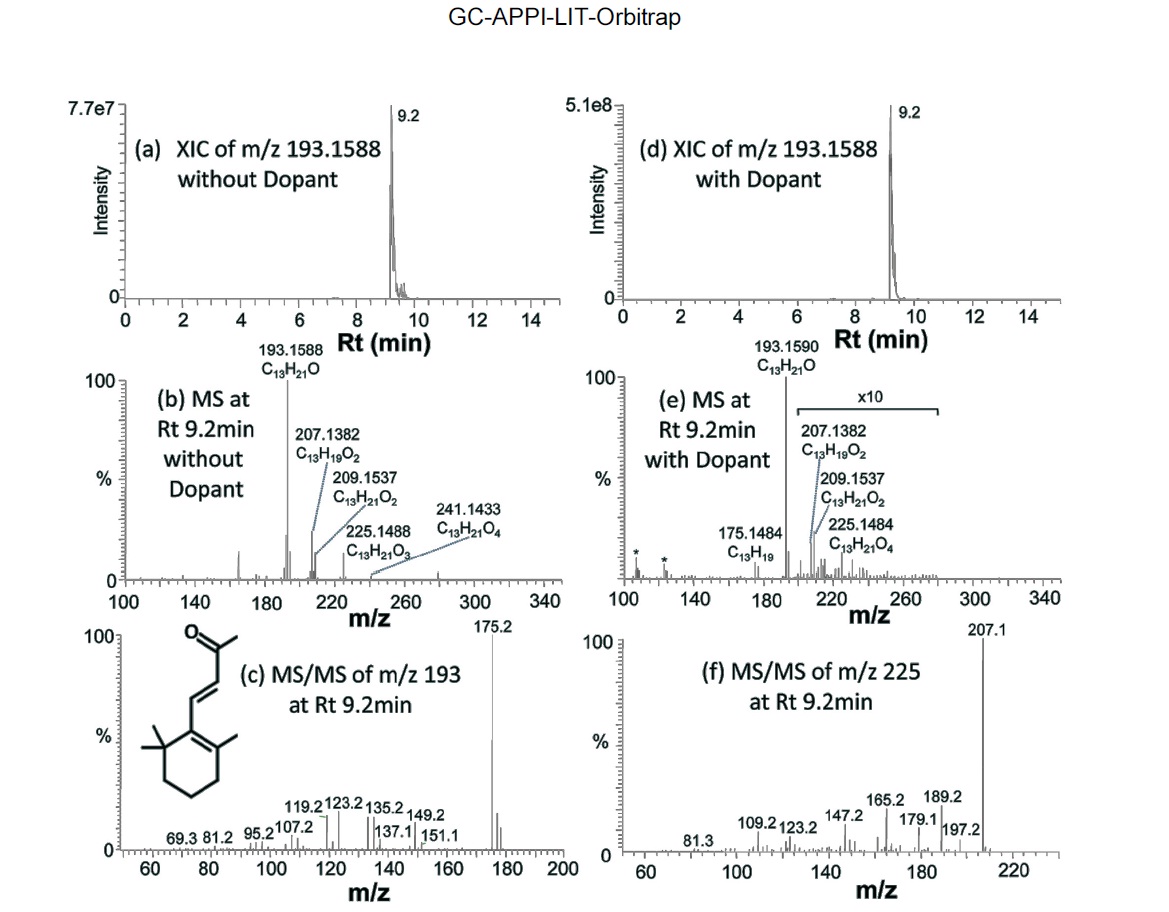
Figure 4 shows an example of identified compounds, b-Ionone (C13H20O), a well-known perfume compound. Extracted ion chromatogram (XIC) of protonated b-Ionone constructed with 10 ppm mass tolerance shows a single chromatographic peak at Rt of 9.2 min, for both without and with dopant (Figure 4a and 4d). A series of oxidative precursor ions are present in the mass spectrum (Figure 4b):
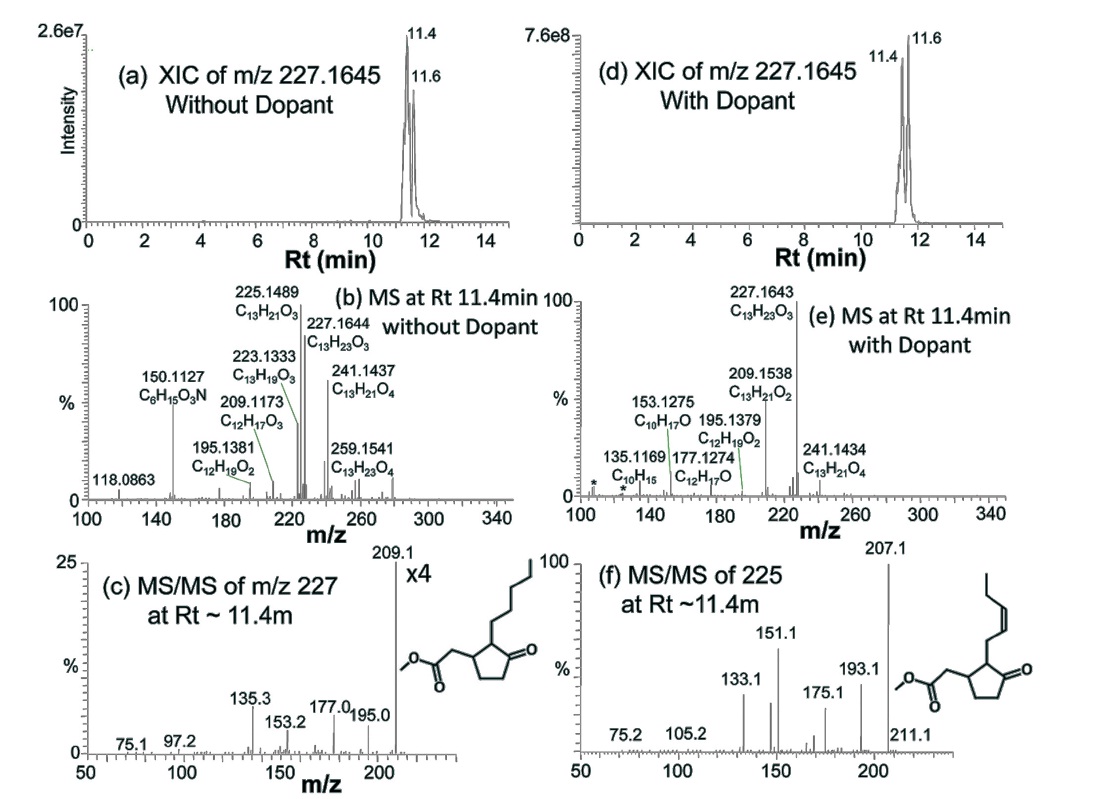
Figure 5 shows the identification of two other wellknown perfume compounds, methyl jasmonate and methyl dihydrojasmonate (hedione). Hedione was detected in both GC-EI-Q and GC-EI-TOF, but methyl jasmonate was not. XIC of hedione (
Co-spraying dopant during GC-APPI-MS analysis has two advantages for some compounds like b-Ionone and hedione. As can be seen from the Y-scales of Figure 4a and 4d and Figure 5a and 5d, the ion signal was improved by 6.6 times for b-Ionone and 28 times for hedione by spraying dopant. In addition, oxidative ionization is significantly reduced in its MS spectrum. b-Ionone, for example, has ten times lower relative abundances for
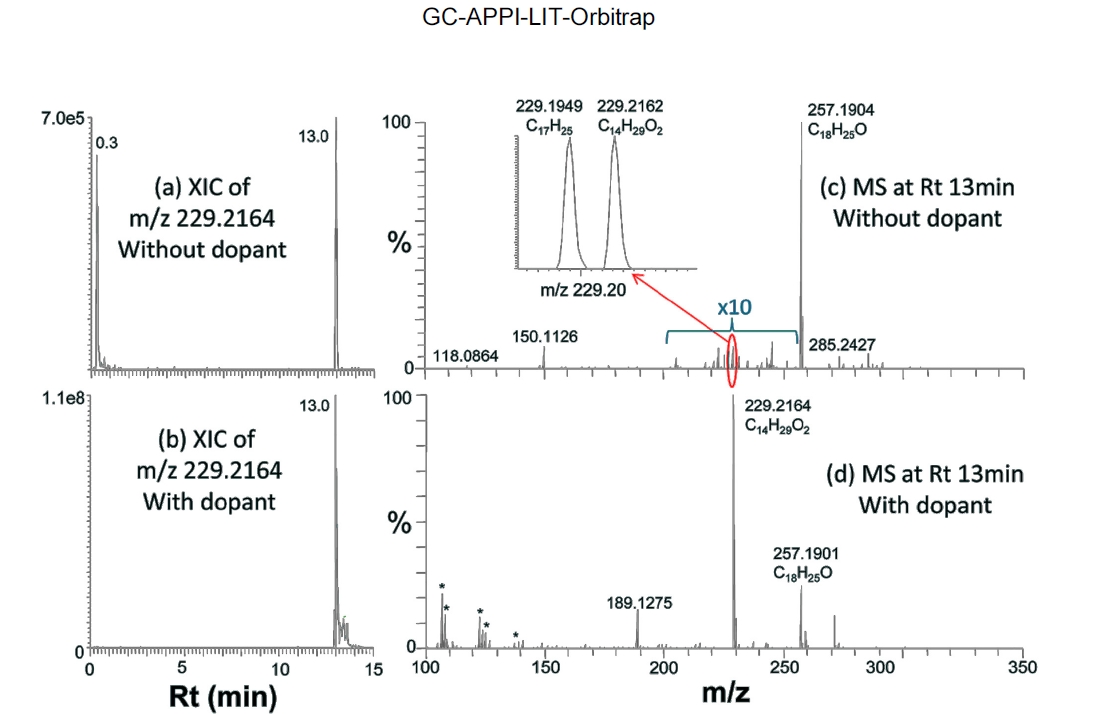
(+2O?H2O), 225 (+2O), and 241 (+3O) with dopant than those without dopant (Figure 4e vs. Figure 4b). The same trend can also be found for hedione in Figure 5e vs. Figure 5b. Figure 6 demonstrates how significantly dopant can enhance ionization and detection of some compounds. XIC of
Table 2 summarizes some major compounds with at least twenty times signal improvement by spraying dopant. Signal improvement was up to two orders of magnitude and oxidative ionization was all significantly reduced. There is a close correlation between the ion signal enhancement and the oxidation reduction induced by dopant spray. In general, signal enhancement is more significant when there is higher oxidation without dopant. However, the amount of oxidation reduction does not quantitatively correspond to the signal improvement. In addition, some other ions, such as
Dopant spray has a few limitations in the application to GC-APPI-MS. First, new background ions show up with significant intensities; a series of ions at
We have developed a new approach for the analysis of complex volatile compounds, GC-HRMS/MS, using GC-APPI-LIT Orbitrap. Chemical composition analysis of precursor ions followed by an MS/MS spectral search was successfully demonstrated for the analysis of a complex perfume sample. This approach is complementary to the conventional GC-EI-MS analysis, improving the confidence in identification of the compounds with both methods and increasing the chance to identify low abundance co-eluting compounds. Above all, it is compatible with atmospheric pressure ionization sources designed for LC-MS/MS and easily adaptable to high-end mass spectrometers without need of significant instrument modifications. A few hurdles need to be overcome for this approach to become useful as a tool for high throughput volatile compound analysis. Experimental conditions need to be optimized to minimize in-source oxidation and fragmentation. The most critical limitation is the insufficient coverage of the current MS/MS databases, which should be eventually overcome as the public MS/MS database size increases and/or by the success of
APPI-LIT Orbitrap is best suited for the proposed GC-HRMS/ MS approach. Its scan speed is not as fast as TOF, but is comparable to that of quadrupole MS, and it provides sufficient data points for each chromatographic peak. Its reliable mass accuracy is the greatest advantage over TOF MS and could provide 3?4 ppm mass accuracy without any internal calibration. If needed, lock-mass calibration could be utilized to achieve 1?2 ppm mass accuracy.4,23 As suggested by Kind and Fiehn, even 1 ppm mass accuracy might not be sufficient to assign a unique chemical composition when more chemical elements are in consideration.24 Isotope peak ratios and other criteria could be utilized to enhance the confidence of elemental composition analysis.24,25 The most recent Orbitrap mass spectrometer, such as Q-Exactive (12 Hz, mass resolution of up to 140,000), provides much faster scan speed and better mass resolution. We envision GC-APPI-QTOF could also be efficiently used for the proposed GC-HRMS/MS approach because of its fast scan speed, decent mass accuracy, wide range of fragment ions (thus, better compatibility with the current databases), and, most of all, accurate tandem mass spectra.
Over the half century of GC-MS history, the analysis of complex volatile compounds largely relied on high resolution gas chromatographic separation and GC-EI-MS spectral library search. The fundamental limitation of the traditional approach is obvious, especially for extremely complex mixtures with wide dynamic ranges. We are hopeful the proposed approach would become a powerful tool to complement the current EI-MS based approach and resolve the current bottleneck.
Supplementary Tables and Figures associated with this article may be found in the online version.